Abstract
Purpose
Using a retrospective analysis of treatment plans submitted from multiple institutions accruing patients to the RTOG #0236 non-small cell SBRT protocol, this study determines the dose prescription and critical structure constraints for future SBRT lung protocols that mandate density corrected dose calculations.
Method and Materials
A subset of twenty patients from four institutions participating in the 0236 protocol and using superposition/convolution algorithms are compared. The 0236 protocol required a prescription dose of 60 Gy delivered in three fractions to cover 95% of the PTV volume. Additional requirements were specified for target dose heterogeneity and dose to normal tissue/structures. The protocol required each site to plan the patient’s treatment using unit density, and another plan with the same monitor units and applying density corrections was also submitted. These plans have been compared to determine dose differences. A two-sided paired student’s t-tests were used to evaluate these differences.
Results
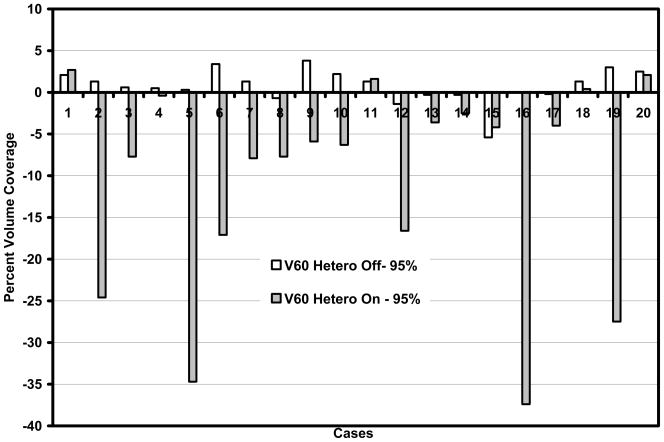
With heterogeneity corrections applied, the volume of PTV receiving 60 Gy or more (V60) decreased on average 10.1% (SE=2.7%) from 95% (p=0.001). Maximum dose to any point 2 cm or greater away from the PTV increased from 35.2 Gy (SE =1.7 Gy) to 38.5 (SE=2.2 Gy).
Conclusions
Statistically significant dose differences were found with heterogeneity corrections. The information provided in this study is currently being used for designing future heterogeneity corrected RTOG SBRT lung protocols to match the true dose delivered for 0236.
Keywords: RTOG, Stereotactic Body, Radiation Therapy, Non-Small Cell Lung Cancer
Purpose
Lung cancer remains the most frequent cause of cancer death in both men and women in North America. Lung cancer accounts for approximately 15% of all cancers diagnosed but 26–31% of all cancer deaths. 1 These statistics have been more or less stable over the years 2–4. Seventy-five percent of patients with bronchogenic carcinoma will be diagnosed with non-small cell lung cancer (NSCLC). Approximately 15–20% of NSCLC patients present with early or localized disease. 5 The number of patients diagnosed with stage I NSCLC is expected to rise significantly in the next several decades due to widespread screening with spiral CT scanning.6 Surgical resection of stage I (T1-2, NO) NSCLC results in five-year survival rates of approximately 60–70%, 7–9 and remains the treatment of choice for this population. Unfortunately, some patients with early stage NSCLC are unable to tolerate the rigors of surgery or the post-operative recovery period due to lack of adequate respiratory reserve, cardiac dysfunction, diabetes mellitus, vascular disease, general frailty, or other co-morbidities. Primary radiotherapy for early stage non-small lung cancer is considered reasonable non-surgical therapy for such patients, with reported five-year survival rates ranging from 10–30%. 10–16 The standard approach involves giving approximately 45–66 Gy total dose in 1.8–2.0 Gy fractions. This regimen has been established based on early experience of treatment with radiation and has been justified by widely accepted models of radiobiological effects of x rays on human tissue. Early evaluations of radiation therapy showed that the delivery of large radiation field treatments was leading to unacceptably high toxicities17. However, early radiotherapy delivery techniques were limited in the inability to decrease exposure of normal tissues due to low beam energies utilized. These treatments suffered also from large targeting uncertainties caused by the unavailability of modern imaging techniques and less than ideal representations of the dose distribution inside the patient anatomy18.
Newer techniques such as 3-D conformal radiotherapy (3D-CRT) have been proven to allow significant dose escalation of fractionated radiotherapy in locally advanced lung cancer in a Radiation Therapy Oncology Group (RTOG) trial. 19 SBRT, which utilizes elements of 3-DCRT in addition to stereotactic localization, incorporates a variety of systems for decreasing the effects of lung and other organ motion that would otherwise translate into target motion. These systems allow even more dramatic reduction of treatment volumes facilitating hypofractionation with markedly increased daily doses and significantly reduced overall treatment time. RTOG protocol 0236 is designed to determine if radiotherapy involving high biological dose with limited treatment volume (using SBRT techniques) achieves acceptable local control (i.e., 80%) in frail patients with medically inoperable early stage non-small cell lung cancer.
Dose calculation with/without tissue density corrections are reported to have dramatic deviations for radiotherapy planning especially in the thoracic region 20–23. The differences exist for the dose to the isocentric point, and for the dose distributions, including target coverage and normal structure sparing. Many centers participating in RTOG trials for lung cancer did not have access to more accurate dose calculation techniques such as superposition/convolution algorithms or Monte Carlo method in 2000 and 2001 when RTOG 0236 was being designed. In addition, phantom measurements and calculations reported in the literature showed that reasonable accuracy and more importantly consistency from center to center could be achieved by simply not using the vendor’s heterogeneity correction algorithm 24. It was therefore decided not to allow tissue heterogeneity correction for calculating monitor unit settings for RTOG 0236 25. As required by the protocol, all dose planning and calculation of monitor units for actual treatment were performed with all tissues assuming unit (water) density. However, in an effort to ultimately better understand these effects for improving future protocols, each plan was also calculated with software vendor supplied heterogeneity corrections and submitted for QA purposes. The computation using heterogeneity corrections had beam weights manipulated such that the number of monitor units was the same for each beam between the plans.
This study evaluates those treatment plans with and without heterogeneity corrections submitted from multiple institutions accruing patients to RTOG protocol 0236 and reports on the effect of tissue density correction on the various dose objectives specified in the protocol.
Method and Materials
This analysis was limited to those institutions which used treatment planning algorithms that approximate changes for lateral electron transport in contrast with those based on equivalent path length correction only. Studies have found that, if commissioned appropriately, models that consider changes in lateral electron transport tend to predict doses more accurately when compared with Monte Carlo calculations and/or actual dose measurements 26–30. The planning systems and heterogeneity correction algorithms meeting these criteria were Pinnacle (Royal Philips Electronics of the Netherlands) collapsed cone and CMS/XIO (The Elekta Group) superposition/convolution algorithms.
The system from Pinnacle is based on a fluence model using collapsed cone convolution, in which the kernel is not separated into primary and scatter components during convolution 31–34. The XiO system from CMS has two fluence dose calculation models, a Fast Fourier Transform (FFT) based convolution algorithm and a more exact multi-grid fast superposition method 35, 36. The FFT convolution is performed in the frequency domain with the kernel from Mackie et al37. For the multi-grid superposition method, during integration the kernels which are now represented in spherical coordinates are modified according to density changes in the irradiated medium with the use of a varying resolution for the calculation grid depending on potential dose gradients, e.g., at high density gradients and at beam edges a finer grid is used. A brief summary of the treatment planning requirements for the protocol 38 is given below.
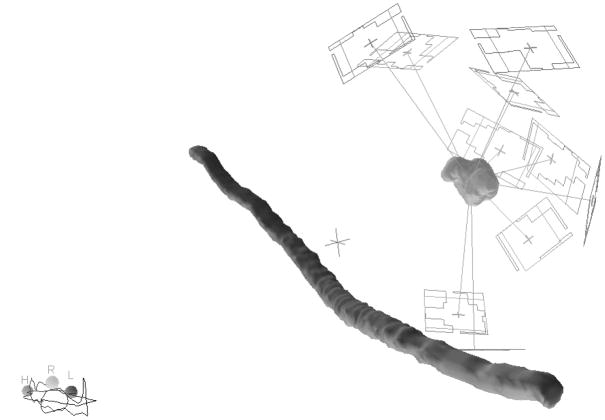
Three-dimensional coplanar or non-coplanar beam arrangements will be custom designed for each case to deliver highly conformal prescription dose distributions. Non-opposing, non-coplanar beams are preferable. Seven or more beams of radiation will be used with roughly equal weighting. A typical beam arrangement is shown in Figure 1.
Field aperture size and shape should correspond nearly identically to the beam’s-eye view (BEV) projection of the PTV (i.e. no additional “margin” beyond the PTV)
All tissues within the body, including lung, were assumed to have unit (water) for planning calculation. However, each plan was also calculated, using the same monitor units as the unit density plan, with heterogeneity corrections enabled. The protocol required the submission of the corrected plan in digital form for QA purposes.
The plan should be normalized to a defined point corresponding closely to the center of mass of the PTV (called the COMPTV).
The prescribed dose of 60 Gy should cover 95% of the PTV.
A dose that is 90% of the prescribed dose (54 Gy) should cover at least 99% of the PTV.
Under the above conditions, the maximum dose within the target should fall between 67 and 100 Gy.
Any dose greater than 105% of the prescription dose (63 Gy) should occur primarily within the PTV. The cumulative volume of all tissue outside of the PTV receiving a dose greater than 105% of prescription dose (63 Gy) should be no more than 15% of the PTV.
-
Conformality of PTV coverage for this protocol is judged by the following constraints:
The ratio of the volume of the prescription isodose to the volume of the PTV is to be no more than 1.4 (Table 1). This criterion will not be required in treating very small tumors (< 2.5 cm axial GTV dimension or < 1.5 cm cranio-caudal GTV dimension).
The falloff gradient beyond the PTV must be rapid in all directions and meet the following criterion: The maximum total dose in Gy to any point 2 cm or greater away from the PTV must be less than the number given in the column titled “maximum dose 2 cm from the PTV” in Table 1. This table only lists unacceptable major deviations.
The ratio of the volume within the isodose surface corresponding to a dose of 50% of the prescription dose (30 Gy) to the volume of the PTV must be no greater than the R50% value given in Table 1.
The absolute maximum dose limits for critical structures are listed in Table 1 and Table 2.
Figure 1.
The non-coplanar beam arrangement for the 3D conformal planning of the stereotactic radiation treatment (PTV and cord are shown in solid, orientation icon labels: H:head, R:Right, L:Left).
Table 1.
Dosimetric criteria for target coverage, “Homo” are for unit density and “Hetero” are suggested adjustments to be used when heterogeneity correction are applied.
| Maximum PTV Dimension (cm) | Ratio of Prescription Isodose Volume to the PTV | Ratio of 50% Prescription Isodose Volume to the PTV, R50% | Maximum Dose 2 cm from PTV in any Direction, D2cm % of Prescription Dose | Percent of Lung receiving 20 Gy total or more, V20 (%) | PTV Volume (cc) | |||
|---|---|---|---|---|---|---|---|---|
| Major Deviation | Major Deviation | Major Deviation | Major Deviation | |||||
| Homo 60 Gy | Hetero 56 Gy | Homo | Hetero | Homo | Hetero | |||
| 2 | >1.4 | >4.1 | >7.0 | >50.2 | >55.2 | >15 | 1.8 | |
| 2.5 | >1.4 | >4.1 | >5.8 | >50.2 | >55.2 | >15 | 3.8 | |
| 3 | >1.4 | >4.1 | >5.4 | >50.2 | >55.2 | >15 | 7.4 | |
| 3.5 | >1.4 | >4.1 | >5.3 | >50.2 | >55.2 | >15 | 13.2 | |
| 4 | >1.4 | >4.0 | >5.2 | >54.0 | >59.7 | >15 | 21.9 | |
| 4.5 | >1.4 | >3.9 | >5.0 | >57.8 | >62.8 | >15 | 33.8 | |
| 5 | >1.4 | >3.8 | >4.8 | >61.8 | >75.2 | >15 | 49.6 | |
| 5.5 | >1.4 | >3.7 | >4.5 | >69.5 | >83.8 | >15 | 69.9 | |
| 6 | >1.4 | >3.5 | >4.1 | >69.5 | >86.8 | >15 | 95.1 | |
| 6.5 | >1.4 | >3.3 | >3.7 | >73.3 | >88.7 | >15 | 125.8 | |
| 7 | >1.4 | >3.1 | >3.5 | >77.2 | >90.7 | >15 | 162.6 | |
Table 2.
Dose limits for critical structures
| Organ | Volume | Dose (cGy) |
|---|---|---|
| Spinal Cord | Any point | 18 Gy |
| Esophagus | Any point | 27 Gy |
| Ipsilateral Brachial Plexus | Any point | 24 Gy |
| Heart | Any point | 30 Gy |
| Trachea and Ipsilateral Bronchus | Any point | 30 Gy |
The protocol requires that the treatment planning data (including CTs, structures, 3D dose matrix, and plans) be exported from institution’s treatment planning systems and submitted to the Image Guided Therapy QA Center. A Digital Data Integrity QA process was performed for each dataset, which included making sure all protocol required items were present and intact, that images, structures, and dose distributions were spatially registered, and that doses were properly scaled. Structures were assigned protocol-specified names and DVHs were recalculated with consistent spatial sampling and dose bin width parameters for both heterogeneity-corrected and uncorrected dose matrices. Dose-volume statistics were then computed from these DVHs.
Statistical methods
Since there is a relationship for each patient between the dosimetric data with and without heterogeneity corrections applied, changes in dosimetric data with heterogeneity corrections must be analyzed for each patient. The difference between dosimetric data with and without heterogeneity corrections was calculated by subtracting the non-corrected dose from the dose using heterogeneity corrections. A two-sided paired student’s t-test was then applied to that difference using the null hypothesis that the actual mean does not differ significantly from 0.
Results and discussions
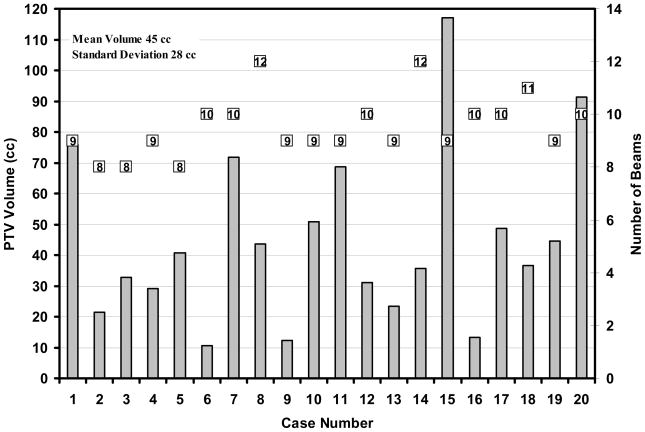
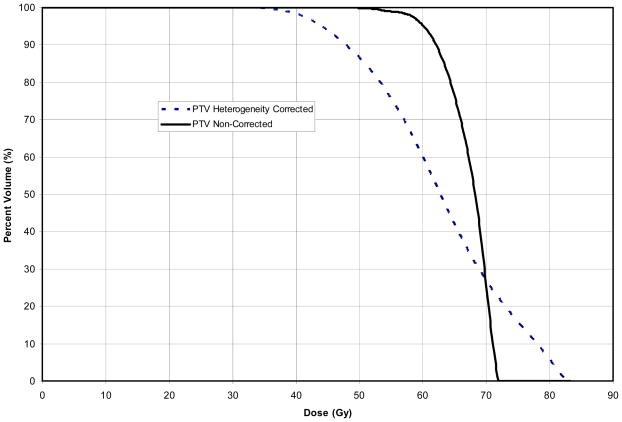
Fifty-nine patients were accrued to RTOG 023639. Of these, 20 patients from 4 institutions met the criteria set in the protocol for this analysis. The PTV volumes for the patients studied ranged from 10.7– 117 cc (cm3), with mean and standard deviation (STD) of 45 cc and 28 cc respectively (Figure 2). The number of beams used for the various treatment plans ranged from 8 to 12. The number of beams used for each case is labeled in the same figure. One can observe from the figure that there was no correlation between the PTV volume and number of beams necessary to adequately treat the volume. The photon beam energy used was 6 MV. Figure 3 shows the isodose distributions without (left) and with (right) heterogeneity correction on the isocentric axial slice for one of the cases submitted. It can be observed that with heterogeneity correction applied, the prescription isodose line contracts while the 50% isodose line extends, which is reflected in the dose volume histogram for the PTV (Figure 4). The percent volume receiving 60 Gy decreases from 95% to 60% in this case.
Figure 2.
PTV volume distribution and the number of beams (given above each bar) employed for the radiotherapy treatment plan.
Figure 3.
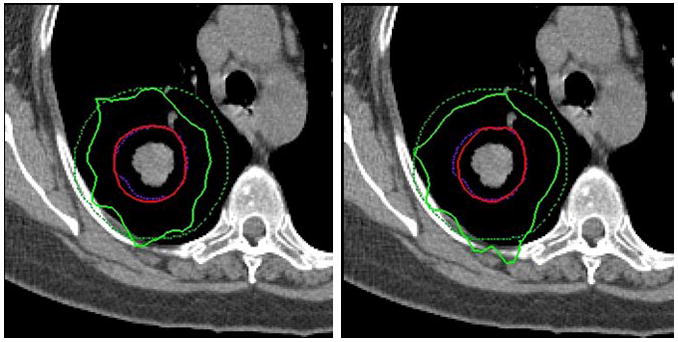
Isodose distributions for with unit density (left) and with density corrections (right). The dashed lines are PTV (inside) and 2 cm from PTV (outside). The solid lines are for 60 Gy isodose (inside) and 30 Gy isodose (outside).
Figure 4.
Dose volume histograms for PTV coverage with unit density and with density correction, for the case shown in Figure 3, one of the cases with larger than average differences between heterogeneity corrected and unit density plans chosen for illustration.
The statistical changes of the plans with vs. without heterogeneity corrections are described in the following categories: isocenter dose, 95% of PTV volume dose coverage, 99% of PTV volume dose coverage, conformality of PTV coverage, and dose to critical structures.
Isocenter dose
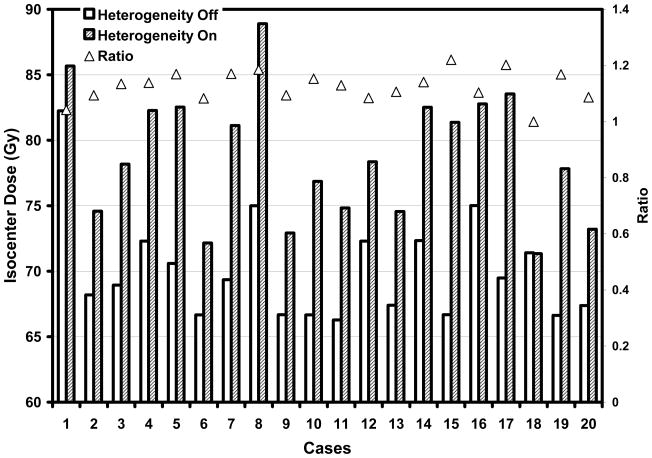
Figure 5 shows the effect on the isocenter dose as heterogeneity corrections are applied using the non-corrected monitor units. Of the submitted plans with unit density applied, the isocentric dose ranges from 66.3 Gy to 82.2 Gy (mean 70.1 Gy, standard error (SE) 0.9 Gy). With heterogeneity corrections applied, the isocenter dose ranges from 71.3 Gy to 88.9 Gy (mean 78.8 Gy, SE 1.1 Gy). Included in Figure 5 are also the ratios of isocentric dose with heterogeneity corrections over those without. One observes that all the ratios are greater than or equal to one, meaning an increase of isocentric doses for all these submitted cases. The relative increases range between −0.1% and 22% (mean 12.5%, and SE 1.2%).
Figure 5.
Doses at isocenter point for all the plans with and without heterogeneity correction.
95% of PTV volume dose coverage
The protocol requires that 95% of the target volume (PTV) be conformally covered by the prescription isodose surface of 60 Gy with no heterogeneity correction applied. As shown in Figure 6, the actual percentage of the PTV receiving the prescription dose of 60 Gy (%V60) ranges from 89.6% – 98.8% (mean 95.8%, SE 0.5%). Deviations from the required 95% have a minimum of −5.4% to a maximum of 3.8% (mean 0.8%, SE 0.5%). With heterogeneity corrections applied (Figure 6), V60 deviation from 95% has a wider range, from −37.4% to 2.7% (mean −10.1%, SE 2.7%). The mean difference ranges from −37.4% to 1.2% (mean −10.8%, SE 2.8%, p=0.001).
Figure 6.
Percent volume that receives prescription dose 60 Gy or higher, as compared against the protocol required value of 95%, without and with heterogeneity correction.
Considering the dose delivered to 95% of the PTV (D95) for the unit density calculations, values ranged from 57.0 Gy to 63.5 Gy (mean 60.6 Gy, SE 0.3 Gy). With heterogeneity correction applied, D95 extends to a wider range from 44.1 Gy to 64.2 Gy (mean 55.9, SE 1.1 Gy). The per-patient difference ranges from −16.0 Gy to 0.7 Gy (mean −4.7 Gy, SE 1.0 Gy, p=0.0002).
99% of PTV volume dose coverage
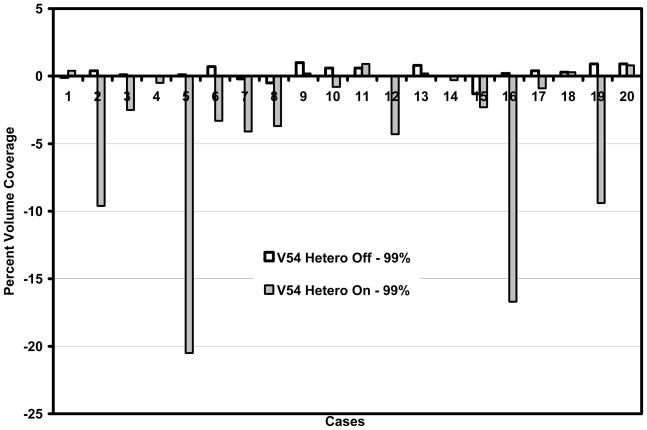
The protocol requires that the percent volume receiving 90% of the prescription dose (54 Gy) be no less than 99%. This requirement is met by almost all the plans (Figure 7), with a minimum of 97.7% and a maximum 100% (mean 99.2%, SE 0.1%). For the heterogeneity corrected plans, the deviation from 99% can be as much as −20.5%, with 4 cases deviating more than 5% (Figure 7). The per-patient differences range from −20.% to 0.5% (mean −4.1%, SE 1.3%, p=0.006). Similar results are seen in the dose to 99% of the volume (D99). This parameter extends from a minimum of 49.8 Gy to a maximum 59.6 Gy (mean 55.1 Gy, SE 0.5 Gy) when unit density calculations are performed, and to a range of 38.4 Gy to 73 Gy (51.4 Gy, SE 1.6 Gy) with heterogeneity correction. The per-patient difference ranges from −16.1 Gy to 14.2 Gy (mean −3.7 Gy, SE 1.4 Gy, p=0.02). The D90 for non-corrected planning has a range of 59.8 Gy to 67.7 Gy (mean 62.7 Gy, SE 0.3 Gy), and heterogeneity corrected plans range from 47.9 Gy to 68.6 Gy (mean 58.9 Gy, SE 1.1 Gy). The per-patient difference ranges from −14.2 Gy to 1.8 Gy (mean −3.8 Gy, SE 1.0 Gy, p=0.001).
Figure 7.
Percent volume that receives 90% of prescription dose: 54 Gy or higher, as compared against the protocol required value of 99%, without and with heterogeneity correction.
Conformality of PTV coverage
The RTOG 0236 protocol forces conformality of PTV coverage by limiting the ratio of the volume of the prescription isodose to the volume of the PTV. The requirement is that this ratio must be equal to or less than 1.4 when the dose calculation assumes unit density for all tissues (see Table 1). Under these conditions, the calculated ratio for the 20 cases has a minimum value of 0.9 and maximum value of 1.7 (mean 1.2, SE 0.045), with only 2 cases violating the limit of 1.4. With the heterogeneity correction applied, the isodose volume for the prescription dose decreased. In this case the minimum ratio was 0.6 and the maximum ratio was 1.5 (mean 1.0, SE 0.045). Only 1 case violates the upper limit of 1.4.
Maximum dose to any point 2 cm or greater away from the PTV in any direction (D2cm) varied between 20.7 Gy as a minimum value to 49.1 Gy as a maximum (mean 35.2 Gy, SE 1.7 Gy) for unit density calculation. This parameter ranged from 20.3 Gy to 56.0 Gy (mean 38.5, SE 2.2 Gy) with heterogeneity corrections. The per-patient difference ranged from −1.1 Gy to 8.2 Gy (mean 3.3 Gy, SE 0.6 Gy, p<0.0001). These numbers indicate, unlike the isodose line for the prescription dose, the shift of the lower value isodose lines is away from the isocenter as shown in Figure 3. Since future SBRT lung protocols will be designed to use heterogeneity corrected treatment planning, it is important to modify the dose constraints stated in the RTOG 0236 protocol to better reflect the actual delivered doses. This modification is included in Table 1 under the heading “Hetero.” Notice that the ratio of the 60 Gy isodose volume to the total PTV volume has not been changed. The maximum dose at 2 cm distance from the PTV has been modified. The numbers given in the table are the values that trigger a major deviation for the submitted case. The comparison between non-corrected and heterogeneity corrected maximum doses at 2 cm from the PTV is shown in the table. It can be seen that theD2cm values as stated in the 0236 protocol for the unit density treatment plans are consistently lower than the D2cm values for the heterogeneity corrected plans.
Another measure of the dose distribution comformality used in the RTOG 0236 protocol is the volume of the isodose surface for the dose that is 50% of the prescription dose value. For the 50% isodose spillage, the protocol requires that the ratio of the volume within an isodose surface for 50% of the prescription dose (30 Gy for homogeneous calculation and 56 Gy for heterogeneity corrected calculations) to the volume of the PTV (R50%) must be no greater than the R50% value specified in Table 1. The R50% values in this table were determined based on unit density dose calculation and are dependent upon PTV volume. It is interesting to compare the R50% values for the plans based on unit density calculations to the plans with heterogeneity correction applied. The R50% value for the unit density plans have a minimum value of 2.9, and a maximum of 6.3 (mean 3.8, SE 0.2) as compared to a minimum of 3.2 and a maximum of 6.5 (mean 4.3, SE 0.2) for the plans with heterogeneity corrections. The ratio between the R50%value over its corresponding criterion increases from 1.0 ± 0.2 (minimum 0.7, maximum 1.5) to 1.1 ± 0.2 (minimum 0.8, maximum 1.6). The percent pass rate (ratio <=1.0) decreases from 70% to 35%.
Critical structures
For the critical structures, the percent lung volume receiving 20 Gy or more (V20) is limited to be not more than 10% per the protocol, with no deviation defined as < 10% and a minor deviation defined at 10–15%(Table 1). Due to the relatively small size and location of the target volumes from the submitted cases, this criterion is met by almost all cases with a large margin (mean 5.5%, SE 0.6%, range = 2.5% – 12.7%). With changes from the heterogeneity correction, percent lung volume receiving 20 Gy is still well under the required upper limit of 10% (mean 5.9%, SE 0.6%, range = 2.5% – 14.1%). One case that doesn’t meet the criterion before correction (12.7%) still deviates from the limit after correction (14.1%). The per-patient difference with heterogeneity corrections ranges from −0.1% – 1.4% (mean 0.3%, SE 0.1%, p = 0.0003).
The absolute maximum dose limits for other critical structures are listed in Table 2. Without heterogeneity corrections, the dose to the spinal cord ranges from 0.4 Gy to 18.5 Gy (mean 9.9 Gy, SE 1.3 Gy). With heterogeneity correction, the range is 0.3 Gy to 22.0 Gy (mean 10.9 Gy, SE 1.4 Gy). The per-patient difference ranges from −0.3 Gy to 3.7 Gy (mean 0.9 Gy, SE 0.3 Gy, p = 0.006). One case with maximum dose to the spinal cord greater than the 18 Gy limit (18.5 Gy) before correction increases its value to 22 Gy after correction. Due to the fact that the submitted cases all have target volumes distal from the mediastinum, the doses to esophagus, heart and the other critical structures listed in Table 2 are negligible. However, one out of twenty cases has esophagus receiving a maximum dose of 6.1 Gy without heterogeneity correction, which increases to 12.0 Gy with the correction. Two out of the twenty cases having esophagus maximum doses of 0.0 Gy without correction see an increase of maximum esophagus doses to 0.3 Gy and 11.9 Gy respectively after the correction, showing potentially substantial dose increase to nearby critical structures with heterogeneity correction.
Suggested prescribed dose and constraint adjustments for protocols with heterogeneity correction
Based on the results presented above for 20 cases submitted for the RTOG 0236 protocol, there is a need to adjust prescribed dose and constraints that control conformality for future protocols that use heterogeneity corrections. It is recommended here that future protocols that are patterned after the RTOG 0236 protocol in terms of total prescribed dose and dose fractionation use a prescribed dose of 56 Gy instead of the 60 Gy used for homogeneous tissue density calculations. Suggested values for adjusted constraints are listed in Table 1 under the column “hetero”. These values are obtained so that approximately 80% of the submitted cases meet the criteria with heterogeneity correction, since re-optimization of beam weights are not performed for these heterogeneity corrected plans.
Because of the characteristics of the target volumes, which are distal from the mediastinum for the submitted cases, the percentage of cases meeting the criteria to cord, esophagus, heart and the other critical structures listed in Table 2 is not affected by turning on the heterogeneity correction. No changes are recommended for the values in Table 2 with heterogeneity correction for similar cases.
Conclusions
Significant differences are found between the calculated doses submitted to meet the requirements of RTOG 0236 and the actual heterogeneity corrected doses. These results are similar to the single-institutional findings of reference 20. The volume of PTV receiving prescription dose decreases over 10% on average. Dose to 95% of the PTV volume decreased on average by 4.7 Gy. Dose spilling to normal tissues noticeably increased in only a limited number of patients with heterogeneity corrections applied. However, in a few of these cases, the increases were marked and exceeded the protocol specified constraints. The design of the RTOG 0236 protocol was patterned on pilot studies that did not use tissue heterogeneity corrections for the treatment planning. The information provided in the current study will be used for designing future RTOG protocols to better match the true dose delivered for RTOG 0236. Adjusting the dose for future studies is extremely important given the hypofractionated dose schedule and reduced margins used for RTOG 0236.
Acknowledgments
NCI grants U24 CA 81647, U10 CA21661 and U10 CA32115 are acknowledged for support of the study. Content was partially presented orally at ASTRO meeting of 2007.
Footnotes
Publisher's Disclaimer: This is a PDF file of an unedited manuscript that has been accepted for publication. As a service to our customers we are providing this early version of the manuscript. The manuscript will undergo copyediting, typesetting, and review of the resulting proof before it is published in its final citable form. Please note that during the production process errors may be discovered which could affect the content, and all legal disclaimers that apply to the journal pertain.
References
- 1.Jemal A, Siegel R, Ward E, Murray T, Xu J, Thun MJ. Cancer statistics, 2007. CA Cancer J Clin. 2007;57:43–66. doi: 10.3322/canjclin.57.1.43. [DOI] [PubMed] [Google Scholar]
- 2.Jemal A, Tiwari RC, Murray T, et al. Cancer statistics, 2004. CA Cancer J Clin. 2004;54:8–29. doi: 10.3322/canjclin.54.1.8. [DOI] [PubMed] [Google Scholar]
- 3.Jemal A, Siegel R, Ward E, et al. Cancer statistics, 2006. CA Cancer J Clin. 2006;56:106–130. doi: 10.3322/canjclin.56.2.106. [DOI] [PubMed] [Google Scholar]
- 4.Jemal A, Murray T, Ward E, et al. Cancer statistics, 2005. CA Cancer J Clin. 2005;55:10–30. doi: 10.3322/canjclin.55.1.10. [DOI] [PubMed] [Google Scholar]
- 5.Shields TW. Surgical therapy for carcinoma of the lung. Clin Chest Med. 1993;14:121–147. [PubMed] [Google Scholar]
- 6.Wilson DO, Weissfeld JL, Fuhrman CR, et al. The pittsburgh lung screening study (PLuSS): Outcomes within 3 years of a first computed tomography scan. Am J Respir Crit Care Med. 2008;178:956–961. doi: 10.1164/rccm.200802-336OC. [DOI] [PMC free article] [PubMed] [Google Scholar]
- 7.Adebonojo SA, Bowser AN, Moritz DM, Corcoran PC. Impact of revised stage classification of lung cancer on survival: A military experience. Chest. 1999;115:1507–1513. doi: 10.1378/chest.115.6.1507. [DOI] [PubMed] [Google Scholar]
- 8.Mountain CF. The international system for staging lung cancer. Semin Surg Oncol. 2000;18:106–115. doi: 10.1002/(sici)1098-2388(200003)18:2<106::aid-ssu4>3.0.co;2-p. [DOI] [PubMed] [Google Scholar]
- 9.Naruke T, Goya T, Tsuchiya R, Suemasu K. Prognosis and survival in resected lung carcinoma based on the new international staging system. J Thorac Cardiovasc Surg. 1988;96:440–447. [PubMed] [Google Scholar]
- 10.Coy P, Kennelly GM. The role of curative radiotherapy in the treatment of lung cancer. Cancer. 1980;45:698–702. doi: 10.1002/1097-0142(19800215)45:4<698::aid-cncr2820450414>3.0.co;2-8. [DOI] [PubMed] [Google Scholar]
- 11.Haffty BG, Goldberg NB, Gerstley J, Fischer DB, Peschel RE. Results of radical radiation therapy in clinical stage I, technically operable non-small cell lung cancer. Int J Radiat Oncol Biol Phys. 1988;15:69–73. doi: 10.1016/0360-3016(88)90348-3. [DOI] [PubMed] [Google Scholar]
- 12.Armstrong JG, Minsky BD. Radiation therapy for medically inoperable stage I and II non-small cell lung cancer. Cancer Treat Rev. 1989;16:247–255. doi: 10.1016/0305-7372(89)90044-3. [DOI] [PubMed] [Google Scholar]
- 13.Dosoretz DE, Katin MJ, Blitzer PH, et al. Radiation therapy in the management of medically inoperable carcinoma of the lung: Results and implications for future treatment strategies. Int J Radiat Oncol Biol Phys. 1992;24:3–9. doi: 10.1016/0360-3016(92)91013-d. [DOI] [PubMed] [Google Scholar]
- 14.Dosoretz DE, Galmarini D, Rubenstein JH, et al. Local control in medically inoperable lung cancer: An analysis of its importance in outcome and factors determining the probability of tumor eradication. Int J Radiat Oncol Biol Phys. 1993;27:507–516. doi: 10.1016/0360-3016(93)90373-4. [DOI] [PubMed] [Google Scholar]
- 15.Kaskowitz L, Graham MV, Emami B, Halverson KJ, Rush C. Radiation therapy alone for stage I non-small cell lung cancer. Int J Radiat Oncol Biol Phys. 1993;27:517–523. doi: 10.1016/0360-3016(93)90374-5. [DOI] [PubMed] [Google Scholar]
- 16.Dosoretz DE, Katin MJ, Blitzer PH, et al. Medically inoperable lung carcinoma: The role of radiation therapy. Semin Radiat Oncol. 1996;6:98–104. doi: 10.1053/SRAO00600098. [DOI] [PubMed] [Google Scholar]
- 17.Curran WJ, Jr, Moldofsky PJ, Solin LJ. Analysis of the influence of elective nodal irradiation on postirradiation pulmonary function. Cancer. 1990;65:2488–2493. doi: 10.1002/1097-0142(19900601)65:11<2488::aid-cncr2820651116>3.0.co;2-l. [DOI] [PubMed] [Google Scholar]
- 18.Papiez L, Timmerman R. Hypofractionation in radiation therapy and its impact. Med Phys. 2008;35:112–118. doi: 10.1118/1.2816228. Available from: http://link.aip.org/link/?MPH/35/112/1. [DOI] [PubMed]
- 19.Bradley J, Graham MV, Winter K, et al. Toxicity and outcome results of RTOG 9311: A phase I–II dose-escalation study using three-dimensional conformal radiotherapy in patients with inoperable non–small-cell lung carcinoma. International Journal of Radiation Oncology*Biology*Physics. 2005;61:318–328. doi: 10.1016/j.ijrobp.2004.06.260. [DOI] [PubMed] [Google Scholar]
- 20.Ding GX, Duggan DM, Lu B, et al. Impact of inhomogeneity corrections on dose coverage in the treatment of lung cancer using stereotactic body radiation therapy. Med Phys. 2007;34:2985–2994. doi: 10.1118/1.2745923. [DOI] [PubMed] [Google Scholar]
- 21.Matsuo Y, Takayama K, Nagata Y, et al. Interinstitutional variations in planning for stereotactic body radiation therapy for lung cancer. Int J Radiat Oncol Biol Phys. 2007;68:416–425. doi: 10.1016/j.ijrobp.2006.12.012. [DOI] [PubMed] [Google Scholar]
- 22.Panettieri V, Wennberg B, Gagliardi G, Duch MA, Ginjaume M, Lax I. SBRT of lung tumours: Monte carlo simulation with PENELOPE of dose distributions including respiratory motion and comparison with different treatment planning systems. Phys Med Biol. 2007;52:4265–4281. doi: 10.1088/0031-9155/52/14/016. [DOI] [PubMed] [Google Scholar]
- 23.Lax I, Panettieri V, Wennberg B, et al. Dose distributions in SBRT of lung tumors: Comparison between two different treatment planning algorithms and monte-carlo simulation including breathing motions. Acta Oncol. 2006;45:978–988. doi: 10.1080/02841860600900050. [DOI] [PubMed] [Google Scholar]
- 24.Papiez L, Moskvin V, Timmerman R. In: The physics and dosimetry of stereotactic body radiation therapy in stereotactic body radiation therapy. Kavanagh BT, editor. Philadelphia: Lippincott Williams; 2005. [Google Scholar]
- 25.Timmerman R, Galvin J, Michalski J, et al. Accreditation and quality assurance for radiation therapy oncology group: Multicenter clinical trials using stereotactic body radiation therapy in lung cancer. Acta Oncol. 2006;45:779–786. doi: 10.1080/02841860600902213. [DOI] [PubMed] [Google Scholar]
- 26.Carrasco P, Jornet N, Duch MA, et al. Comparison of dose calculation algorithms in phantoms with lung equivalent heterogeneities under conditions of lateral electronic disequilibrium. Med Phys. 2004;31:2899–2911. doi: 10.1118/1.1788932. [DOI] [PubMed] [Google Scholar]
- 27.Vanderstraeten B, Reynaert N, Paelinck L, et al. Accuracy of patient dose calculation for lung IMRT: A comparison of monte carlo, convolution/superposition, and pencil beam computations. Med Phys. 2006;33:3149–3158. doi: 10.1118/1.2241992. [DOI] [PubMed] [Google Scholar]
- 28.Chang D, Liu C, Dempsey JF, et al. Predicting changes in dose distribution to tumor and normal tissue when correcting for heterogeneity in radiotherapy for lung cancer. Am J Clin Oncol. 2007;30:57–62. doi: 10.1097/01.coc.0000251222.36417.3b. [DOI] [PubMed] [Google Scholar]
- 29.Davidson SE, Ibbott GS, Prado KL, Dong L, Liao Z, Followill DS. Accuracy of two heterogeneity dose calculation algorithms for IMRT in treatment plans designed using an anthropomorphic thorax phantom. Med Phys. 2007;34:1850–1857. doi: 10.1118/1.2727789. [DOI] [PubMed] [Google Scholar]
- 30.Knoos T, Wieslander E, Cozzi L, et al. Comparison of dose calculation algorithms for treatment planning in external photon beam therapy for clinical situations. Phys Med Biol. 2006;51:5785–5807. doi: 10.1088/0031-9155/51/22/005. [DOI] [PubMed] [Google Scholar]
- 31.Papanikolaou N, Mackie TR, Meger-Wells C, Gehring M, Reckwerdt P. Investigation of the convolution method for polyenergetic spectra. Med Phys. 1993;20:1327–1336. doi: 10.1118/1.597154. [DOI] [PubMed] [Google Scholar]
- 32.McNutt TR, Mackie TR, Reckwerdt P, Paliwal BR. Modeling dose distributions from portal dose images using the convolution/superposition method. Med Phys. 1996;23:1381–1392. doi: 10.1118/1.597872. [DOI] [PubMed] [Google Scholar]
- 33.Starkschall G, Steadham RE, Jr, Popple RA, Ahmad S, Rosen II. Beam-commissioning methodology for a three-dimensional convolution/superposition photon dose algorithm. J Appl Clin Med Phys. 2000;1:8–27. doi: 10.1120/jacmp.v1i1.2651. [DOI] [PMC free article] [PubMed] [Google Scholar]
- 34.Ahnesjo A. Collapsed cone convolution of radiant energy for photon dose calculation in heterogeneous media. Med Phys. 1989;16:577–592. doi: 10.1118/1.596360. [DOI] [PubMed] [Google Scholar]
- 35.Miften M, Wiesmeyer M, Kapur A, Ma CM. Comparison of RTP dose distributions in heterogeneous phantoms with the BEAM monte carlo simulation system. J Appl Clin Med Phys. 2001;2:21–31. doi: 10.1120/jacmp.v2i1.2623. [DOI] [PMC free article] [PubMed] [Google Scholar]
- 36.Miften M, Wiesmeyer M, Monthofer S, Krippner K. Implementation of FFT convolution and multigrid superposition models in the FOCUS RTP system. Phys Med Biol. 2000;45:817–833. doi: 10.1088/0031-9155/45/4/301. [DOI] [PubMed] [Google Scholar]
- 37.Mackie TR, Bielajew AF, Rogers DW, Battista JJ. Generation of photon energy deposition kernels using the EGS monte carlo code. Phys Med Biol. 1988;33:1–20. doi: 10.1088/0031-9155/33/1/001. [DOI] [PubMed] [Google Scholar]
- 38.Timmerman RD, Michalski J, Fowler J, et al. A phase II trial of stereotactic body radiation therapy (SBRT) in the treatment of patients with medically inoperable stage I/II non-small cell lung cancer. Philadelphia: RTOG; 2006. p. 0236. Available from: http://www.rtog.org/members/protocols/0236/0236.pdf. [Google Scholar]
- 39.ITC/ATC. Available at: http://atc.wustl.edu/resources/index.html.


