

1. Introduction
Generalized social phobia (GSP) is characterized by excessive fear and avoidance of public scrutiny, particularly in the context of social evaluative threat (Stein and Stein 2008). These fears often manifest when confronted by facial expressions that convey potent emotional information (Ekman 2003). A growing number of studies have consistently demonstrated that patients with GSP exhibit exaggerated amygdala reactivity to ‘harsh’ (angry, fearful, and/or disgusted) faces (for review see Etkin and Wager, 2007; Evans et al., 2008).
The amygdala is particularly sensitive to threatening social signals (Zald 2003), and is critically involved in the perception of potential of danger (Amaral 2003). More intense facial displays of threat appear to engage greater amygdala activity (Winston et al., 2003). Given that ‘harsh’ faces convey the most salient information to patients with GSP, they may have a lower threshold of amygdala activation to perceived threat. In support of this notion, behavioral studies have shown that GSP subjects more accurately identify the presence of threat even at moderate intensity (Joormann and Gotlib, 2006). However, no study has examined amygdala reactivity to faces that convey threat at varying levels of intensity.
In this fMRI study, we measured amygdala reactivity to threatening faces of low, moderate, and high intensity. We hypothesized that GSP, relative to controls, would exhibit greater amygdala reactivity to ‘harsh’ faces of both high and moderate intensity.
2. Methods
2.1. Participants
Twelve individuals with GSP (age: 28.2 ± 8.6 years), as confirmed by the Structured Clinical Interview for DSM-IV (First et al., 1995) with additional probes from the Liebowitz Social Anxiety Scale (Liebowitz, 1987), and twelve healthy controls (age: 33.6 ± 9.6 years) participated. None of the GSAD patients had a current depressive episode or recent substance abuse/dependence (within 6 months of study), or a lifetime history of major psychiatric illness (e.g., bipolar, psychotic disorder). Although two of the patients had comorbid generalized anxiety disorder, social phobia was their primary diagnosis. All participants were right-handed and free of current/past major medical or neurologic illness, as confirmed by a physician. All subjects were free of psychoactive medications at the time of the study and none tested positive for alcohol or illegal substances. GSP and HC groups were similar in age, education level, gender and race/ethnicity (t-tests / χ2 tests, all Ps >0.05). All subjects provided written informed consent, as approved by the local Institutional Review Board.
2.2. Behavioral task and functional MRI
In a jittered, event-related fMRI design, subjects viewed a stimulus set consisting of black/white photographs of standardized faces (Ekman and Friesen, 1976) morphed (using techniques described by Young et al. (1997)) at low (20-30%), moderate (50-60%), and high (90-100%) intensity. There were 10 face stimuli for each threat expression at each intensity level (i.e., 10 angry high intensity, 10 angry moderate intensity, 10 angry low intensity; 10 disgust high intensity, 10 disgust moderate intensity, 10 disgust low intensity; 10 fearful high intensity, 10 fearful moderate intensity, 10 fearful low intensity); additional face photographs displaying other emotions (sad, happy, surprise) were also shown, but are not reported here based on our a priori hypothesis. Therefore, 90 novel threat faces were presented at pseudorandom order, each for 4s followed by a jittered inter-stimulus interval (0-16s). While viewing each face, subjects identified its valence (negative, neutral, or positive) via button-press. Imaging occurred on a 3T GE Signa System (General Electric; Milwaukee, Wisconsin, USA) using a standard radiofrequency coil. Whole-brain functional scans were acquired using a T2*-weighed reverse spiral sequence (TE=25ms, TR=2000ms, 64×64 matrix, flip angle=77°, FOV=24cm, 30 contiguous 5mm axial slices per volume, aligned with the AC-PC line). We used a high resolution T1-weighted scan (3-dimensional magnetization prepared rapid gradient echo, or 3D-MPRAGE; TR 25 ms; min TE; FOV 24 cm; slice thickness 1.5 mm) for anatomic localization.
2.3. Functional MRI and data analysis
Conventional preprocessing steps were used in SPM5 software package (Wellcome Department of Cognitive Neurology, London, UK). Images were normalized with an MNI template and smoothed with an 8 mm radius Gaussian kernel. In brief, for each participant, condition effects (low, moderate, and high threat intensity) were estimated at each voxel resulting in statistical parametric maps (SPMs) from linear contrasts of interest. To test our a priori hypothesis, we extracted from each subject parameter estimates of activation (β weights, arbitrary units [a.u.]) averaged across all voxels within an anatomically-based amygdala region of interest (ROI) (Walter et al., 2003) using MarsBaR (http://marsbar.sourceforge.net); the amygdala search volume comprised 64 voxels on the left and 75 voxels on the right (each voxel=27mm3). Between group comparisons were conducted at each intensity level using two-tailed independent samples t-tests at alpha level 0.05. To localize significant group differences across the whole brain, individual SPMs were also entered into a 2nd-level analysis for within group and between group comparisons (significance set at voxel Puncorrected <0.005, cluster size >20 contiguous voxels). We also performed small volume corrections on anatomically-based ROI and whole brain results. To evaluate amygdala activation with symptom severity, we conducted two-tailed Pearson correlations at alpha level 0.05.
3. Results
3.1. Behavioral Results
Both GSP and HC subjects were similarly unable to accurately detect the valence of threat expressions at low intensity (%correct: GSP: 10.9±10.6% vs. HC: 18.2±7.9%), labeling these faces as predominately ‘neutral’ (%identified as ‘neutral’: GSP: 78.8±26.8% vs. HC: 79.0±8.4%). Both groups improved accuracy for faces at moderate (GSP: 66.2±22.7% vs. HC: 68.3±11.7%) and high (GSP: 82.6 ±27.4% vs. HC: 89.7±8.4%) intensity. Neither accuracy nor reaction times differed between GSP and HC subjects (t-tests, all Ps>0.05).
3.2. fMRI Results
In the left amygdala, compared to the HC group, GSP exhibited greater reactivity for threatening faces at moderate (P<0.03) and high intensity (P<0.003) but not low intensity (P=0.10) based on extracted parameter estimates (Fig. 1A). These ROI-based findings were localized to large, focal clusters in the left amygdala for moderate ([-12, -6, -21], Z-score= 3.34; volume=702mm3) and high ([-21, -6, -30], Z-score=4.04; volume=1323mm3) intensity threat faces (Fig. 1B). Time courses for these significant functionally defined extracted signals are illustrated in Fig. 2. In the right amygdala, GSP had greater reactivity for high intensity (P<0.04) but not for moderate (P=0.18) or low (P=0.34) intensity threatening faces based on extracted parameter estimates (Fig. 1A). This ROI-based finding was not localized to a large focal cluster in the right amygdala. For completeness, whole brain results beyond the amygdala are summarized in Table 1.
Fig. 1.
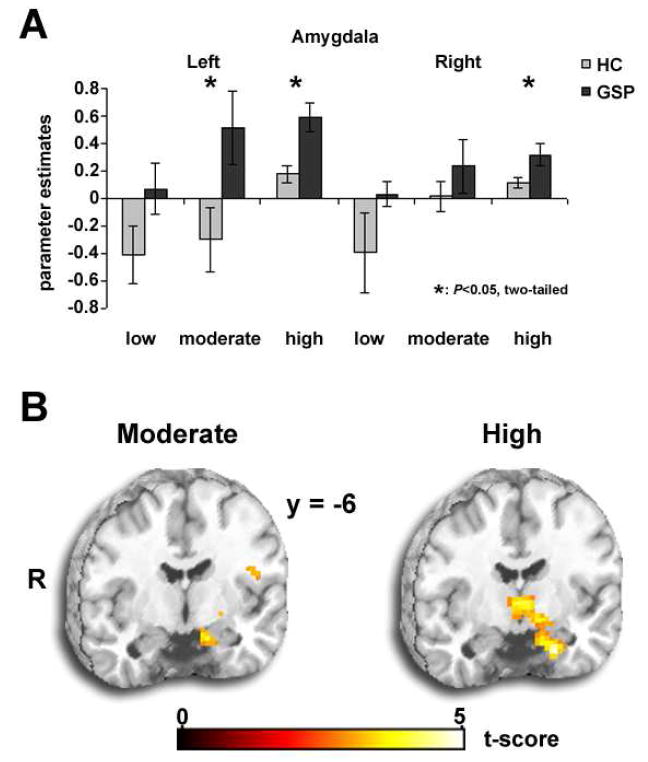
(a) Extracted estimate of BOLD signal change for threatening faces.
(b) Whole brain t-map (Puncorrected< 0.005, 20 voxel minimum) showing amygdala hyperactivity to moderate and high intensity threat.
Fig. 2.
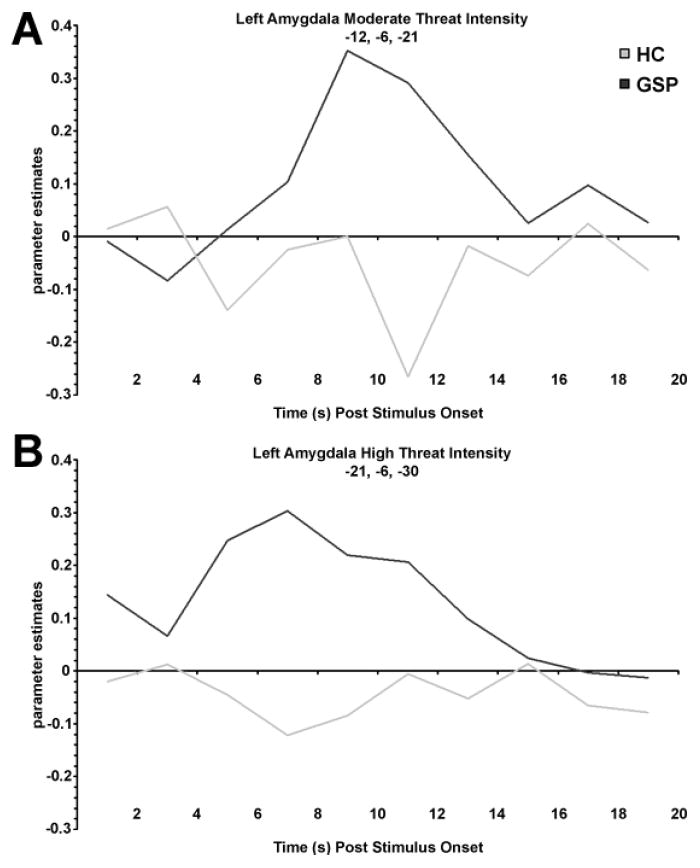
Time courses for functionally defined extracted signals to moderate (a) and high (b) intensity threat.
Table 1.
Group differences for whole-brain results outside of amygdala for each threat intensity level
| Condition score | Region | MNI Coordinates | Cluster | Z | ||
|---|---|---|---|---|---|---|
| High Threat Intensity | ||||||
| GSP > HC | Parahippocampal gyrus | -15 | 9 | -9 | 543 | 4.73 |
| Inferior frontal gyrus | 24 | 6 | -15 | 72 | 3.78 | |
| Orbital frontal cortex | -3 | 18 | -21 | 26 | 3.33 | |
| HC > GSP | None | |||||
| Moderate Threat Intensity | ||||||
| GSP > HC | Insula | -42 | 21 | 9 | 155 | 4.44 |
| Cerebellum | 33 | 78 | -42 | 64 | 3.69 | |
| 48 | -60 | -45 | 31 | 3.21 | ||
| Midbrain | 6 | -24 | -12 | 50 | 3.42 | |
| Putamen | -18 | 9 | -6 | 27 | 3.24 | |
| HC > GSP | None | |||||
| Low Threat Intensity | ||||||
| GSP > HC | Cuneus | 15 | -78 | 21 | 41 | 3.45 |
| Thalamus | -18 | -18 | 6 | 35 | 4.22 | |
| Parahippocampal gyrus | 12 | -9 | -21 | 26 | 3.55 | |
| Insula | -36 | -15 | 6 | 23 | 2.88 | |
| HC > GSP | Middle frontal gyrus | 39 | 42 | 9 | 32 | 2.93 |
Results are at Puncorrected< 0.005, 20 voxel minimum
GSP are generalized socially phobics
HC are healthy controls
MNI refers to Montreal Neurological Institute
For small volume correction with anatomically-based ROI, we obtain a trend for moderate threat intensity in left (-18, -3, -21; FWE P=0.12, FDR P=0.08) and right amygdala (21, 0, -12; FWE P=0.09, FDR P=0.11), which is bilaterally significant for high threat intensity (left: -21, 0, -12; FWE P<0.01, FDR P<0.02) and (right: 24, 0, -15; FWE P<0.03, FDR P<0.05). With a 10 mm sphere using whole-brain results for moderate threat (-12, -6, -21) and high threat intensity (-21, -6, -30), results are significant for moderate (FWE P<0.032; FDR P<0.027) and high threat intensity (FWE P<0.003; FDR P<0.003).
Correlational analysis showed no relationship between amygdala activation and symptom severity (all Ps>0.05).
4. Discussion
As hypothesized GSP patients, relative to matched controls, exhibited greater amygdala reactivity to ‘harsh’ (i.e., angry, fearful, disgusted) faces of both high and moderate intensity. The finding that GSP had exaggerated amygdala reactivity to threat faces at full intensity is consistent with growing evidence that GSP amygdala hyperactivity reflects enhanced sensitivity to threatening social signals.
We also show exaggerated amygdala reactivity extends to harsh faces even at a lower, moderate (50-60% of full) intensity. Interestingly, patients with GSP are more accurate than controls at identifying moderately intense threatening expressions (Joormann and Gotlib, 2006). Therefore, the finding that the amygdala, a critical region in detecting potential danger (Amaral 2003), activates at a relatively lower threshold in GSP patients than healthy controls provides information about a potential neural mechanism via which patients with social anxiety have enhanced perceptual acuity for social threat.
Behavioral results did not reflect group differences; however, the task was relatively simple and speed was not emphasized thereby reducing the ability to detect subtle group differences. As expected, we did not observe group effects for amygdala reactivity to threat of low (20-30% of full) intensity, which subjects predominately labeled as ‘neutral’; however, the precise intensity level that evokes exaggerated amgydala reactivity in GSP is as yet unknown. Regarding amygdala activation and symptom severity, results in the literature have been mixed. In this study, we found no correlation. Additional limitations include the small sample size. Also, given our strong directional hypothesis, we employed t-tests between groups at each threat intensity level instead of a more conservative mixed model Analysis of Variance. Therefore, subsequent studies with larger sample sizes are needed to fully test for the presence of interactions between diagnoses and threat intensity level. Taken together, caution in interpretation is warranted. Despite limitations, this study shows that more subtle displays of social threat evoke a threat-related neural response in GSP.
Acknowledgments
This study was supported in part by Brain Research Foundation (KLP), National Institutes of Health Grant MH076198 (KLP), and Postdoctoral Translational Scholars Program Grant UL1RR024986 (HK).
Footnotes
Publisher's Disclaimer: This is a PDF file of an unedited manuscript that has been accepted for publication. As a service to our customers we are providing this early version of the manuscript. The manuscript will undergo copyediting, typesetting, and review of the resulting proof before it is published in its final citable form. Please note that during the production process errors may be discovered which could affect the content, and all legal disclaimers that apply to the journal pertain.
References
- Amaral DG. The amygdala, social behavior, and danger detection. Annals of the New York Academy of Sciences. 2003;1000:337–347. doi: 10.1196/annals.1280.015. [DOI] [PubMed] [Google Scholar]
- Ekman P. Emotions revealed: recognizing faces and feelings to improve communication and emotional life. New York: Henry Holt and Company, LLC; 2003. [Google Scholar]
- Ekman P, Friesen WV. Pictures of Facial Affect. Consulting Psychologists Press; Palo Alto: 1976. [Google Scholar]
- Etkin A, Wager TD. Functional neuroimaging of anxiety: a meta-analysis of emotional processing in PTSD, social anxiety disorder, and specific phobia. American Journal of Psychiatry. 2007;164:1476–1488. doi: 10.1176/appi.ajp.2007.07030504. [DOI] [PMC free article] [PubMed] [Google Scholar]
- Evans KC, Wright CI, Wedig MM, Gold AL, Pollack MH, Rauch SL. A functional MRI study of amygdala responses to angry schematic faces in social anxiety disorder. Depression and Anxiety. 2008;25:496–505. doi: 10.1002/da.20347. [DOI] [PubMed] [Google Scholar]
- First MB, Spitzer RL, Williams JBW, Gibbon M. Structured Clinical Interview for DSM-IV—patient edition (SCID-P) American Psychiatric Press; Washington, DC: 1995. [Google Scholar]
- Joormann J, Gotlib IH. Is this happiness I see? Biases in the identification of emotional facial expressions in depression and social phobia. Journal of Abnormal Psychology. 2006;115:705–714. doi: 10.1037/0021-843X.115.4.705. [DOI] [PubMed] [Google Scholar]
- Liebowitz MR. Social Phobia. Modern Problems in Pharmacopsychiatry. 1987;22:141–173. doi: 10.1159/000414022. [DOI] [PubMed] [Google Scholar]
- Stein MB, Stein DJ. Social anxiety disorder. The Lancet. 2008;371:1115–1125. doi: 10.1016/S0140-6736(08)60488-2. [DOI] [PubMed] [Google Scholar]
- Walter B, Blecker C, Kirsch P, Sammer G, Schienle A, Stark R, Vaitl D. MARINA: An easy to use tool for the creation of MAsks for Region of INterest Analyses. Neuroimage. 2003;19:S47. [Google Scholar]
- Winston JS, O’Doherty J, Dolan RJ. Common and distinct neural responses during direct and incidental processing of multiple facial emotions. Neuroimage. 2003;20:84–97. doi: 10.1016/s1053-8119(03)00303-3. [DOI] [PubMed] [Google Scholar]
- Young AW, Rowland D, Calder AJ, Etcoff NL, Seth A, Perrett DI. Facial expression megamix: tests of dimensional and category accounts of emotion recognition. Cognition. 1997;63:271–313. doi: 10.1016/s0010-0277(97)00003-6. [DOI] [PubMed] [Google Scholar]
- Zald DH. The human amygdala and the emotional evaluation of sensory stimuli. Brain Research Reviews. 2003;41:88–123. doi: 10.1016/s0165-0173(02)00248-5. [DOI] [PubMed] [Google Scholar]