

Abstract
Neocortical fast-spiking (FS) basket cells form dense autaptic connections that provide inhibitory GABAergic feedback after each action potential. It has been suggested that these autaptic connections are used because synaptic communication is sensitive to neuromodulation, unlike the voltage-sensitive potassium channels in FS cells. Here we show that layer V FS interneurons form autaptic connections that are largely perisomatic, and without perturbing intracellular Cl− homeostasis, that perisomatic GABAergic currents have a reversal potential of −78 ± 4 mV. Using variance–mean analysis, we demonstrate that autaptic connections have a mean of 14 release sites (range 4–26) with a quantal amplitude of 101 ± 16 pA and a probability of release of 0.64 (Vcommand=−70 mV, [Ca2+]o= 2 mm, [Mg2+]o= 1 mm). We found that autaptic GABA release is sensitive to GABAB and muscarinic acetylcholine receptors, but not a range of other classical neuromodulators. Our results indicate that GABA transporters do not regulate FS interneuron autapses, yet autaptically released GABA does not act at GABAB or extrasynaptic GABAA receptors. This research confirms that the autaptic connections of FS cells are indeed susceptible to modulation, though only via specific GABAergic and cholinergic mechanisms.
Introduction
An autapse is a synapse formed between a neuron and a branch of its own axon (Van der Loos & Glaser, 1972). Many potential autaptic connections have been noted using light microscopy (reviewed in Tamas et al. 1997); however, the first autapse confirmed using electron microscopy was observed in the rat visual cortex, where a single synaptic contact was made by a stellate cell onto itself (Peters & Proskauer, 1980). Lübke et al. (1996) found morphological evidence of autapses on 66% of layer V pyramidal cells in juvenile rat somatosensory cortex. These autapses were restricted to 1–4 synaptic contacts, and were largely made on secondary and tertiary basal dendrites. Connections made between different layer V pyramidal cells also form on secondary and tertiary basal dendrites, and this led Lübke et al. (1996) to conclude that the formation of autaptic connections follows the same structural principles that cells adhere to when connecting to other cells of the same type.
The apparent rarity of cells that form autapses in vivo, and the low number of synaptic contacts made when a cell does synapse on itself, led some to doubt whether autapses could have any physiologically important role and hence were simply a wiring error (Lübke et al. 1996; Bekkers, 2003). Indeed, in cell culture, especially when physically confined, neurons can form dense autaptic connections (Bekkers & Stevens, 1991; Segal, 1991; Shi & Rayport, 1994). However, in 1997, Peter Somogyi's group published two papers showing morphological evidence that interneurons in the neocortex and hippocampus form numerous autaptic connections (Cobb et al. 1997; Tamas et al. 1997). Cat neocortical basket cells formed on average 12 autaptic junctions (range: 3–23) very close to the soma (12 ± 22 μm) and ‘dendrite targeting interneurons’ averaged 22 autapses (range: 9–32), while double bouquet, pyramidal and spiny stellate cells formed less than one autapse per cell on average (Tamas et al. 1997). Indeed, dendrite-targeting interneurons form the largest number of synapses made by a single axon onto any cortical cell type (Tamas et al. 1997). When whole-cell recordings are made in the neocortex, 85% of fast spiking (FS) basket cells have a detectable GABAA-mediated autaptic current. Importantly, blockade of GABAA receptors, and hence the action of the autapse, increased the firing rate and decreased the spike-timing accuracy of FS cells during a train of action potentials (Bacci et al. 2003a; Bacci & Huguenard, 2006).
The hypothesized functional consequence of inhibitory autaptic traffic has ranged from gating dendritic calcium spikes to enhancing spike-timing accuracy (Bekkers, 1998; Bacci & Huguenard, 2006). If the effect is simply to enforce a pause after spiking, one could imagine that this could be achieved more simply, and without the variation due to quantal fluctuations associated with synaptic transmission, by a large complement of ion channels that classically mediated the afterhyperpolarizing potential (AHP). It has been suggested that the plasticity that synaptic transmission affords means that the autaptic negative feedback can be modulated either by neuromodulatory regulation of GABA release, alteration of the postsynaptic GABAA receptor complement, GABA uptake, or any other dynamic molecular property that changes the function of GABAergic transmission (Bekkers, 2003). Indeed, the Kv3.2 channel that mediated the AHP in FS cells is largely insensitive to neuromodulation (Bekkers, 2003, though see Atzori et al. 2000). Nevertheless, it has not yet been demonstrated whether native autaptic function is regulated by neuromodulators.
In this study we profile the basic synaptic physiology of autaptic function in rat layer V FS cells, and demonstrate that two classical presynaptic inhibitory systems control autaptic GABA release and thus, that autaptic transmission does supply a modifiable AHP. We found that GABA transporters do not regulate autaptic connections.
Methods
Slice preparation and electrophysiology
All experiments and procedures were approved by the University of Otago Animal Ethics Committee and performed in accordance with their guidelines. Male Sprague–Dawley rat pups, 14–26 days old, were anaesthetized (pentobarbital, 120 mg kg−1), rapidly decapitated and the brains dissected out into ice-cold modified artificial cerebrospinal fluid (aCSF) of the following composition (mm): sucrose 248, KCl 3, MgCl2 2, CaCl2 1, NaH2PO4 1.25, NaHCO3 26, glucose 10, that had been saturated with 95% O2 and 5% CO2. Coronal slices, 200–250 μm thick, were cut using a vibrotome (VT1000S, Leica Microsystems, Germany) and placed in a holding chamber at 35°C in aCSF of the following composition (mm): NaCl 124, KCl 3, MgCl2 1, CaCl2 2, NaH2PO4 1.25, NaHCO3 26, glucose 10, sodium pyruvate 1, sodium ascorbate 3, bubbled with 95% O2 and 5% CO2 before being cooled to room temperature after half an hour. Slices were incubated under these conditions for a further 30 min before recording began. Slices were placed in a recording chamber on the stage of an IR-DIC microscope (E600FM DIC, Nikon, Japan) and perfused with aCSF maintained at room temperature (∼22°C) unless stated otherwise. In limited experiments (perforated patch and nipecotic acid experiments), aCSF was maintained at 35°C with an ATR temperature controller (Quest Scientific, Canada) at ∼2 ml min−1. Interneurons in layer V of the somatosensory cortex were easily identified under IR-DIC by their lack of a large apical dendrite. Interneurons were patched with 2–3 MΩ electrodes filled with the following solution (in mm): KCl 140, Hepes 10, phosphocreatine 10, EGTA 4, Na2ATP 4, NaCl 2, MgCl2 1, Na2GTP 0.3 (pH 7.33–7.37). Interneurons were subsequently identified as either regular spiking, low-threshold spiking (LTS) or FS. In response to a depolarizing step, regular spiking interneurons usually fired several action potentials in a burst followed by action potentials showing spike-frequency adaptation, and no rebound spiking after a hyperpolarizing step. LTS neurons showed spike-frequency adaptation and rebound spiking after a hyperpolarizing step. FS neurons showed very limited spike-frequency adaptation and no rebound spiking (Fig. 1A; Kawaguchi & Kubota, 1993, 1996; Cauli et al. 1997). The criteria for inclusion were a fast-spiking-type firing pattern and the presence of a resolvable autaptic IPSC; all other cells were discarded. During whole-cell voltage clamp, if the series resistance increased above 15 MΩ or changed by more than 10% over the course of a recording, the data from that cell were excluded from further analysis. Series resistance was on average 8.7 ± 0.2 MΩ (n= 157). Whole-cell parameters were corrected and series resistance was compensated 70–80% at 3 kHz. Some experiments were performed using the gramicidin perforated patch method (Kyrozis & Reichling, 1995). Gramicidin D (5 mg ml−1) was prepared in DMSO, and mixed into the pipette solution above to produce 10 μg ml−1. Pipettes were tip-dipped in gramicidin-free solution. After sealing onto neurons (>1 GΩ) series resistance dropped to below 100 MΩ in ∼20 min. For voltage clamp studies in perforated patch mode, recordings were only made if series resistance dropped below 40 MΩ (33 ± 2.5 MΩ, n= 6). Integrity of the perforated patch was monitored by checking that the response to pressure-applied muscimol (10 μm) was hyperpolarizing at resting membrane potentials. Data were filtered at 5 kHz and logged at 20 kHz (micro1401, CED, UK) to Signal4 (CED, UK) software. All measurements were made in the presence of 6-cyano-7-nitroquinoxaline-2,3-dione (CNQX, 10 μm) and d-aminophosphonovalerate (d-AP5, 20 μm). Data were not corrected for liquid junction potentials.
Figure 1. Basal synaptic physiology of autaptic connection in layer V fast-spiking basket cells.
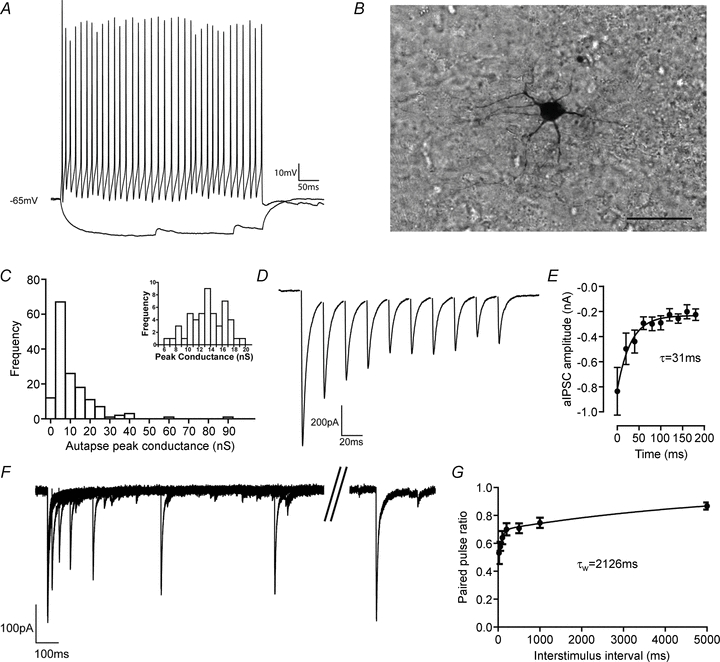
A, representative firing pattern of an autaptic FS cell in response to 200 pA or −100 pA current pulses. B, light micrograph of cell shown in A, filled with biocytin and processed with HRP-DAB. Scale bar 50 μm. C, histogram showing the mean peak conductance of aIPSCs recorded from 149 basket cells (cells with no autapses not included). Inset, aIPSCs recorded from a basket cell with an average sized autaptic connection show a wide spread of amplitudes but no failures (50 events). D, a train of 10 aIPSCs evoked at 50 Hz (sodium current removed digitally). E, at 50 Hz aIPSCs depression was well fitted with a single exponential with a time constant of 31 ms, and reached a maximum depression of 23% (n= 6). F, after a single aIPSC, autaptic currents depressed and recovered over the next 5 s. G, aIPSCs recover from synaptic depression in a manner best fitted by two exponentials with time constants of 56 ms and 4156 ms, giving a weighted decay constant of 2126 ms. After 5 s aIPSCs had recovered to 87% of baseline (n= 6).
Autaptic IPSCs (aIPSCs) were recorded at −70 mV and evoked by 1 ms steps to −30 mV. aIPSCs could be unambiguously identified in approximately 80% of FS cells by their fixed delay, quantal jitter, and paired pulse depression. Pharmacological studies were only initiated in cells where aIPSCs could be evoked without any failures, due presumably to a large number of autaptic release sites. This only resulted in ∼10% of autaptic cells being excluded. FS cells had a whole-cell capacitance of 28.5 ± 0.6 pF, with a maximum observed value of 50.3 pF. In a worst case scenario with a series resistance of 15 MΩ (compensated 70%) and this maximum capacitance, the time constant for measuring membrane current is 225 μs, fast enough to clamp the cell after the evoked sodium current, before the autaptic current peaks at a minimum of 2.3 ms after returning the cell to −70 mV. Likewise, at the peak of an average aIPSC (750 pA) recorded with an average series resistance, the voltage error is 2 mV. At a worse case scenario, with maximum peak aIPSC of 6.3 nA and 15 MΩ the peak voltage error is 28 mV. We readily admit this is far from ideal; however, cells with aIPSCs this large were only used for pharmacological studies where this poor voltage control would have little impact on our measurement of whether or not autaptic synapses are sensitive to a given neuromodulator.
The decay of aIPSCs could be fitted with mono- or biexponential functions depending on the range of time to which the event was fitted. Monoexponential functions were fitted with the function I=Ae−t/τ, where A is the initial amplitude, and τ is the decay constant. Bi-exponential functions were fitted with the function  . Bi-exponential functions could be reduced to a single exponential function giving a weighted decay constant (τw) where τw= (Afast×τfast+Aslow×τslow)/(Afast+Aslow). Q10 values were calculated with the equation
  , where Rate1 and Rate2 are the rates of a reaction calculated at temperatures T1 and T2, respectively. Rates of decay were calculated as the reciprocal of the decay constant.
Morphological analysis
Electrodes were filled with pipette solution containing 1–2 mg ml−1 biocytin, and cells were recorded for at least 20 min. Slices were fixed in 4% paraformaldehyde in PBS for 1–12 h, quenched in 1% H2O2 for 30 min and washed with PBS. Cells were permeabilized and non-specific binding was blocked by incubation in 0.3% Triton-X, 1% BSA in PBS for an hour. Slices were incubated overnight in ABC solution (Vector Laboratories) and then thoroughly washed over the course of 24 h. Slices were exposed to 0.7 mg ml−1 diaminobenzidine (DAB) and 0.17 mg ml−1 urea hydrogen peroxide, and the reaction was terminated with washing in PBS. Slices were mounted in DPX, coverslipped and sealed with nail polish.
Drugs
Serotonin, noradrenaline and dopamine (Sigma) were all weighed out at the start of the day (and kept at −20°C), but only made into ×1000 stock solution with water after an autaptic cell was patched. The stock solution was diluted directly before recording began, and both the stock and diluted solutions were discarded if not used within 15 min. Ligands were purchased from Ascent Scientific, UK (d-AP5, Na2CNQX), Tocris, UK (R-baclofen, gabazine, imetit, WIN-55212-2, zolpidem) or Sigma (5-HT, t-ACPD, adenosine, muscarine, l-noradrenaline tartarate, [d-Ala2,N-MePhe4,Gly-ol]-enkephalin (DAMGO), R-nipecotic acid, α-tetrahydrodeoxycorticosterone (THDOC)).
Variance–mean analysis of autaptic currents
Others have discussed the theory of estimating quantal parameters with variance–mean analysis (Clements, 2003; Ikeda et al. 2008). However, briefly, for an average postsynaptic current I
where N is the number of release sites, Q is the amplitude of a single quantal event, and Pr is probability of release of a quantum from a release site. Furthermore, for the variance of the amplitude σ2,
substituting the first equation into the second
In order to account for the fact that quantal events are not of the exact same size at a single release site (Bekkers & Stevens, 1995; Chen et al. 2004) we included an adjusting factor: the coefficient of variance of quantal amplitudes, CV1. Therefore,
and
where the properties Prw and Qw reflect that they are weighted towards estimating sites with large probabilities of release and quantal amplitudes, respectively. Nmin is equal to the minimum number of release sites to explain the observed data. A parabola can be fitted to a plot of variance against amplitude, revealing the parameters Qw and Nmin. Because of the difficulty of measuring  in our non-isolated slice preparation, we used the value obtained in isolated hippocampal cultures of 0.28 (Ikeda et al. 2008). Variance–mean analysis requires that postsynaptic receptors are not reaching saturation (if there is multivesicular release at a single synapse). However, application of zolpidem (100 nm) slightly enhanced the amplitude of aIPSCs (11 ± 4%, P= 0.04, n= 14, paired t test), indicating that autaptic synapses are not reaching saturation (Perrais & Ropert, 1999). Moreover, even with saturation, variance–mean analysis only underestimates the number of release sites, but correctly estimates the quantal amplitude and the probability of release (Ikeda et al. 2008).
We altered Pr by evoking a train of 10 events at 50 Hz, inducing depression. We assumed this was due to modulation at a presynaptic site, rather than desensitization or changes in the chloride reversal potential because this has been demonstrated at other synapses (reviewed by Zucker & Regehr, 2002) and importantly that the extent of depression was not altered by the low affinity competitive antagonist (1,2,5,6-Tetrahydropyridin-4-yl) methylphosphinic acid (TPMPA) (200 μm; control 68 ± 4%, TPMPA 69 ± 3%, F(1,134)= 0.9, P= 0.3, non-linear regression; Fig. 3A and B; Wong et al. 2003). Variances and mean amplitudes were calculated from at least 30 trains, evoked every 10 s. We used a train of events to alter Pr rather than the standard protocol of varying the Ca2+:Mg2+ ratio (a technique also recently used by Hull et al. (2009)) simply because it allows a more rapid estimation of quantal parameters.
Figure 3. Paired pulse depression at autaptic synapses is presynaptic, which allows the estimation of quantal parameters using variance–mean analysis.
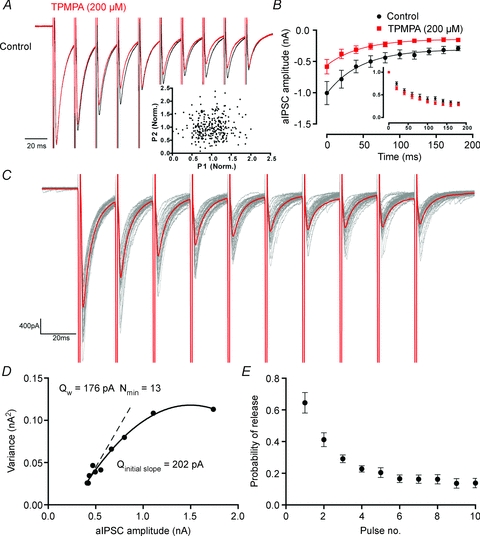
A, a scaled average showing that the extent of paired pulse depression is not affected by application of the rapidly dissociating GABAA antagonist, TPMPA (200 μm). Inset, across multiple trials and cells, there is no correlation between the amplitude of the first pulse in a train, and the second. B, group statistics showing that the extent of depression is not affected by TPMPA (control 68 ± 4%, TPMPA 69 ± 3%, F(1,134)= 0.9, P= 0.3, non-linear regression). Inset, the amplitude of events normalized to the first event in the train. C, a train of aIPSCs with the average amplitude (black) and individual traces (red), showing how amplitude and variance vary during the train. D, an example of variance–mean analysis for the recording shown in C. The dashed line is the initial slope, calculated over the last 5 events in the train, showing that the quantal amplitude late in the train (Qinitial slope) is essentially the same as that over the whole train. E, how the probability of release varies during a train of aIPSCs (n= 6).
Statistics
Parameters of aIPSCs (peak amplitude, decay kinetics etc.) were all calculated from an average of five events. Neither peak aIPSC amplitude or charge transfer associated with the aIPSC were normally distributed (P < 0.0001, n= 132, D’Agostino & Pearson omnibus test). However, transformation by taking the log10 of the absolute amplitude produced a normal distribution (P= 0.7) and hence for tests on aIPSC amplitudes, peak currents and charge transfers, these values were transformed before being subjected to parametric statistics. It is worth noting that all experiments investigated with paired t tests gave the same results (significant vs. non significant) when the raw results were tested with the non-parametric Wilcoxon signed ranks test. A random sample of 40 times to peak, fast and slow decay constants and paired pulse ratios were normally distributed and therefore measurements of these parameters were subjected to parametric statistics. Tests on firing rates were conducted with non-parametric tests as firing rates were unlikely to be normally distributed because FS cells cannot sustain low firing rates. Statistical tests were performed with Prism v4 (Graphpad, CA, USA).
Results
We made recordings from 149 autaptic FS cells from slices made from 53 rats. At 22°C, in 1 mm[Mg2+]o and 2 mm[Ca2+]o autaptic inhibitory postsynaptic currents (aIPSCs) had a mean peak conductance of 10.7 ± 0.9 nS (n= 149) and from each cell the number of events had a coefficient of variation of 0.374 ± 0.04 (n= 6, 291 events; Fig. 1C). As previously demonstrated, a train of aIPSCs at 50 Hz depressed with a time constant of 31 ms to a maximal depression of 23% of baseline amplitude (n= 6; Fig. 1D and E; Bacci & Huguenard, 2006). After an aIPSC, a second event showed paired pulse depression, which recovered in a manner best fitted by two exponentials with time constants of 56 ms and 4156 ms, giving a weighted decay constant of 2126 ms (n= 6; Fig. 1F and G).
Tamas et al. (1997) reported that in cat visual cortex, basket cells formed autaptic contacts that primarily targeted the soma, with approximately 70% of synaptic contacts formed within 50 μm of the soma. It is possible that while the majority of autaptic synapses are formed close to the soma, perisomatic synapses may have a lower release probability or a lower postsynaptic density of GABAA receptors and hence they may contribute a smaller part of the total aIPSC than expected simply by considering synapse number. Furthermore, species differences could exist between the rat and the cat. In order to test these possibilities, the GABAA antagonist gabazine (10 μm) was puff applied (along with 20 μm Alexa Fluor 488; Alexa had no effect when applied by itself) from a 2–4 MΩ pipette within 5–10 μm of the soma. An autaptic event was evoked 800 ms after the puff, and an epifluorescence image was captured. This showed that at the time of the aIPSC, the soma was in the centre of a cloud of antagonist approximately 50–60 μm in diameter (Fig. 2A and B; Kole et al. 2007; Kruglikov & Rudy, 2008). Within the cloud of gabazine, we are assuming the antagonist has reached sufficient concentrations for a sufficient time to achieve a full blockade of all GABAA receptors (gabazine IC50∼0.2–0.4 μm, and at this concentration saturates receptors in 50 ms, Ueno et al. 1997; Jones et al. 1998; Mori et al. 2002; McCartney et al. 2007). Perisomatic gabazine produced an 82 ± 6% inhibition of the aIPSC charge transfer (control 2.95 ± 0.40 pC, gabazine 0.59 ± 0.26 pC, wash 1.90 ± 0.47 pC; F(2,3)= 32.14, P= 0.0006, 1-way ANOVA; control vs. gabazine, P < 0.0001, Bonferroni post hoc test; n= 4; Fig. 2C and D). Given that Tamas et al. (1997) found that 70% of autaptic contacts were formed within 50 μm of the soma, our results match very closely.
Figure 2. Autaptic inhibition targets the perisomatic region.
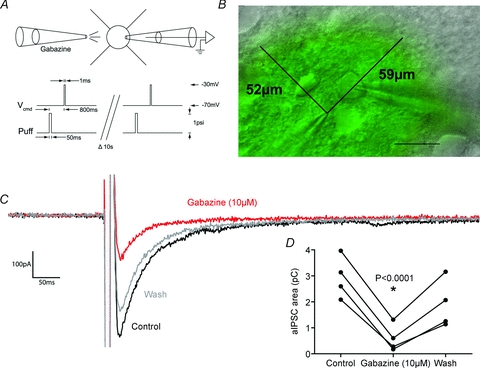
A, schematic diagram of the experiment showing the relationship between the puff of gabazine and the evoked autaptic current. B, overlay of IR-DIC image showing a FS cell being recorded in whole-cell mode (right electrode) and a pseudo-colour wide-field fluorescence image showing the extent of the picospritzed cloud (left electrode) shown by puff-applying Alexa Fluor 488 (20 μm). Scale bar 25 μm. C, representative autaptic current showing ∼75% blockade by perisomatic application of gabazine (10 μm). D, perisomatic gabazine produces an 82 ± 6% inhibition of autaptic currents, which largely reversed by the next evoked autaptic current (control 2.95 ± 0.40 pC, gabazine 0.59 ± 0.26 pC, wash 1.90 ± 0.47 pC; F(2,3)= 32.14, P= 0.0006, 1-way ANOVA; control vs. gabazine, P < 0.0001, Bonferroni post hoc test; n= 4).
Tamas et al. (1997) found that cat cortical basket cells made an average of 12 autaptic junctions (range: 3–23). Using variance–mean analysis, we investigated the quantal parameters of autapses, evoking 10 pulses at 50 Hz to depress the probability of release (Prw) (Fig. 3C). We felt it safe to assume that trains of activity solely depressed aIPSC amplitude via a presynaptic (Prw) mechanism for two reasons. Firstly, the extent of depression was not altered by the low affinity competitive antagonist TPMPA (200 μm; control 68 ± 4%, TPMPA 69 ± 3%, F(1,134)= 0.9, P= 0.3, non-linear regression, Fig. 3A and B). Secondly, the amplitude of the second pulse in a pair of pulses was not correlated with the first, arguing against vesicle depletion (n= 291, Spearman's r= 0.05, P= 0.4, Fig. 3A inset). In 6 out of 7 cells, the initial Prw was sufficiently high for a parabola to be fitted to a plot of aIPSC mean amplitude against aIPSC variance for each event in the train allowing us to calculate Prw, the quantal amplitude (Qw) and the number of release sites (Nmin) (Fig. 3D). In one cell the Prw was low (<0.6), so only a straight line could be plotted, allowing only Qw to be calculated. We calculated that for this population of autapses, the mean Qw was 101 ± 16 pA (range: 57–176, n= 7) and the average Nmin was 14 (range: 4–26, n= 6). The initial Prw was 0.64 ± 0.06 (n= 6), which decayed over pulses to a steady-state value of 0.14 ± 0.1 (Fig. 3E). Assuming one release site per synapse (Silver et al. 2003) these data fitted almost perfectly with the observations of Tamas et al. (1997). These results give us another opportunity to test whether the paired pulse depression we observed during a train was due solely to changes at a presynaptic locus. If receptor desensitization or a reduction in the Cl− gradient was responsible for paired pulse depression, this would be reflected by a reduction in Qw late in the train. We can calculate the quantal amplitude of events late in the train by plotting the initial slope of the variance–mean graph (Qinitial slope). If this is less than the quantal amplitude given by the full, parabolic fit, this indicates that paired pulse depression is mediated in part by a postsynaptic mechanism (Meyer et al. 2001). However, Qinitial slope, as calculated from the last five events in the train, was not significantly less than Qw (Qinitial slope= 117 ± 19 pA, Qw= 106 ± 18 pA, P= 0.5, n= 6, paired t test).
To understand the functional implication of autaptic inhibition in FS cells the native reversal potential of GABA-mediated currents needs to be measured under non-invasive physiological conditions. Using the gramicidin perforated patch technique (which does not disturb intracellular Cl− levels) we endeavoured to measure the reversal potential of autaptic events and the resting potential of FS cells at 35°C. However, possibly because of the relatively high series resistance (33 ± 2.5 MΩ, n= 6) we were unable to evoke a clearly distinguishable autaptic event. As autapses form somatically, we puff applied the GABAA agonist muscimol to the soma (10 μm; 50 ms, 1 p.s.i.) from a 2–4 MΩ patch electrode. We expect this local muscimol to activate GABAA receptors at both synaptic and autaptic connections at the soma that we assume have an equal reversal potential due to being exposed to the same concentration of intra- and extracellular Cl−. The muscimol-induced current had a reversal potential of −78 ± 4 mV (n= 5; Fig. 4). In case the portion of autaptic connections that were not somatic had a different reversal potential due to different levels of Cl− in distal compartments, we also puff applied muscimol to dendrites on the pial side of the FS cell when they could be observed at approximately 100 μm from the soma. Dendritically evoked muscimol currents had an indistinguishable reversal potential (−77 ± 6 mV, P= 0.5, n= 3, paired t test). When recorded at 35°C using the gramicidin perforated patch technique, FS cells had a resting membrane potential of −74 ± 1 mV (n= 18, range −80 to −64 mV) indicating that autaptic events are slightly hyperpolarizing to rest.
Figure 4. GABAA receptor-mediated chloride currents reverse at−78 mV in FS cells.
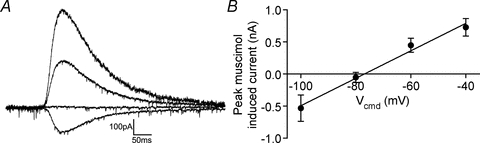
A, representative gramicidin perforated patch recording showing the puff application of muscimol to the soma at holding potentials of −100, −80, −60 and −40 mV. B, current–voltage plot of somatically evoked muscimol currents (n= 5).
Given the hypothesis that FS cells have autapses to generate a modifiable AHP, we tested whether autaptic traffic is modulated by a variety of classical presynaptically acting neuromodulator systems. We found that activation of GABAB receptors and muscarinic acetylcholine receptors with R-baclofen (5 μm) and muscarine (10 μm) significantly reduced GABA release at autaptic synapses to approximately 47% (control 560 ± 188 pA, R-baclofen 267 ± 87 pA, n= 11, P < 0.0001, paired Student's t test; Fig. 5A) and 51% (control 919 ± 337 pA, muscarine 469 ± 169 pA, n= 8, P < 0.0001, paired Student's t test; Fig. 5B) of baseline, respectively. Likewise, R-baclofen significantly increased the paired-pulse ratio of aIPSCs from 0.76 ± 0.04 to 1.07 ± 0.11 (n= 11, P= 0.03, paired Student's t test) as did muscarine (control 0.88 ± 0.04, muscarine 1.10 ± 0.09, n= 8, P= 0.01, paired Student's t test; Fig. 5C). On the other hand, we investigated dopamine (dopamine, 10 μm), μ-opioid (DAMGO, 1 μm), serotonin (5-HT, 10 μm), histamine H3 (imetit, 100 nm), adenosine (adenosine, 10 μm), adreno- (noradrenaline, 10 μm), group I/II metabotropic glutamate (t-ACPD, 10 μm) and cannabinoid CB1 (WIN 55,212, 1 μm) receptor activation, and found them all to be without effect (see Supplemental Figs S1 and S2, available online only; see legends for means). These compounds also had no effect on the paired pulse ratio of aIPSCs (Supplemental Fig. S3, see legend for means).
Figure 5. Autaptic GABA release is sensitive to GABAB and muscarinic acetylcholine receptor activation.
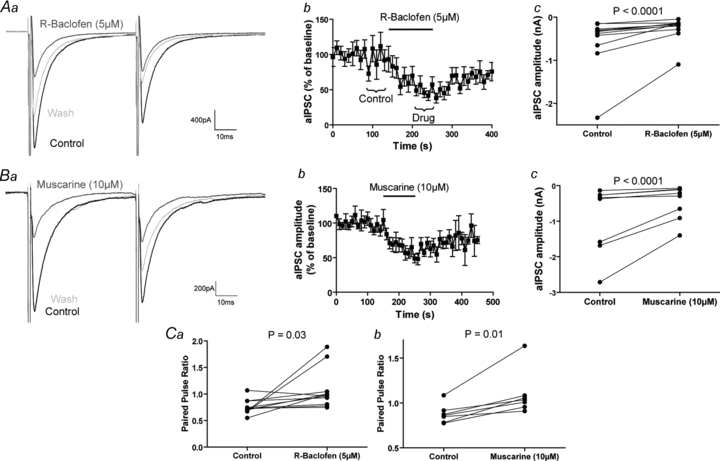
Aa, example aIPSCs before, during and after the application of R-baclofen (5 μm). Ab, effect of R-baclofen on aIPSC amplitude over time (n= 11). The brackets show the 5 pre- and post-drug events over which the averages in a were generated and the amplitudes in c were recorded. Ac, R-baclofen significantly reduces the amplitude of aIPSCs (control 560 ± 188 pA, R-baclofen 267 ± 87 pA, n= 11, P < 0.0001, paired t test). Ba, example aIPSCs before, during and after the application of muscarine (10 μm). Bb, the effect of muscarine on aIPSC amplitude over time (n= 8). Bc, muscarine significantly reduces the amplitude of aIPSCs (control 919 ± 337 pA, muscarine 469 ± 169 pA, n= 8, P < 0.0001, paired t test). Ca, R-baclofen significantly increases the paired pulse ratio of aIPSCs (control 0.76 ± 0.04, R-baclofen 1.07 ± 0.11, n= 11, P= 0.03, paired t test). Cb, muscarine significantly enhances the paired pulse ratio of aIPSCs (control 0.88 ± 0.04, muscarine 1.10 ± 0.09, n= 8, P= 0.01, paired t test).
Neurotransmitter transporters are an acknowledged site of synaptic plasticity (Pita-Almenar et al. 2006; Shivachar, 2007), so we investigated what role the GABA transporter (GAT) has in regulating autaptic traffic. Therefore, we made recordings at 35°C and applied the broad spectrum GAT substrate/inhibitor R-nipecotic acid (100 μm) (IC50 6, 19, 51 μm for GAT1, GAT2 and GAT3, respectively; Dhar et al. 1994; Ruiz et al. 1994; Soudijn & van Wijngaarden, 2000). This had no effect on the decay constants of aIPSCs (fast decay: control 2.2 ± 0.2 ms, nipecotic acid 2.1 ± 0.1 ms; n= 7, P= 0.3; slow decay: control 21.5 ± 2.2 ms; nipecotic acid 21.3 ± 1.4 ms; n= 7, P= 0.9, paired t test, Fig. 6A and B). We noted that while there was a significant difference in the fast decay constant between all aIPSCs recorded at 35°C compared to 25 randomly selected events recorded at room temperature (Q10= 1.9), there was no difference in the slow decay constant (fast decay: 22°C 4.7 ± 0.2 ms, 35°C 2.0 ± 0.2 ms; n= 25,16; P < 0.0001; slow decay: 22°C 19.3 ± 1.2 ms; 35°C 17.7 ± 1.8 ms; n= 25–16, P= 0.5, unpaired t test, Fig. 6C and D) (Q10= 1.1). There was a significant decrease in the time for the autaptic current to peak from 3.1 ± 0.1 ms to 2.2 ± 0.1 ms (n= 15–16, P < 0.0001, unpaired t test, Fig. 6C inset). The small difference in decay between room temperature and 35°C could not be explained by higher series resistances at 35°C artificially slowing the apparent decay of aIPSCs (room temperature 8.3 ± 0.6 MΩ, 35°C 8.7 ± 0.4 MΩ, n= 25, 16, P= 0.5, unpaired t test). The exact biophysical mechanisms behind the apparent two-phase decay of some synaptic events are unclear (Jones & Westbrook, 1995). One report has shown that both phases of decay of IPSCs recorded in ventrobasal thalamic neurons have a Q10 of approximately 2 (Huntsman & Huguenard, 2000; though these IPSCs are also regulated by GABA transporters, Jia et al. 2008) while blockade of GABA transporters usually has a larger or exclusive effect on the slow phase of IPSC decay (Roepstorff & Lambert, 1994; Engel et al. 1998), indicating that the slow phase of IPSC decay may be the phase that the GABA transporter can act on.
Figure 6. aIPSCs are not controlled by GABA transporters.
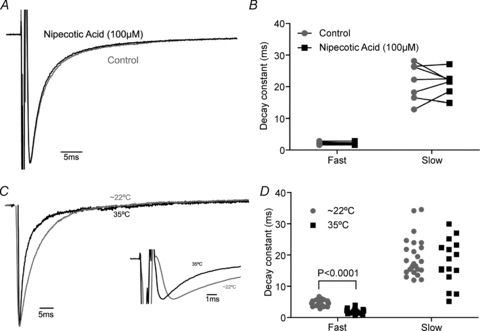
A, representative autaptic event before and after application of the broad-spectrum GAT inhibitor R-nipecotic acid (100 μm). B, nipecotic acid has no effect on the fast and slow decay constants of aIPSCs (fast decay: control 2.2 ± 0.2 ms, nipecotic acid 2.1 ± 0.1 ms; n= 7, P= 0.3; slow decay: control 21.5 ± 2.2 ms, nipecotic acid 21.3 ± 1.4 ms; n= 7, P= 0.9, paired t test). C, representative aIPSCs recorded at ∼22°C and 35°C showing the subtle change in decay. Sodium current digitally removed. Autaptic events scaled and aligned to peak. Inset, representative aIPSCs showing the decrease in time to peak at ∼22°C and 35°C. D, an increased temperature significantly enhances the fast decay constant but only non-significantly enhances the slow decay constant (fast decay: 22°C 4.7 ± 0.2 ms, 35°C 2.0 ± 0.2 ms; n= 25,16; P < 0.0001; slow decay 22°C 19.3 ± 1.2; 35°C 17.7 ± 1.8 ms; n= 25–16, P= 0.5, unpaired t test).
As it appears that autaptic connections are not controlled by GABA transporters, it seems possible that GABA released at autaptic sites may diffuse to activate extrasynaptic GABA receptors. As GABAB receptors are largely expressed in perisynaptic regions and we have already demonstrated presynaptic control of autapses by the GABAB receptor, we investigated whether GABA release at autapses activates GABAB receptors (Scanziani, 2000; Kulik et al. 2003). By evoking a train of aIPSCs GABA spillover may activate presynaptic GABAB receptors and be partially responsible for the depression of autaptic events as is observed at basket cell–granule cell synapses in the hippocampus (Kraushaar & Jonas, 2000). However, the GABAB antagonist CGP 52432 (10 μm) had no effect on the initial amplitude or extent of the depression (initial amplitude 836 ± 190 pA, CGP 842 ± 242 pA; 10th pulse amplitude 226 ± 46 pA, CGP 225 ± 31 pA; n= 6, F(3,114)= 0.3, P= 0.8; non-linear regression, Fig. 7A and B). We also investigated whether autaptic events had a significant postsynaptic GABAB-mediated component. Cells were voltage clamped at −60 mV in order to increase the driving force for K+, as postsynaptic effects of GABAB receptors are mediated by G-protein-coupled potassium channels. Evoking autaptic events in the presence of GABAA receptor blockade (gabazine, 10 μm), induced an outward current in the majority of neurons (4 out of 6). However, the charge transferred during this outward current was not affected by CGP 52432 (10 μm) (control 0.499 ± 0.253 fC, CGP 0.532 ± 0.172 fC, Fig. 7C and D).
Figure 7. Autaptic GABA release does not recruit GABAB receptors.
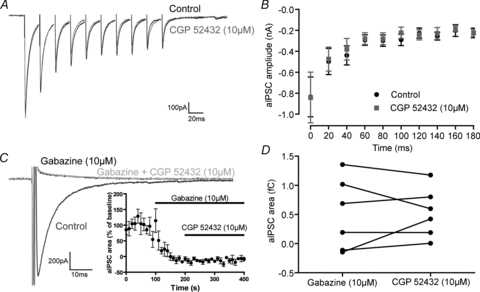
A, representative trace showing the lack of effect of the GABAB receptor antagonist CGP 52432 (10 μm) on depression of GABA release during a train of events. B, the depression shown during a train of autaptic events is not affected by CGP 52432 (10 μm) (initial amplitude 836 ± 190 pA, CGP 842 ± 242 pA; 10th pulse amplitude 226 ± 46 pA, CGP 225 ± 31 pA; n= 6, F(3,114)= 0.3, P= 0.8; non-linear regression). C, representative aIPSC before and after the application of the GABAA antagonist gabazine (10 μm) and the GABAB receptor antagonist CGP 52432 (10 μm) (Vcommand=−60 mV). Inset, the effect of gabazine and CGP 52432 on aIPSC charge transfer over time. D, effect of CGP 52432 on the residual inward current (control 0.499 ± 0.253 fC, CGP 0.532 ± 0.172 fC).
GABA spillover from the synapse could also result in phasic activation of extrasynaptic GABAA receptors. In 8 out of 17 cells a distinct late inward component was seen after a train of autaptic events (10 at 50 Hz) (Fig. 8A arrow). Typically, extrasynaptic GABAA receptors are molecularly distinct from synaptic GABAA receptors, and hence show different pharmacology (Farrant & Nusser, 2005). The GABAA receptor positive modulator zolpidem was applied at concentrations selective for GABAA receptors containing the α1 subunit (100 nm; Hadingham et al. 1996; Wafford et al. 1996; Sanna et al. 2002). Zolpidem increased the amplitude of the evoked current throughout the first 50 ms of the decay, prolonging the time constant, and increasing the charge transfer (fast decay: control 1.5 ± 0.3 ms, zolpidem 2.2 ± 0.3 ms; n= 6, P= 0.006; slow decay: control 7.8 ± 1.4 ms; zolpidem 14.6 ± 2.0 ms; n= 6, P= 0.0008, paired t test; charge transfer: control 3.0 ± 0.8 pC; zolpidem 4.6 ± 0.9 pC; n= 6, P= 0.01). However, after the first 50 ms, zolpidem had no effect on the charge transfer (control 2.2 ± 0.5 pC; zolpidem 2.1 ± 0.4 pC; n= 6, P= 0.8, paired t test; Fig. 8A and C). This late autaptic event, which was evidently not mediated by α1-containing GABAA receptors, was indeed mediated by GABAA receptors of some kind, as it was blocked by gabazine (10 μm; Fig. 8B). However, it was not mediated by α4γxδ receptors (high affinity receptors that mediate late phasic GABAergic events and tonic GABA currents in other parts of the cortex; Brown et al. 2002; Wei et al. 2003) as application of the α4/6γxδ-selective positive modulator THDOC (100 nm; Stell et al. 2003) had no effect on the charge transferred during the late phase of the event, measured from 50 ms to 400 ms after the aIPSC peak (control 1.4 ± 0.2 pC, THDOC 1.4 ± 0.2 pC, n= 7, P= 0.2, Supplemental Fig. S4). To test whether the late aIPSC was mediated by extrasynaptic current, we applied the low affinity GABAA antagonist TPMPA (200 μm). If the late current was mediated by extrasynaptic GABAA receptors, one would expect the receptors mediating it to experience a lower GABA concentration than synaptic GABAA receptors. This lower concentration of GABA would be less effective at out-competing the rapidly dissociating TPMPA, so TPMPA should be more efficacious at blocking IPSCs mediated by low concentrations of GABA than saturating concentrations of GABA (Szabadics et al. 2007). However, TPMPA induced a similar percentage reduction in the charge transferred during the first event in a train of aIPSCs as it did during the late autaptic event (first event 58 ± 3%, late event 54 ± 4%, n= 7, P= 0.4, unpaired t test; Fig. 8D and E). However, as the subunit composition of the receptors mediating this late aIPSC is different from that mediating the synaptic event, and TPMPA is known to be somewhat subunit specific (Chebib et al. 1998) this could confound our experiment. Therefore, we applied 40 kDa dextran (5% w/v) which will increase the viscosity of the aCSF approximately 2.5 times and decrease the speed of diffusion of all neurotransmitters (Min et al. 1998; Szabadics et al. 2007). However, dextran had no effect on the charge transferred during the late autaptic event (control 2.0 ± 0.2 pC dextran 2.1 ± 0.2 pC, n= 9, P= 0.3, paired t test; Fig. 8F). Therefore, the late aIPSC is simply mediated by a synaptic non-α1-containing GABAA receptor, with a slower dissociation rate for GABA.
Figure 8. A train of autaptic events causes a late GABAA-mediated current that is mediated by non-α1 subunit-containing GABAA receptors, yet is not extrasynaptic.
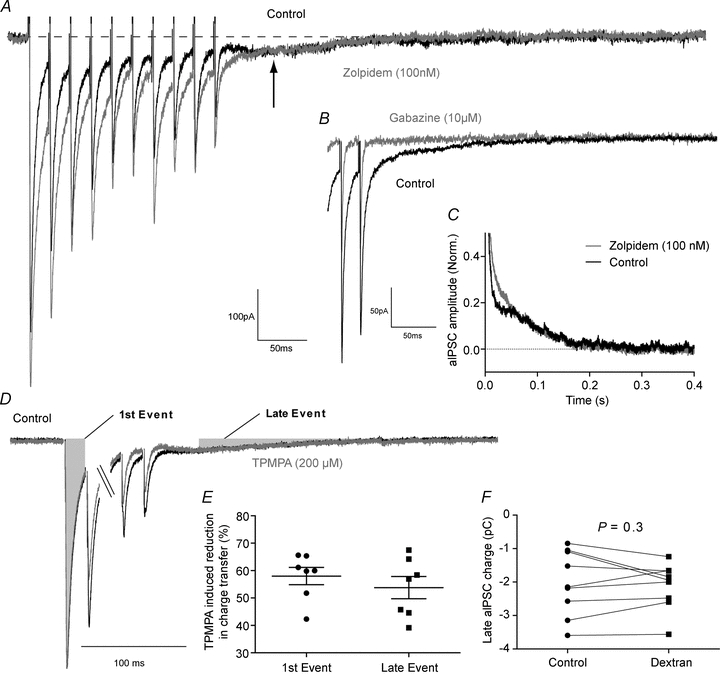
A, representative trace showing the late inward current (arrow), and its lack of modulation by zolpidem (100 nm). B, GABAA receptor blockade with gabazine (10 μm) blocked the entire autaptic event. C, averaged decay phase of the last autaptic event normalized to the peak control amplitude (n= 6), clearly showing the late autaptic current and its lack of sensitivity to zolpidem. D, representative train of autaptic events before and after the application of the low affinity GABAA antagonist TPMPA (200 μm) showing the area of aIPSCs used to calculate charge transfer. E, TPMPA reduced the charge transferred during the first aIPSC to the same extent as it reduced charge transfer during the late aIPSC (first event 58 ± 3%, late event 54 ± 4%, n= 7, P= 0.4, unpaired t test). F, dextran had no effect on the charge transferred during the late aIPSC (control 2.0 ± 0.2 pC, dextran 2.1 ± 0.2 pC, n= 9, P= 0.3, paired t test).
Given that the autaptically released GABA produces an inhibitory conductance that follows action potentials for approximately 50 ms, it is not surprising that blockade of autaptic currents increases the firing rate of FS cells in layer V during current injection (Bacci et al. 2003a). However, as this autaptic inhibition is largely coincident with the high conductance AHP in FS cells (Rudy & McBain, 2001), its effect on membrane potential may not be maximal when the autaptic conductance is peaking, but rather at some point during the decay when the membrane resistance of the cell has increased. Indeed, one could imagine that interventions that slow the decay of autaptic events, and render the aIPSC active for a longer period of time, such as benzodiazepines, would have a profound effect on the firing rate of FS cells. This could have a paradoxical effect where ‘pro-GABAergic’ drugs like benzodiazepines could in fact decrease the activity of FS cells and have a net disinhibitory effect in cortical circuits. Indeed, benzodiazepines do significantly increase the amplitude of AHP in hippocampal autaptic FS basket cells, though the effect on firing rate was not formally investigated (Pawelzik et al. 2003). We investigated the effect of zolpidem (1 μm) (cf. ∼200 nm peak in human plasma during clinical dosing, reviewed in Keller et al. 1999) on neuronal firing when neurons were recorded in gramicidin perforated patch mode at 35°C. Enough current was injected to produce a continuous burst of action potentials 500 ms long (range: 80–410 pA) and then zolpidem was applied. Subsequently, the perforated patch electrode was withdrawn, and neurons were recorded in whole-cell mode and the presence and amplitude of the autaptic current was measured. In neurons without measurable autapses, zolpidem produced no change in firing rate, as measured by the instantaneous firing rate of the first two spikes (2.3 ± 1.2% increase, n= 4), while in autaptic cells it produced a reversible 10.8% decrease in firing rate (control 64.9 ± 6.6 Hz, zolpidem 58.3 ± 7.2 Hz, wash 67.0 ± 6.7 Hz; n= 10; P= 0.003, Friedman test; control vs. zolpidem P < 0.05, Dunn's test; Fig. 9A and B). Indeed, there was a significant correlation between autapse amplitude and decrease in firing rate caused by zolpidem (n= 14, Spearman's r= 0.826, P= 0.0003; Fig. 9C). In this data set, there was one cell whose firing rate slowed markedly (but reversibly) in response to zolpidem, and when one considers the percentage change in firing rate, this response is just an outlier (44.9%, mean = 11.2%, σ= 13%, n= 10, P= 0.0499, Grubb's test). However, even with this data point excluded, zolpidem significantly slowed firing rate (control 65.5 ± 7.4 Hz, zolpidem 61.1 ± 7.4 Hz, wash 66.3 ± 7.5 Hz; n= 9; P= 0.01, Friedman test; control vs. zolpidem P < 0.05, Dunn's test) and there was a significant correlation between peak aIPSC amplitude and the magnitude of zolpidem-induced change in firing (n= 13, Spearman's r= 0.788, P= 0.001).
Figure 9. GABAA receptor positive modulators slow the firing of autaptic FS cells.
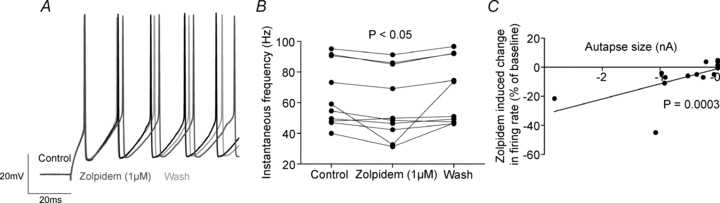
A, representative recording of an autaptic FS cell before, during and after the application of zolpidem (1 μm). B, zolpidem reversibly slows the firing rate of autaptic FS cells (instantaneous firing rate of first doublet of spikes, control 64.9 ± 6.6 Hz, zolpidem 58.3 ± 7.2 Hz, wash 67.0 ± 6.7 Hz; n= 10; P= 0.003, Friedman test; control vs. zolpidem P < 0.05, Dunn's test). C, the firing rate of FS cells with larger autapses is reduced more by zolpidem (n= 14, Spearman's r= 0.826, P= 0.0003).
Discussion
Others have previously demonstrated anatomically and electrophysiologically the autaptic connections formed by cortical FS basket cells (Tamas et al. 1997; Bacci et al. 2003a). Here we have demonstrated that, physiologically, these autaptic connections match the anatomical reports with regard to their large number of release sites and the perisomatic location of the majority of synapses. Our results also show that these autaptic connections can be dynamically regulated by specific neuromodulatory receptors: the GABAB receptor and muscarinic acetylcholine receptors (presumably M2 and M4 receptors, as these subtypes are responsible for regulating GABA release at FS–pyramidal cell synapses (Kruglikov & Rudy, 2008). It appears that the autaptic connections of FS cells are not regulated by GABA transporters, yet autaptically released GABA does not reach extrasynaptic GABAA or GABAB receptors. Finally, we found that the positive GABAA receptor modulator zolpidem slows the firing of autaptic cells, presumably decreasing the amount of GABA they release.
Our results on the basic synaptic physiology of autaptic connections match closely with those previously reported (Bacci & Huguenard, 2006). When recruited at 50 Hz, aIPSCs depressed with a time constant of 31 ms (cf. 31.2 ms) and recovered with a time constant of 2126 ms (cf. 681 ms). This time constant of depression also fitted well with hippocampal basket cell–basket synapse depression (25 ms; Bartos et al. 2001). Potentially the difference in the rate of recovery is due to the depression being induced by a single spike in our hands, and a train at 60 Hz by Bacci & Huguenard (2006). It may also be due to our recordings being performed at 22°C and those of Bacci and Huguenard being performed at 32°C (though this would mean recovery from depression had an exceptionally high Q10 of 3.8). However, our value fits very closely with that recorded at basket cell–granule cell synapses (1970 ms; Kraushaar & Jonas, 2000). In our experiments the average autaptic event had a peak conductance of 10.7 nS, nearly twice the previously reported value of 6 nS (Bacci & Huguenard, 2006). This is probably due to the fact that our recordings were performed in [Ca2+]o= 2 mm and [Mg2+]o= 1 mm, while the experiments of Bacci and Huguenard were performed in [Ca2+]o= 2 mm and [Mg2+]o= 2 mm, increasing the probability of release in our experiments. Our results matched exceptionally well with the anatomical results of Tamas et al. (1997) who reported that in cat cortical basket cells autapses had a mean distance from the soma of 12 μm with a standard deviation of 22 μm. We found that local application of the GABAA antagonist gabazine, which was expected to block all GABAergic synapses within 50–60 μm of the soma (expected to cover ∼70% of autaptic synapses), blocked 82% of the autaptic event. However, because the concentration of gabazine will have been lower near the edges of the puff-applied cloud, we stress this is only a rough approximation of the synaptic distribution. Tamas et al. (1997) also reported in an investigation of seven basket cells that they made on average 12 synaptic contacts (range 3–23). Quantal analysis of seven basket cells found that their autaptic events could be explained by an average of 14 release sites (range 4–26). We also found that autaptic connections had a mean probability of release of 0.64, compared with 0.56 for basket cell–granule cell synapses and a mean quantal amplitude of 101 pA (1.42 nS) compared with 0.4–1.7 nS at basket cell–granule cell synapses (Nusser et al. 1998; Kraushaar & Jonas, 2000).
Using the gramicidin perforated patch technique we showed that somatic GABAA currents in FS interneurons have a reversal potential of −78 mV, and are hyperpolarizing relative to the resting membrane potential. This finding contrasts strongly with the report that GABAergic events in dentate gyrus basket cells have a reversal potential of −52 mV, and are shunting relative to rest (Vida et al. 2006). We can offer no explanation as to the reason for this difference; however, it highlights the fact that hippocampal and neocortical basket cells are physiologically different. It is also worth considering how the reversal potential of GABAA currents compares with the AHP FS interneurons experience. During perforated patch recording, in response to rheobase current injection, FS cells experienced AHPs that during their maximum brought the membrane potential to −72 ± 1 mV (n= 27), and so autaptic events are hyperpolarizing throughout the whole AHP.
It has been suggested that basket cells have autaptic connections as well as voltage-gated and potassium channels to provide an AHP because synaptic release of GABA is readily modifiable through neuromodulation unlike the potassium channels that mediated the AHP in FS cells (Bekkers, 1998, 2003). We have demonstrated that autaptic GABA release from basket cells is modified by GABAB and muscarinic acetylcholine receptors, but not by adenosine, dopamine, 5-HT, histamine, noradrenaline, metabotropic glutamate, cannabinoid or μ-opioid receptors. Interestingly, this is just a subset of the neurotransmitter systems which modify layer V basket cell–pyramidal cell synapses (GABAB, muscarinic acetylcholine, adenosine and serotonin; Kruglikov & Rudy, 2008). Our results also indicate that autaptic connections do not appear to be controlled by GABA transporters. Reports indicate that perisomatic input to the pyramidal cells is regulated by GAT-1 (Gonzalez-Burgos et al. 2009) which probably reflects input from basket cells (Kruglikov & Rudy, 2008), though we are not aware of any reports that show whether or not GABAergic synapses onto basket cells are subject to GABA transport.
We found that a train of autaptic events produced a late GABAA-mediated current that was not sensitive to zolpidem or THDOC indicating that it was not mediated by GABAA receptors containing either α1 or δ subunits. However, the late current was not due to GABA activating extrasynaptic receptors, because dextran, which should slow the diffusion of GABA from the synaptic cleft, had no effect. Furthermore, TPMPA, which would be expected to block postsynaptic currents mediated by receptors that were far from saturation to a higher degree than currents mediated by nearly saturated receptors, had an equal effect on the early and late aIPSC. Even with the lack of transport-mediated GABA clearance, autaptically released GABA does not recruit pre- or postsynaptic GABAB receptors. This may seem unexpected, as GABAB activation by exogenous agonists has effects on the resting membrane potential (data not shown) and neurotransmitter release from FS cells. However, we suggest that it is likely that a specific subset of interneurons are responsible for recruiting GABAB-mediated signalling, namely neurogliaform cells (Oláh et al. 2007, 2009).
We also demonstrated that the positive GABA modulator zolpidem slows the firing of autaptic FS cells on average 10%. We hypothesized that zolpidem may slow firing rates of autaptic FS cells to such a degree that it could have an anti-GABAergic effect in total. However, this anti-GABAergic effect seems unlikely, as in our experiments 100 nm zolpidem increases charge transfer at autaptic synapses by ∼100% (200 nm enhances synapses on FS cells by 117%, Bacci et al. 2003b) and causes a 70% increase in the amplitude of FS basket cell–pyramidal cell IPSPs, Thomson et al. 2000). Furthermore, because we measured the frequency of cell firing by analysing the inter-event interval of the first two action potentials in a train, and paired pulse depression will decrease the amount of autaptically released GABA over the length of the train, this 10% reduction in firing is the maximum possible effect of zolpidem. Thus, the small decrease in firing rate would be outweighed by the large increase in GABAergic function.
While this study clearly shows that autaptic connections give dynamic negative feedback to layer V FS cells, it also shows that while autapses are governed by the same anatomical principles as FS–FS synapses, they are not governed by all the same functional properties. It has been demonstrated that they are formed largely in the perisomatic region in the same manner as FS autapses (Tamas et al. 1997) and that FS–FS synapses depress in the same fashion as FS autapses (Galarreta & Hestrin, 2002). However, it has been shown that FS–FS synapses are modulated by dopamine D1 receptors, while autaptic connections are not (Towers & Hestrin, 2008). This makes it clear that autaptic synapses are regulated differentially to FS–FS connections, a fact that further suggests that the autaptic connections of FS cells are not a developmental accident.
Finally, one might ask what is the physiological advantage of reducing the amplitude of autaptic events? Given the importance of autaptic traffic in regulating the spike-timing accuracy of an individual basket cell (Bacci & Huguenard, 2006), how would the nervous system benefit from reducing autaptic GABA release? Furthermore, since FS–FS synapses are likely to be regulated by GABAB and potentially by muscarinic acetylcholine receptors and these synapses are of prime importance in regulating the firing synchrony of populations of FS cells and the generation of gamma oscillations in cortical networks, activation of these receptors seems even more deleterious to network function (Tamas et al. 2000; Traub et al. 2001; Bartos et al. 2007). However, we do not expect this will be the case, at least for muscarinic receptors. While activation of presynaptic inhibitory receptors does reduce the basal level of GABA release, it is likely that during a train of activity, presynaptic inhibitory receptors actually increase the steady-state level of GABA release, thus activation of these receptors actually favours autaptic and FS–FS transmission during high frequency activity (Brenowitz et al. 1998). Indeed, muscarinic acetylcholine receptor activation can instigate oscillations in isolated hippocampal slices, though this is suspected to be mainly due to its depolarizing effect on the network (Fisahn et al. 2002). It would be interesting to know what effect muscarinic receptor activation has on oscillations evoked by another source of depolarization. As activation of GABAB receptors in the hippocampus by exogenous agonists degrades gamma oscillations (Brown et al. 2007), we suggest that activation of GABAB receptors (probably via the activity of neurogliaform cells) will gate gamma oscillations in the neocortex, while muscarinic receptor activation favours it.
Acknowledgments
We would like to thank Dr Ted Carnevale for comments on this manuscript, Associate Professor John M. Bekkers for his advice with biocytin labelling and variance–mean analysis and Mr Brandel Zachernuk for his assistance with fluorescence imaging. This work was generously supported by the Neurological Foundation of New Zealand and the New Zealand Lottery Grants Board.
Glossary
Abbreviations
- AHP
afterhyperpolarizing potential
- aIPSCs
autaptic inhibitory postsynaptic currents
- FS
fast-spiking
Author contributions
WMC and GL designed the experiments, WMC performed the experiments and WMC and GL drafted the manuscript.
Supplemental material
Figure S1
Figure S2
Figure S3
Figure S4
As a service to our authors and readers, this journal provides supporting information supplied by the authors. Such materials are peer-reviewed and may be re-organized for online delivery, but are not copy-edited or typeset. Technical support issues arising from supporting information (other than missing files) should be addressed to the authors
References
- Atzori M, Lau D, Tansey EP, Chow A, Ozaita A, Rudy B, McBain CJ. H2 histamine receptor-phosphorylation of Kv3.2 modulates interneuron fast spiking. Nat Neurosci. 2000;3:791–798. doi: 10.1038/77693. [DOI] [PubMed] [Google Scholar]
- Bacci A, Huguenard JR. Enhancement of spike-timing precision by autaptic transmission in neocortical inhibitory interneurons. Neuron. 2006;49:119–130. doi: 10.1016/j.neuron.2005.12.014. [DOI] [PubMed] [Google Scholar]
- Bacci A, Huguenard JR, Prince DA. Functional autaptic neurotransmission in fast-spiking interneurons: a novel form of feedback inhibition in the neocortex. J Neurosci. 2003a;23:859–866. doi: 10.1523/JNEUROSCI.23-03-00859.2003. [DOI] [PMC free article] [PubMed] [Google Scholar]
- Bacci A, Rudolph U, Huguenard JR, Prince DA. Major differences in inhibitory synaptic transmission onto two neocortical interneuron subclasses. J Neurosci. 2003b;23:9664–9674. doi: 10.1523/JNEUROSCI.23-29-09664.2003. [DOI] [PMC free article] [PubMed] [Google Scholar]
- Bartos M, Vida I, Frotscher M, Geiger JR, Jonas P. Rapid signalling at inhibitory synapses in a dentate gyrus interneuron network. J Neurosci. 2001;21:2687–2698. doi: 10.1523/JNEUROSCI.21-08-02687.2001. [DOI] [PMC free article] [PubMed] [Google Scholar]
- Bartos M, Vida I, Jonas P. Synaptic mechanisms of synchronized gamma oscillations in inhibitory interneuron networks. Nat Rev Neurosci. 2007;8:45–56. doi: 10.1038/nrn2044. [DOI] [PubMed] [Google Scholar]
- Bekkers JM. Neurophysiology: are autapses prodigal synapses? Curr Biol. 1998;8:R52–55. doi: 10.1016/s0960-9822(98)70033-8. [DOI] [PubMed] [Google Scholar]
- Bekkers JM. Synaptic transmission: functional autapses in the cortex. Curr Biol. 2003;13:R433–435. doi: 10.1016/s0960-9822(03)00363-4. [DOI] [PubMed] [Google Scholar]
- Bekkers JM, Stevens CF. Excitatory and inhibitory autaptic currents in isolated hippocampal neurons maintained in cell culture. Proc Natl Acad Sci U S A. 1991;88:7834–7838. doi: 10.1073/pnas.88.17.7834. [DOI] [PMC free article] [PubMed] [Google Scholar]
- Bekkers JM, Stevens CF. Quantal analysis of EPSCs recorded from small numbers of synapses in hippocampal cultures. J Neurophysiol. 1995;73:1145–1156. doi: 10.1152/jn.1995.73.3.1145. [DOI] [PubMed] [Google Scholar]
- Brenowitz S, Trussell L. Enhancement of Synaptic Efficacy by Presynaptic GABAB Receptoirs. Neuron. 1998;20:135–141. doi: 10.1016/s0896-6273(00)80441-9. [DOI] [PubMed] [Google Scholar]
- Brown JT, Davies CH, Randall AD. Synaptic activation of GABAB receptors regulates neuronal network activity and entrainment. Eur J Neurosci. 2007;25:2982–2990. doi: 10.1111/j.1460-9568.2007.05544.x. [DOI] [PubMed] [Google Scholar]
- Brown N, Kerby J, Bonnert TP, Whiting PJ, Wafford KA. Pharmacological characterization of a novel cell line expressing human α4β3δ GABAA receptors. Br J Pharmacol. 2002;136:965–974. doi: 10.1038/sj.bjp.0704795. [DOI] [PMC free article] [PubMed] [Google Scholar]
- Cauli B, Audinat E, Lambolez B, Angulo MC, Ropert N, Tsuzuki K, Hestrin S, Rossier J. Molecular and physiological diversity of cortical nonpyramidal cells. J Neurosci. 1997;17:3894–3906. doi: 10.1523/JNEUROSCI.17-10-03894.1997. [DOI] [PMC free article] [PubMed] [Google Scholar]
- Chebib M, Mewett KN, Johnston GA. GABAC receptor antagonists differentiate between human rho1 and rho2 receptors expressed in Xenopus oocytes. Eur J Pharmacol. 1998;357:227–234. doi: 10.1016/s0014-2999(98)00552-4. [DOI] [PubMed] [Google Scholar]
- Chen G, Harata NC, Tsien RW. Paired-pulse depression of unitary quantal amplitude at single hippocampal synapses. Proc Natl Acad Sci U S A. 2004;101:1063–1068. doi: 10.1073/pnas.0307149101. [DOI] [PMC free article] [PubMed] [Google Scholar]
- Clements JD. Variance–mean analysis: a simple and reliable approach for investigating synaptic transmission and modulation. J Neurosci Methods. 2003;130:115–125. doi: 10.1016/j.jneumeth.2003.09.019. [DOI] [PubMed] [Google Scholar]
- Cobb SR, Halasy K, Vida I, Nyiri G, Tamas G, Buhl EH, Somogyi P. Synaptic effects of identified interneurons innervating both interneurons and pyramidal cells in the rat hippocampus. Neuroscience. 1997;79:629–648. doi: 10.1016/s0306-4522(97)00055-9. [DOI] [PubMed] [Google Scholar]
- Dhar TG, Borden LA, Tyagarajan S, Smith KE, Branchek TA, Weinshank RL, Gluchowski C. Design, synthesis and evaluation of substituted triarylnipecotic acid derivatives as GABA uptake inhibitors: identification of a ligand with moderate affinity and selectivity for the cloned human GABA transporter GAT-3. J Med Chem. 1994;37:2334–2342. doi: 10.1021/jm00041a012. [DOI] [PubMed] [Google Scholar]
- Engel D, Schmitz D, Gloveli T, Frahm C, Heinemann U, Draguhn A. Laminar difference in GABA uptake and GAT-1 expression in rat CA1. J Physiol. 1998;512:643–649. doi: 10.1111/j.1469-7793.1998.643bd.x. [DOI] [PMC free article] [PubMed] [Google Scholar]
- Farrant M, Nusser Z. Variations on an inhibitory theme: phasic and tonic activation of GABAA receptors. Nat Rev Neurosci. 2005;6:215–229. doi: 10.1038/nrn1625. [DOI] [PubMed] [Google Scholar]
- Fisahn A, Yamada M, Duttaroy A, Gan JW, Deng CX, McBain CJ, Wess J. Muscarinic induction of hippocampal gamma oscillations requires coupling of the M1 receptor to two mixed cation currents. Neuron. 2002;33:615–624. doi: 10.1016/s0896-6273(02)00587-1. [DOI] [PubMed] [Google Scholar]
- Galarreta M, Hestrin S. Electrical and chemical synapses among parvalbumin fast-spiking GABAergic interneurons in adult mouse neocortex. Proc Natl Acad Sci U S A. 2002;99:12438–12443. doi: 10.1073/pnas.192159599. [DOI] [PMC free article] [PubMed] [Google Scholar]
- Gonzalez-Burgos G, Rotaru DC, Zaitsev AV, Povysheva NV, Lewis DA. GABA transporter GAT1 prevents spillover at proximal and distal GABA synapses onto primate prefrontal cortex neurons. J Neurophysiol. 2009;101:533–547. doi: 10.1152/jn.91161.2008. [DOI] [PMC free article] [PubMed] [Google Scholar]
- Hadingham KL, Garrett EM, Wafford KA, Bain C, Heavens RP, Sirinathsinghji DJ, Whiting PJ. Cloning of cDNAs encoding the human γ-aminobutyric acid type A receptor α6 subunit and characterization of the pharmacology of α6-containing receptors. Mol Pharmacol. 1996;49:253–259. [PubMed] [Google Scholar]
- Hull C, Isaacson JS, Scanziani M. Postsynaptic mechanisms govern the differential excitation of cortical neurons by thalamic inputs. J Neurosci. 2009;29:9127–9136. doi: 10.1523/JNEUROSCI.5971-08.2009. [DOI] [PMC free article] [PubMed] [Google Scholar]
- Huntsman MM, Huguenard JR. Nucleus-specific differences in GABAA-receptor-mediated inhibition are enhanced during thalamic development. J Neurophysiol. 2000;83:350–358. doi: 10.1152/jn.2000.83.1.350. [DOI] [PubMed] [Google Scholar]
- Ikeda K, Yanagawa Y, Bekkers JM. Distinctive quantal properties of neurotransmission at excitatory and inhibitory autapses revealed using variance–mean analysis. J Neurosci. 2008;28:13563–13573. doi: 10.1523/JNEUROSCI.3350-08.2008. [DOI] [PMC free article] [PubMed] [Google Scholar]
- Jia F, Yue M, Chandra D, Keramidas A, Goldstein PA, Homanics GE, Harrison NL. Taurine is a potent activator of extrasynaptic GABAA receptors in the thalamus. J Neurosci. 2008;28:106–115. doi: 10.1523/JNEUROSCI.3996-07.2008. [DOI] [PMC free article] [PubMed] [Google Scholar]
- Jones MV, Sahara Y, Dzubay JA, Westbrook GL. Defining affinity with the GABAA receptor. J Neurosci. 1998;18:8590–8604. doi: 10.1523/JNEUROSCI.18-21-08590.1998. [DOI] [PMC free article] [PubMed] [Google Scholar]
- Jones MV, Westbrook GL. Desensitized states prolong GABAA channel responses to brief agonist pulses. Neuron. 1995;15:181–191. doi: 10.1016/0896-6273(95)90075-6. [DOI] [PubMed] [Google Scholar]
- Kawaguchi Y, Kubota Y. Correlation of physiological subgroupings of nonpyramidal cells with parvalbumin- and calbindinD28k-immunoreactive neurons in layer V of rat frontal cortex. J Neurophysiol. 1993;70:387–396. doi: 10.1152/jn.1993.70.1.387. [DOI] [PubMed] [Google Scholar]
- Kawaguchi Y, Kubota Y. Physiological and morphological identification of somatostatin- or vasoactive intestinal polypeptide-containing cells among GABAergic cell subtypes in rat frontal cortex. J Neurosci. 1996;16:2701–2715. doi: 10.1523/JNEUROSCI.16-08-02701.1996. [DOI] [PMC free article] [PubMed] [Google Scholar]
- Keller T, Schneider A, Tutsch-Bauer E. GC/MS determination of zolpidem in postmortem specimens in a voluntary intoxication. Forensic Sci Int. 1999;106:103–108. doi: 10.1016/s0379-0738(99)00185-1. [DOI] [PubMed] [Google Scholar]
- Kole MH, Letzkus JJ, Stuart GJ. Axon initial segment Kv1 channels control axonal action potential waveform and synaptic efficacy. Neuron. 2007;55:633–647. doi: 10.1016/j.neuron.2007.07.031. [DOI] [PubMed] [Google Scholar]
- Kraushaar U, Jonas P. Efficacy and stability of quantal GABA release at a hippocampal interneuron–principal neuron synapse. J Neurosci. 2000;20:5594–5607. doi: 10.1523/JNEUROSCI.20-15-05594.2000. [DOI] [PMC free article] [PubMed] [Google Scholar]
- Kruglikov I, Rudy B. Perisomatic GABA release and thalamocortical integration onto neocortical excitatory cells are regulated by neuromodulators. Neuron. 2008;58:911–924. doi: 10.1016/j.neuron.2008.04.024. [DOI] [PMC free article] [PubMed] [Google Scholar]
- Kulik A, Vida I, Lujan R, Haas CA, Lopez-Bendito G, Shigemoto R, Frotscher M. Subcellular localization of metabotropic GABAB receptor subunits GABAB1a/b and GABAB2 in the rat hippocampus. J Neurosci. 2003;23:11026–11035. doi: 10.1523/JNEUROSCI.23-35-11026.2003. [DOI] [PMC free article] [PubMed] [Google Scholar]
- Kyrozis A, Reichling DB. Perforated-patch recording with gramicidin avoids artifactual changes in intracellular chloride concentration. J Neurosci Methods. 1995;57:27–35. doi: 10.1016/0165-0270(94)00116-x. [DOI] [PubMed] [Google Scholar]
- Lübke J, Markram H, Frotscher M, Sakmann B. Frequency and dendritic distribution of autapses established by layer 5 pyramidal neurons in the developing rat neocortex: comparison with synaptic innervation of adjacent neurons of the same class. J Neurosci. 1996;16:3209–3218. doi: 10.1523/JNEUROSCI.16-10-03209.1996. [DOI] [PMC free article] [PubMed] [Google Scholar]
- McCartney MR, Deeb TZ, Henderson TN, Hales TG. Tonically active GABAA receptors in hippocampal pyramidal neurons exhibit constitutive GABA-independent gating. Mol Pharmacol. 2007;71:539–548. doi: 10.1124/mol.106.028597. [DOI] [PubMed] [Google Scholar]
- Meyer AC, Neher E, Schneggenburger R. Estimation of quantal size and number of functional active zones at the calyx of held synapse by nonstationary EPSC variance analysis. J Neurosci. 2001;21:7889–7900. doi: 10.1523/JNEUROSCI.21-20-07889.2001. [DOI] [PMC free article] [PubMed] [Google Scholar]
- Min MY, Rusakov DA, Kullmann DM. Activation of AMPA, kainate, and metabotropic receptors at hippocampal mossy fibre synapses: role of glutamate diffusion. Neuron. 1998;21:561–570. doi: 10.1016/s0896-6273(00)80566-8. [DOI] [PubMed] [Google Scholar]
- Mori M, Gahwiler BH, Gerber U. β-Alanine and taurine as endogenous agonists at glycine receptors in rat hippocampus in vitro. J Physiol. 2002;539:191–200. doi: 10.1113/jphysiol.2001.013147. [DOI] [PMC free article] [PubMed] [Google Scholar]
- Nusser Z, Hajos N, Somogyi P, Mody I. Increased number of synaptic GABAA receptors underlies potentiation at hippocampal inhibitory synapses. Nature. 1998;395:172–177. doi: 10.1038/25999. [DOI] [PubMed] [Google Scholar]
- Olah S, Fule M, Komlosi G, Varga C, Baldi R, Barzo P, Tamas G. Regulation of cortical microcircuits by unitary GABA-mediated volume transmission. Nature. 2009;461:1278–1281. doi: 10.1038/nature08503. [DOI] [PMC free article] [PubMed] [Google Scholar]
- Oláh S, Komlósi G, Szabadics J, Varga C, Tóth E, Barzo P, Tamás G. Output of neurogliaform cells to various neuron types in the human and rat cerebral cortex. Front Neural Circuits. 2007;1:4. doi: 10.3389/neuro.04.004.2007. [DOI] [PMC free article] [PubMed] [Google Scholar]
- Pawelzik H, Hughes DI, Thomson AM. Modulation of inhibitory autapses and synapses on rat CA1 interneurones by GABAA receptor ligands. J Physiol. 2003;546:701–716. doi: 10.1113/jphysiol.2002.035121. [DOI] [PMC free article] [PubMed] [Google Scholar]
- Perrais D, Ropert N. Effect of zolpidem on miniature IPSCs and occupancy of postsynaptic GABAA receptors in central synapses. J Neurosci. 1999;19:578–588. doi: 10.1523/JNEUROSCI.19-02-00578.1999. [DOI] [PMC free article] [PubMed] [Google Scholar]
- Peters A, Proskauer CC. Smooth or sparsely spined cells with myelinated axons in rat visual cortex. Neuroscience. 1980;5:2079–2092. doi: 10.1016/0306-4522(80)90126-8. [DOI] [PubMed] [Google Scholar]
- Pita-Almenar JD, Collado MS, Colbert CM, Eskin A. Different mechanisms exist for the plasticity of glutamate reuptake during early long-term potentiation (LTP) and late LTP. J Neurosci. 2006;26:10461–10471. doi: 10.1523/JNEUROSCI.2579-06.2006. [DOI] [PMC free article] [PubMed] [Google Scholar]
- Roepstorff A, Lambert JD. Factors contributing to the decay of the stimulus-evoked IPSC in rat hippocampal CA1 neurons. J Neurophysiol. 1994;72:2911–2926. doi: 10.1152/jn.1994.72.6.2911. [DOI] [PubMed] [Google Scholar]
- Rudy B, McBain CJ. Kv3 channels: voltage-gated K+ channels designed for high-frequency repetitive firing. Trends Neurosci. 2001;24:517–526. doi: 10.1016/s0166-2236(00)01892-0. [DOI] [PubMed] [Google Scholar]
- Ruiz M, Egal H, Sarthy V, Qian X, Sarkar HK. Cloning, expression, and localization of a mouse retinal γ-aminobutyric acid transporter. Invest Ophthalmol Vis Sci. 1994;35:4039–4048. [PubMed] [Google Scholar]
- Sanna E, Busonero F, Talani G, Carta M, Massa F, Peis M, Maciocco E, Biggio G. Comparison of the effects of zaleplon, zolpidem, and triazolam at various GABAA receptor subtypes. Eur J Pharmacol. 2002;451:103–110. doi: 10.1016/s0014-2999(02)02191-x. [DOI] [PubMed] [Google Scholar]
- Scanziani M. GABA spillover activates postsynaptic GABAB receptors to control rhythmic hippocampal activity. Neuron. 2000;25:673–681. doi: 10.1016/s0896-6273(00)81069-7. [DOI] [PubMed] [Google Scholar]
- Segal MM. Epileptiform activity in microcultures containing one excitatory hippocampal neuron. J Neurophysiol. 1991;65:761–770. doi: 10.1152/jn.1991.65.4.761. [DOI] [PubMed] [Google Scholar]
- Shi WX, Rayport S. GABA synapses formed in vitro by local axon collaterals of nucleus accumbens neurons. J Neurosci. 1994;14:4548–4560. doi: 10.1523/JNEUROSCI.14-07-04548.1994. [DOI] [PMC free article] [PubMed] [Google Scholar]
- Shivachar AC. Cannabinoids inhibit sodium-dependent, high-affinity excitatory amino acid transport in cultured rat cortical astrocytes. Biochem Pharmacol. 2007;73:2004–2011. doi: 10.1016/j.bcp.2007.03.018. [DOI] [PubMed] [Google Scholar]
- Silver RA, Lubke J, Sakmann B, Feldmeyer D. High-probability uniquantal transmission at excitatory synapses in barrel cortex. Science. 2003;302:1981–1984. doi: 10.1126/science.1087160. [DOI] [PubMed] [Google Scholar]
- Soudijn W, van Wijngaarden I. The GABA transporter and its inhibitors. Curr Med Chem. 2000;7:1063–1079. doi: 10.2174/0929867003374363. [DOI] [PubMed] [Google Scholar]
- Stell BM, Brickley SG, Tang CY, Farrant M, Mody I. Neuroactive steroids reduce neuronal excitability by selectively enhancing tonic inhibition mediated by δ subunit-containing GABAA receptors. Proc Natl Acad Sci U S A. 2003;100:14439–14444. doi: 10.1073/pnas.2435457100. [DOI] [PMC free article] [PubMed] [Google Scholar]
- Szabadics J, Tamas G, Soltesz I. Different transmitter transients underlie presynaptic cell type specificity of GABAA,slow and GABAA,fast. Proc Natl Acad Sci U S A. 2007;104:14831–14836. doi: 10.1073/pnas.0707204104. [DOI] [PMC free article] [PubMed] [Google Scholar]
- Tamas G, Buhl EH, Lorincz A, Somogyi P. Proximally targeted GABAergic synapses and gap junctions synchronize cortical interneurons. Nat Neurosci. 2000;3:366–371. doi: 10.1038/73936. [DOI] [PubMed] [Google Scholar]
- Tamas G, Buhl EH, Somogyi P. Massive autaptic self-innervation of GABAergic neurons in cat visual cortex. J Neurosci. 1997;17:6352–6364. doi: 10.1523/JNEUROSCI.17-16-06352.1997. [DOI] [PMC free article] [PubMed] [Google Scholar]
- Thomson AM, Bannister AP, Hughes DI, Pawelzik H. Differential sensitivity to Zolpidem of IPSPs activated by morphologically identified CA1 interneurons in slices of rat hippocampus. Eur J Neurosci. 2000;12:425–436. doi: 10.1046/j.1460-9568.2000.00915.x. [DOI] [PubMed] [Google Scholar]
- Towers SK, Hestrin S. D1-like dopamine receptor activation modulates GABAergic inhibition but not electrical coupling between neocortical fast-spiking interneurons. J Neurosci. 2008;28:2633–2641. doi: 10.1523/JNEUROSCI.5079-07.2008. [DOI] [PMC free article] [PubMed] [Google Scholar]
- Traub RD, Kopell N, Bibbig A, Buhl EH, LeBeau FE, Whittington MA. Gap junctions between interneuron dendrites can enhance synchrony of gamma oscillations in distributed networks. J Neurosci. 2001;21:9478–9486. doi: 10.1523/JNEUROSCI.21-23-09478.2001. [DOI] [PMC free article] [PubMed] [Google Scholar]
- Ueno S, Bracamontes J, Zorumski C, Weiss DS, Steinbach JH. Bicuculline and gabazine are allosteric inhibitors of channel opening of the GABAA receptor. J Neurosci. 1997;17:625–634. doi: 10.1523/JNEUROSCI.17-02-00625.1997. [DOI] [PMC free article] [PubMed] [Google Scholar]
- Van Der Loos H, Glaser EM. Autapses in neocortex cerebri: synapses between a pyramidal cell's axon and its own dendrites. Brain Res. 1972;48:355–360. doi: 10.1016/0006-8993(72)90189-8. [DOI] [PubMed] [Google Scholar]
- Vida I, Bartos M, Jonas P. Shunting inhibition improves robustness of gamma oscillations in hippocampal interneuron networks by homogenizing firing rates. Neuron. 2006;49:107–117. doi: 10.1016/j.neuron.2005.11.036. [DOI] [PubMed] [Google Scholar]
- Wafford KA, Thompson SA, Thomas D, Sikela J, Wilcox AS, Whiting PJ. Functional characterization of human γ-aminobutyric acidA receptors containing the α4 subunit. Mol Pharmacol. 1996;50:670–678. [PubMed] [Google Scholar]
- Wei W, Zhang N, Peng Z, Houser CR, Mody I. Perisynaptic localization of δ subunit-containing GABAA receptors and their activation by GABA spillover in the mouse dentate gyrus. J Neurosci. 2003;23:10650–10661. doi: 10.1523/JNEUROSCI.23-33-10650.2003. [DOI] [PMC free article] [PubMed] [Google Scholar]
- Wong AY, Graham BP, Billups B, Forsythe ID. Distinguishing between presynaptic and postsynaptic mechanisms of short-term depression during action potential trains. J Neurosci. 2003;23:4868–4877. doi: 10.1523/JNEUROSCI.23-12-04868.2003. [DOI] [PMC free article] [PubMed] [Google Scholar]
- Zucker RS, Regehr WG. Short-term synaptic plasticity. Annu Rev Physiol. 2002;64:355–405. doi: 10.1146/annurev.physiol.64.092501.114547. [DOI] [PubMed] [Google Scholar]
Associated Data
This section collects any data citations, data availability statements, or supplementary materials included in this article.