Abstract
Nerve growth factor (NGF) induces terminal differentiation in PC12, a pheochromocytoma-derived cell line. NGF binds a specific receptor on the membrane and triggers the ERK1/2 cascade, which stimulates the transcription of neural genes. We report that NGF significantly affects mitochondrial metabolism by reducing mitochondrial-produced reactive oxygen species and stabilizing the electrochemical gradient. This is accomplished by stimulation of mitochondrial manganese superoxide dismutase (MnSOD) both transcriptionally and post-transcriptionally via Ki-Ras and ERK1/2. Activation of MnSOD is essential for completion of neuronal differentiation because 1) expression of MnSOD induces the transcription of a neuronal specific promoter and neurite outgrowth, 2) silencing of endogenous MnSOD by small interfering RNA significantly reduces transcription induced by NGF, and 3) a Ki-Ras mutant in the polylysine stretch at the COOH terminus, unable to stimulate MnSOD, fails to induce complete differentiation. Overexpression of MnSOD restores differentiation in cells expressing this mutant. ERK1/2 is also downstream of MnSOD, as a SOD mimetic drug stimulates ERK1/2 with the same kinetics of NGF and silencing of MnSOD reduces NGF-induced late ERK1/2. Long term activation of ERK1/2 by NGF requires SOD activation, low levels of hydrogen peroxide, and the integrity of the microtubular cytoskeleton. Confocal immunofluorescence shows that NGF stimulates the formation of a complex containing membrane-bound Ki-Ras, microtubules, and mitochondria. We propose that active NGF receptor induces association of mitochondria with plasma membrane. Local activation of ERK1/2 by Ki-Ras stimulates mitochondrial SOD, which reduces reactive oxygen species and produces H2O2. Low and spatially restricted levels of H2O2 induce and maintain long term ERK1/2 activity and ultimately differentiation of PC12 cells.
Keywords: Cell Differentiation, ERK, Ras, Reactive Oxygen Species (ROS), Superoxide Dismutase (SOD)
Introduction
Reactive oxygen species (ROS)2 are continuously generated by metabolic reactions in all cellular compartments. Their regulation is crucial for cell survival and differentiation.
We have been studying the biological effects of nerve growth factor (NGF) and Ras on ROS metabolism. Cells expressing Ki-Ras reduce ROS levels and become tolerant to oxidative stress (1, 2). The effects of NGF on ROS are rather peculiar, as it has been shown that NGF increases (3, 4) or reduces (5) cellular ROS.
PC12 cells represent an ideal system to test the link between differentiation and ROS metabolism. These cells undergo terminal differentiation or growth depending on the type of stimulus and the shape of the kinase cascade (6–8). NGF selectively induces long term ERK1/2 activation, which appears essential for complete differentiation. This has been primarily ascribed to differential receptor turnover (7, 9, 10) or the activation scaffold proteins, linking specific tyrosine kinase receptors to the Ras-ERK1/2 cascade (for example CNK2) (11) or differential regulation of MEK phosphatases (for example SHP2–3) (12).
To dissect the molecular link(s) between ROS and neural differentiation, we tested the effects of NGF on mitochondrial metabolism by assaying directly the production of mitochondrial ROS and the mitochondrial electrochemical gradient. We also analyzed mitochondrial proteins stimulated by NGF during differentiation.
We find that NGF reduces the production of mitochondrial ROS and improves the proton mitochondrial gradient. This is accomplished by stimulation of MnSOD. H2O2, generated by MnSOD, sustains long term ERK1/2 signaling triggered by NGF. NGF stimulates the formation of a complex involving cell membrane, microtubular cytoskeleton, and mitochondria. These data unravel a novel function of NGF and support the notion that the species and the location of ROS determine the shape of the kinase cascade and the ultimate phenotype of the cell.
EXPERIMENTAL PROCEDURES
Materials and Antibodies
Mn(III) tetrakis(1-methyl-4-pyridyl)porphyrin pentachloride (MnTMpyP), a cell-permeable superoxide dismutase mimetic, was obtained from Calbiochem. U0126 was from Promega Corp. (Madison, WI). 2-Phenyl-1,2-benzisoselenazol-3(H2)-one (Ebselen) (an organoselenium compound), glutathione peroxidase mimetic (a peroxide scavenger), and nocodazole (an inhibitor of microtubule polymerization) were purchased from Sigma. RPMI 1640 medium was obtained from Invitrogen. Epidermal growth factor (EGF), mouse NGF, and anti-MnSOD rabbit polyclonal antibodies were from Upstate Biotechnology (Lake Placid, NY). Anti-p-ERK1/2 (mouse monoclonal antibody), anti-ERK1/2 (rabbit polyclonal antibody), voltage-dependent anion channel 1, goat polyclonal antibodies, anti-Ki-Ras (mouse monoclonal antibody), anti-Ha-Ras (rabbit polyclonal antibody), and anti-cFos goat polyclonal antibodies were from Santa Cruz Biotechnology. Anti-phosphoserine (rabbit polyclonal antibody) was from Zymed Laboratories Inc. Anti-MnSOD (mouse monoclonal antibody) was from Bender MedSystem (Vienna, Austria). Peroxidase-conjugate anti-rabbit or anti-mouse IgGs were obtained from Amersham Biosciences. The antibodies were used according to the protocol provided by the supplier.
Cell Lines
PC12 cells (13) were maintained in RPMI medium containing 5% fetal calf serum, 10% horse serum, and glutamine (1 mm) in flasks pre-coated with collagen. HEK293 cells were grown in Dulbecco's modified Eagle's medium containing 5% fetal calf serum and supplemented with glutamine.
Plasmids and DNA Transfection
The plasmids used were 1) bicistronic vectors (pIRES) expressing Ha-Ras (Val-12), Ki-Ras (Val-12), and green fluorescent protein (GFP) genes under the control of the cytomegalovirus (CMV) promoter (1); 2) Ki-Ras (Val-12) mutants in the cysteine of the CAAX box and the polybasic region previously described (1, 2); 3) Ki-Ras4B (wild type), including 100 nucleotides from the 3′-untranslated region (K-100); 4) pNGF1-A-CAT, containing sequences from −1150 to +200 bp relative to the NGF1-A transcription start site (14) fused to the CAT gene (kindly provided by A. Levi, Institute of Neurobiology, CNR, Rome, Italy); 5) wild type rat MnSOD (accession number NM_017051), cloned in pcDNA 3.0 and MnSOD S82A mutant, generated by using the QuikChange site-directed mutagenesis kit (Stratagene, La Jolla, CA) (the primers used for rat MnSOD Ser82Ala mutagenesis were forward (5′-ACAAACCTGGCCCCTAAGGGT-3′) and reverse (5′-ACCCTTAGGGGCCAGGTTTGT-3′)); 6) wild type Ki-Ras4B and Ki-Ras mutants fused to the COOH terminus of enhanced cyan fluorescent protein (ECFP).3 To obtain the constructs expressing the protein chimera ECFP:Ki-Ras4B and the Cys− and Lys− mutants, the ECFP coding sequence was amplified by PCR from the pECFP-N1 (Invitrogen) and subcloned in pcDNA 3.1 vector. The Ki-Ras4B (GenBankTM accession number AF493917) and the Cys− and Lys− mutants, derived from the plasmids described above, were fused in-frame with the 3′ end of the ECFP (pECFP/Ki-Ras). Two extra amino acid residues, Gly-Ser, link the ECFP COOH-terminal amino acid residue with the first Ki-Ras4B NH2-terminal amino acid residue. All plasmid constructs were sequenced to confirm the predicted amino acid sequence.
Transient transfections were performed with Lipofectamine reagent (Invitrogen) according to the protocol indicated by the supplier. 48 or 72 h after transfection the cells were analyzed by fluorescence microscopy or by immunoblot. The amount of DNA of each plasmid vector for a 60-mm dish was: GFP, 5 μg; NGF1A-CAT, 5 μg; RSVLacZ, 3 μg; MnSOD wild type, 4 μg; MnSOD S82A, 4 μg. β-Galactosidase activity was used to normalize the transfection efficiency. For immunofluorescence analysis the cells were plated on poly-l-lysine-coated glass coverslips 16 h before transfection. The ECFP Ki-Ras4B expression constructs were introduced into PC12 cells and induced for 3 days with NGF 100 ng/ml. Transfection of siRNAs was carried out by microporation (MicroPorator MP-100, DigitalBio). The experimental conditions were optimized for PC12 cells: voltage 1200, width 30, 1 pulse. siRNAs were obtained from Dharmacon (ON-TARGETplus) (LaFayette, CO). We independently transfected four siRNAs and tested MnSOD knockdown by immunoblot. As controls were used “non-targeting” (NT) scrambled siRNAs. In all experiments two siRNAs were used at a final concentration of 100 nm. The specific sequences were 5′-GCGCUGGAGCCGCACAUUA-3′ and 5′-GAGCAAGGUCGCUUACAGA-3′. 68 h after the transfection the cells were serum-deprived for 4 h and induced with EGF or NGF for 15 min and 3 h, respectively.
Neurite outgrowth assay was carried out by scoring the number of neurites in cells expressing wild type CMV-GFP. A neurite was identified as a process whose length was 1.5 times the cell body. 200 cells were counted for each plate, and the percentage of cells with neurites was calculated as described (6).
CAT Activity was assayed as described (15). Enzymatic assays were performed with extracts containing equivalent units of β-galactosidase (0.1–0.2 unit/sample) (1 unit is the absorbance at 420 nm of the cell lysate incubated with 1 mg/ml 2 nitrophenyl-d-galactopyranoside transferase at 37 °C 1 h). Experiments showing variations in β-galactosidase activity more than 2-fold were eliminated.
Fluorescence Microscopy and Flow Cytometry
Mitochondria were stained with Mitotracker Red CM-H2XRos at 19 nm final concentration (Molecular Probes) for 20 min at 37 °C. Subsequently, cells were washed with medium and incubated at 37 °C for further 20 min. Cell fixation and immunofluorescence staining were performed as previously described (16). Nuclei were stained with 10 μg/ml Hoechst 33258 (Molecular Probes, CA) in PBS. Coverslips were mounted with Gel/Mount (Biomeda Corp., Foster City, CA). Mouse Anti-α-tubulin monoclonal antibody (from Sigma) was diluted to 10 μg/ml.
Oregon Green 514-conjugated secondary goat anti-mouse antibodies were purchased from Molecular Probes (Invitrogen). Fluorescence filter sets were: 49 Carl Zeiss (Gottingen, Germany) for excitation and detection of Hoechst 33258, XF114–2 Omega Optical Inc. (Brattleboro,VT) for excitation and detection of ECFP, and XF104–2 (Omega Optical, Inc.) for excitation and detection of Oregon Green 514 and XF102–2 (Omega Optical, Inc.) for excitation and detection of Mitotracker Red. For fluorescence analysis, an Axiovert 200-M-Carl Zeiss microscope equipped with an ApoTome slider was used. Image processing was performed using an AxioCam HRCCD camera and the AxioVision 4.1 software (Carl Zeiss, Gottingen, Germany).
The superoxide indicator MitoSOX Red (Molecular Probes, Invitrogen) was used at a final concentration of 5 μm, incubated for 10 min at 37 °C, and washed 2 times with PBS. After fixation, the cells were permeabilized with Triton X-100 0.2% in PBS for 3 min, washed in 1× PBS, and treated with DRAQ5 (Biostatus Ltd, Leicester, UK) for 15 min to selectively stain the nuclei. After the final wash, the coverslips were mounted on a microscope slide and examined with a Zeiss 510 Meta confocal laser-scanning microscope. For fluorescence-activated cell sorter analysis, the cells were induced as described above.
Mitochondrial membrane potential was assessed by flow cytometry using tetramethylrhodamine ethyl ester (TMRE, Molecular Probes, Invitrogen), a cell-permeant, cationic, red-orange fluorescent dye selectively sequestered by mitochondria. The cells were serum-deprived for 4 h, induced for 30 min and 3 h with NGF at 100 ng/ml, washed with RPMI, and incubated with 50 nm TMRE for 20 min in the dark at 37 °C. At the end of incubation, the cells were washed and re-suspended in the flow analysis buffer (1× PBS), and kept on ice until the analysis.
Cell Extracts, Immunoprecipitation, and Immunoblot Analysis
Lysates were prepared by dissolving the cell pellet in cold radioimmune precipitation assay buffer (50 mm Tris-HCl, pH 7.5, 150 mm NaCl 1% Nonidet P-40, 0.5% deoxycholate, 0.1% SDS, and a mixture of protease and phosphatase inhibitors) for 15 min. The lysate was centrifuged at 10,000 × g for 10 min; the supernatant was collected and analyzed by Western blot with specific antibodies. Crude mitochondrial fraction was prepared as described (17, 18). The cell lysate (1 mg) was subjected to immunoprecipitation at 4 °C overnight with the indicated antibodies; 20 μl of protein A/G-plus agarose were added, and the mixture was incubated at 4 °C on a rocker platform for 1 h. Immunoprecipitates were collected by centrifugation at 1000 × g for 5 min at 4 °C; the pellet was washed 4 times with 1 ml of radioimmune precipitation assay buffer and, after the final wash was re-suspended in 40 μl of 1× electrophoresis sample buffer, heated to 95 °C for 5 min, and resolved on a SDS 12% polyacrylamide gel. Chemiluminescent signals were quantified by densitometry.
RNA Analysis
Total RNA was extracted from serum-starved cells induced with NGF using the TRIzol reagent (Invitrogen) according to the supplier's instructions. 1 μg of total RNA was used to synthesize the first strand cDNA with TaqDNA polymerase (Roche Diagnostics) according to the protocol provided by the supplier. 2 μl of cDNA and 10 pmol of MnSOD and actin primers were added in a final volume of 50 μl of PCR mixture (final concentrations, 1× PCR buffer, 0.2 mm deoxy-NTP, 1.5 mm MgCl2, and 1.25 units of Taq DNA polymerase). The reaction was carried out in the Gene Amp PCR System 9600. The experimental conditions were selected for each set of primers in the linear range of the reaction in terms of number of cycles and cDNA concentration. Furthermore, each set of reactions included the negative control without reverse transcriptase and a reference marker (rat β actin or glyceraldehyde-3-phosphate dehydrogenase).
Actin primers were: actin forward (5′-GATCATTGCTCCTCCTGAGC-3′) and actin reverse (5′-AAAGCCATGCCAATCTCATC-3′). Rat MnSOD primers were MnSOD forward (5′-GGCCAAGGGAGATGTTACAA-3′) and MnSOD reverse (5′-ACACATCAATCCCCAGCAGT-3′) (Invitrogen). At the end of the reaction 20 μl of the PCR products were loaded on 1.5% agarose gels, and the bands corresponding to the amplified products were detected and quantified by densitometry.
Manganese Superoxide Dismutase Activity
Cells from two 100-mm dishes were collected, washed 3 times with PBS, re-suspended in 200 μl of PBS, disrupted by sonication (2 × 10-s pulses), and centrifuged at 12,500 × g for 30 min at 4 °C. The supernatants were incubated 60 °C for 30 min before the assay to eliminate CuZn-SOD activity. MnSOD activity was determined by the cytochrome c xanthine/xanthine oxidase method using 50 mm HEPES, 0.1 mm EDTA, pH 7.4, containing 1 mm KCN to inhibit CuZn-SOD activity (19).
Statistical Analysis
All data are presented as the means ± S.E. of three experiments in triplicate. Statistical significance was determined using the matched pairs test. Student's t test was performed for each pair of data separately. Significance with a p < 0.05 is reported.
RESULTS
Regulation of Cellular and Mitochondrial ROS Levels by NGF and Ras
The regulation of ROS levels during differentiation of PC12 cells has been matter of intensive investigation. There are reports indicating that ROS levels increase (3, 4) or are substantially reduced after NGF exposure (5). To clarify this issue, we measured the mitochondrial ROS levels, the mitochondrial membrane potential, and the activity of MnSOD, a key enzyme buffering mitochondrial superoxide, in PC12 cells exposed to NGF.
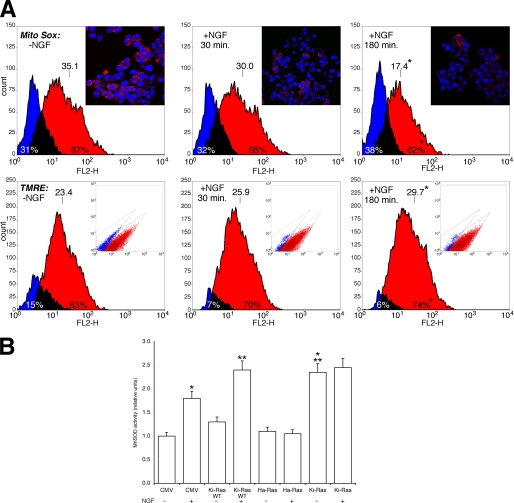
Mitochondrial ROS levels were determined by measuring the fluorescence of mitosox, the red mitochondrial superoxide indicator. Fig. 1A, upper panel, shows that NGF at 180 min significantly reduces mitochondrial ROS. Lower mitochondrial ROS levels indicate that dissipation of the mitochondrial electrochemical gradient is reduced and the respiration is more efficient in the presence of NGF. To test this notion, we measured the electrochemical mitochondrial gradient by assaying the fluorescence of TMRE, a potentiometric dye, sequestered by mitochondria. Fig. 1A, lower panel, shows that NGF at 180 min significantly stimulates TMRE fluorescence. This indicates that the electrochemical gradient is steeper and the respiration more efficient in the presence of NGF.
FIGURE 1.
A, NGF reduces mitochondrial ROS levels and stabilizes the proton gradient in PC12 cells. Upper panel, ROS levels were determined by MitoSOX fluorescence in cells treated with NGF at (100 ng/ml) for 30 and 180 min as indicated. The histogram was obtained by overlapping the regions identified by bivariate analysis. Overlay plots are shown, where blue and red colors indicate the negative and positive cells, respectively. The number of cells and the intensity of the fluorescence are shown on the ordinate and abscissa, respectively. The inset shows representative micrographs of the same cells stained with the specific nuclear dye DRAQ 5 (see “Experimental Procedures”). Lower panel, the mitochondrial proton gradient was measured by TMRE fluorescence-activated cell sorter analysis. Overlay plots are shown, where blue and red indicate the negative and positive cells, respectively. The inset shows the different populations of the cells identified by bivariate analysis. Overlay plots are shown, where blue and red colors indicate the negative and positive cells, respectively. *, p < 0.01 relative to cells without NGF. B, MnSOD activity in Ha and Ki-Ras-expressing cells is shown. Cells were transfected with expression vectors carrying the empty CMV vector, wild type Ki-Ras4B, Ha-Ras (Val-12), Ki-Ras (Val-12), described under “Experimental Procedures.” 48 h later cells were induced with NGF (100 ng/ml) for 30 min as indicated. MnSOD activity was carried out as described under “Experimental Procedures.”. Values, normalized to the transfection efficiency (RSV-LacZ), represent the means ± S.E. derived from at least three independent experiments performed in triplicate. *, p < 0.01 relative to untreated cells transfected with CMV. **, p < 0.02 relative to cells transfected with CMV and treated with NGF. ***, p < 0.01 relative to untreated cells expressing Ki-Ras wild type (WT).
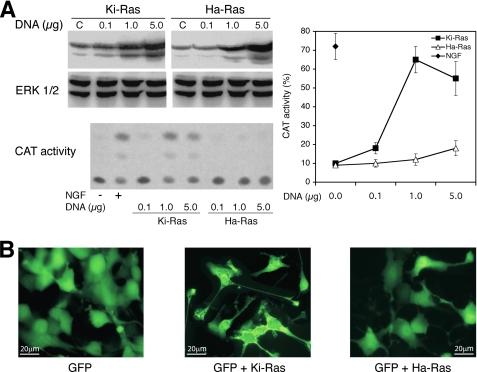
Because MnSOD is the main mitochondrial enzyme scavenging superoxide, we directly measured the activity of the enzyme in NGF-induced cells. Fig. 1B shows that NGF stimulates MnSOD activity and Ki-Ras amplifies MnSOD stimulation by NGF. Under the same conditions, EGF, Ha-Ras wild type, or Ha-Ras Val-12 do not influence the activity of the enzyme (data not shown). Conversely, constitutively active Ki-Ras stimulates MnSOD in the absence of NGF (Fig. 1B). If MnSOD is an important target of NGF and Ki-Ras-induced differentiation, Ki-Ras should be more efficient in the induction of differentiation of PC12 cell compared with the Ha-Ras isoform, which fails to stimulate MnSOD (Fig. 1B). To this end we tested the specific biological activity of Ha- and Ki-Ras by measuring the neural specific transcription (NGF1A) in cells expressing similar levels of Ki- and Ha-Ras V12 proteins. Fig. 2A shows that Ki-Ras is more efficient that Ha-Ras in stimulating transcription of NGF1A. Ki-Ras is also more efficient than Ha-Ras in stimulating morphological differentiation, measured by neurite outgrowth (Fig. 2B).
FIGURE 2.
Ha-Ras and Ki-Ras effects on PC12 differentiation. A, induction of NGF1A promoter transcription by Ki- and Ha-Ras is shown. PC12 cells were transfected with control vector, NGF1A promoter fused to CAT, and Ki- or Ha-Ras (Val-12) expression vectors. 40 h later the cells were serum-starved for 5 h and treated 4 h with 100 ng/ml NGF. The left upper panel shows the immunoblot with Ha- and Ki-Ras-specific antibodies of extracts derived from cells transfected with various concentrations of Ha- or Ki-Ras expression vectors. The left lower panel shows a representative CAT assay, where the lower and the upper spots indicate the input chloramphenicol and the acetylated products, respectively. The right panel shows the CAT activity (% of acetylated chloramphenicol) normalized to the transfection efficiency (β-galactosidase activity). The values shown represent the means ± S.E., derived from at least three independent experiments performed in triplicate. Total p-ERK and GTP binding activity were comparable in cells transfected with 1 and 5 μg/dish DNA of both Ras vectors. B, neurite outgrowth in cells expressing Ha- or Ki-Ras is shown. Ha- and Ki-Ras expression vectors contain the internal ribosome entry site of the encephalomyocarditis virus upstream of the GFP gene (“Experimental Procedures”) and express co-translationally GFP. Cells transfected, as described in A, were analyzed by fluorescence microscopy 72 h later. Specifically, neurites were scored in 200 cells GFP+: control, 4 ± 1.78%; Ki-Ras, 40 ± 9.13%; Ha-Ras 15 ± 5.61%. For each experiment the p value of the χ2 was <0.001; across the experiment the p values of the t tests were: Ki-Ras versus control, p < 0.0001; Ha-Ras versus control, p = 0.0011; Ki-Ras versus Ha-Ras, p < 0.0001.
NGF and Ki-Ras Stimulate Mitochondrial SOD by Multiple Pathways
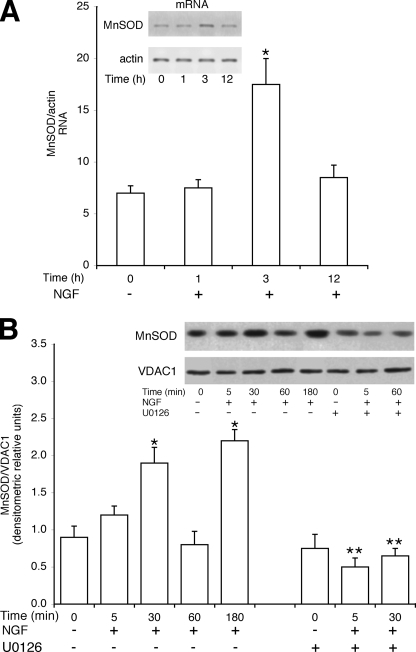
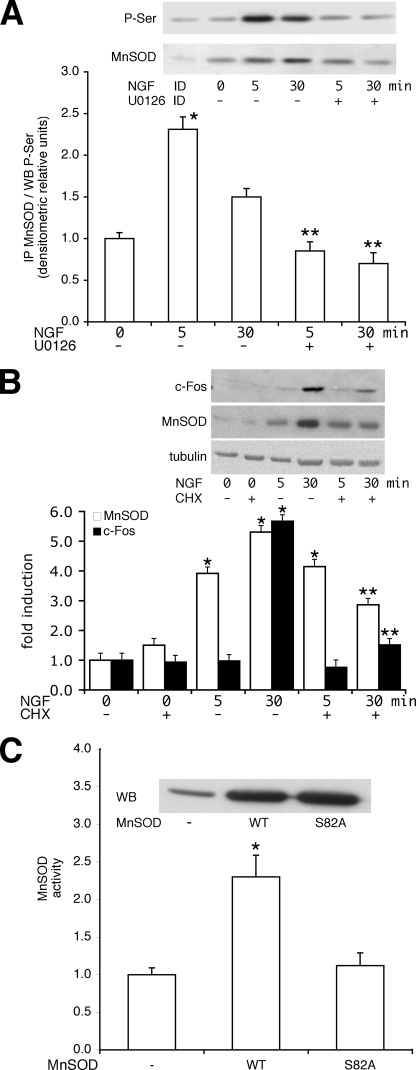
The higher specific activity of Ki-Ras in the induction of PC12 differentiation may be linked with the selective ability of Ki-Ras to stimulate mitochondrial SOD (Fig. 1). To this end we analyzed the mechanism of NGF and Ki-Ras induction of MnSOD. We stimulated PC12 cells with NGF and determined MnSOD protein and mRNA levels. Fig. 3A shows that the levels of MnSOD mRNA are stimulated by 3 h of NGF treatment. However, MnSOD protein levels display 2 peaks at 30 and 180 min after NGF stimulation (Fig. 3B). The early NGF effect on MnSOD levels appears to be post-transcriptional, whereas the late induction (3 h) is mediated by an increase of mRNA levels (Fig. 3A). To investigate the early induction of the enzyme and to find a link between NGF-induced ERK1/2 and MnSOD, we pretreated the cells with U0126, the specific MEK inhibitor. Fig. 3B shows that NGF induction of SOD at 30 min is inhibited by U0126. To analyze a possible post-translational modification of the enzyme, we measured the phosphorylation of MnSOD by challenging MnSOD immunoprecipitates with anti-phosphoserine antibodies (P-Ser). Fig. 4A shows that 1) MnSOD contains phosphorylated serine(s) after 5 and 30 min of NGF stimulation, and 2) treatment of the cells with the MEK inhibitor (U0126) reduces significantly the serine-phosphorylated band (Fig. 4A).
FIGURE 3.
NGF stimulates mitochondrial SOD. A, NGF induces MnSOD mRNA. PC12 cells were stimulated 1, 3, and 12 h with NGF (100 ng/ml), and total RNA was extracted and reverse-transcribed in cDNA as described under “Experimental Procedures.” Specific primers corresponding to rat MnSOD were used to amplify the specific SOD mRNA. The amount of the specific RNA band was linearly dependent on the concentration of cDNA and number of cycles. Values are the means ± S.E. derived from at least three experiments performed in triplicate. A representative experiment is shown in the inset. *, p < 0.01 relative to untreated cells. B, NGF stimulates mitochondrial MnSOD protein levels. PC12 cells were treated with 100 ng/ml NGF for the periods indicated. UO126 (10 μm) was added 15 min before NGF challenge. The mitochondrial fraction was prepared as described under “Experimental Procedures.” 30 μg of proteins were immunoblotted with anti-MnSOD and voltage-dependent anion channel 1 (VDAC1, a specific mitochondrial marker). Values are the means ± S.E. derived from at least three experiments, performed in triplicate. *, p < 0.01 relative to untreated cells. **, p < 0.01 relative to cells stimulated with NGF for 5 and 30 min without U0126.
FIGURE 4.
Post-transcriptional regulation of mitochondrial SOD by NGF. A, NGF induces phosphorylation of MnSOD. Extracts (1 mg) derived from PC12 cells and induced for 5 and 30 min by NGF or pretreated with the MEK inhibitor U0126 (10 μm) were immunoprecipitated with the anti-MnSOD mouse monoclonal antibody. The immunoprecipitate (IP), fractionated on an SDS-polyacrylamide gel, was challenged with anti-phosphoserine (P-Ser) rabbit polyclonal antibodies or anti-MnSOD rabbit polyclonal antibodies (see “Experimental Procedures”). The histogram shows the densitometric analysis of MnSOD serine-phosphorylated band relative to control protein in untreated cells. The inset panel shows a representative blot (WB) with anti-phosphoserine or anti-MnSOD antibodies. ID indicates MnSOD-immunodepleted extracts from 30 min NGF-treated cells. *, p < 0.01 relative to untreated cells. **, p < 0.01 relative to cells stimulated with NGF for 5 and 30 min, respectively. B, shown is the effect of inhibition of protein synthesis on NGF-induced MnSOD. 50 μg of extracts, derived from PC12 cells, were challenged for 5 and 30 min with NGF in the presence or absence of cycloheximide (CHX, 10 μg/ml). The cells were starved from serum for 4 h, and the cycloheximide was added 30 min before NGF treatment. The immunoblot of total cell protein was carried out with antibodies specific to human c-Fos (goat) and MnSOD. A representative experiment is shown in the inset. *, p < 0.01 relative to untreated cells. **, p < 0.01 relative to cells stimulated with NGF for 30 min without cycloheximide. C, mitochondrial SOD activity of wild type or the serine/alanine 82 mutant is shown. Cells (HEK293, PC12, and HeLa) were transiently transfected with control vector, wild type, or alanine (S82A) MnSOD mutant expression vectors. Cell extracts were prepared and assayed for MnSOD activity as described under “Experimental Procedures.” The results were comparable in the three cell lines indicated. The inset shows the levels of MnSOD in HEK293 transfected with the wild type or S82A MnSOD proteins. The histogram shows the enzymatic activity of wild type (WT) and MnSOD mutant HEK293-expressing cells normalized to the transfection efficiency. *, p < 0.01 relative to control cells.
To dissect the mechanism of NGF induction of MnSOD, we stimulated the cells for 5 and 30 min with NGF in the presence or absence of the translation inhibitor cycloheximide. Note that in this time frame (30 min) the levels of MnSOD mRNA do not change after NGF stimulation. Inhibition of translation does not prevent MnSOD induction by NGF at 5 min, whereas it inhibits MnSOD accumulation at 30 min. NGF also induces c-Fos at 30 min. Induction of c-Fos and MnSOD at 30 min by NGF requires active translation, as cycloheximide inhibits the accumulation of both proteins in cells exposed 30 min to NGF (Fig. 4B). These data suggest that NGF at 5 min alters the stability of the MnSOD protein, whereas at 30 min NGF stimulates the translation of the specific mRNA.
To identify the site in the protein phosphorylated by ERK1/2, we mutagenized a serine residue located in position 82 of the rat MnSOD sequence. This serine, adjacent to a proline (Ser-Pro), is a potential ERK1/2 substrate and is present only once in the rodent sequences. The MnSOD protein, mutated in this serine and overexpressed in HEK293 or PC12 cells, does not increase the activity after NGF stimulation (Fig. 4C). Extensive biochemical analysis of the protein indicates that this mutation abolishes phosphorylation of the enzyme in vitro by purified ERK2 (supplemental Fig. 1S) and does not affect the homotetrameric assembly and the activity of the endogenous enzyme (20).
We suggest that ERK1/2, activated by NGF, induces the phosphorylation of serine 82 in the nascent mitochondrial SOD protein. This modification may contribute to stabilization of the enzyme (Fig. 4, A and B).
MnSOD Mediates and Maintains NGF and Ki-Ras Long Term Activation of ERK1/2
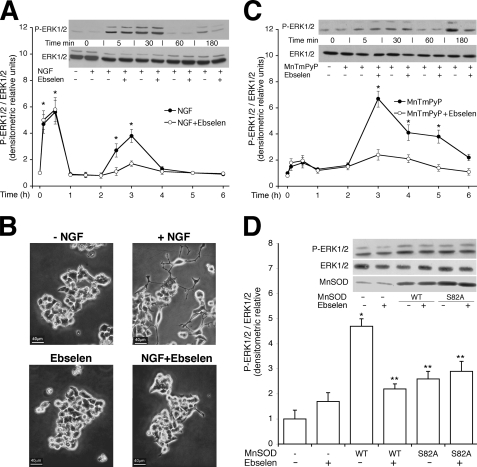
If activation of MnSOD is important for differentiation of PC12 cells, inhibition of its activity should prevent or reduce differentiation. Chemical inhibition of MnSOD is not feasible because it leads to mitochondrial dysfunction. We decided to reduce the levels of hydrogen peroxide, the product of SOD reaction, with a specific peroxide scavenger, ebselen (21). We treated the cells with this drug and measured NGF-induced ERK1/2 activity. Fig. 5A shows that ERK1/2 is induced rapidly by NGF treatment (5–30 min) and slowly decays (1–2 h) (22, 23). Our analysis also shows the presence of a second peak of active ERK1/2 (3 h) stimulated by NGF (Fig. 5A) Pretreatment of the cells with ebselen in the presence of NGF for various periods, abrogates only the late ERK1/2 activation by NGF and does not influence the early peak (Fig. 5A). This late-activated ERK1/2 seems important for differentiation because 1) long term treatment with ebselen inhibits morphological differentiation, assessed by neurite outgrowth (Fig. 5B) and 2) treatment of the cells with a SOD mimetic, MnTMPyP, (24) stimulates ERK1/2 after 3 h of continuous exposure (Fig. 5C). Unexpectedly, we find that the late p-ERK1/2 peak is stimulated by peroxide, as it is inhibited by ebselen. To rule out nonspecific effects induced by ebselen, we treated the cells stimulated with NGF with purified catalase or we transfected the same cells with an expression vector encoding rat catalase. In both experiments catalase inhibited selectively the late peak of NGF-induced ERK1/2 (supplemental Fig. 2S).
FIGURE 5.
MnSOD influences NGF-induced ERK1/2 activity. A, a peroxide scavenger abolishes long term ERK1/2 stimulation by NGF. The time-course of ERK1/2 induction by NGF is shown. PC12 cells were treated with NGF (100 ng/ml) for the times indicated in the absence or presence of the peroxide scavenger (ebselen 20 μm for 30 min). 50 μg of proteins were immunoblotted with anti-p-ERK1/2. The values shown in the histogram represent the means ± S.E. derived from of at least three experiments performed in triplicate. The inset shows a representative experiment. *, p < 0.01 relative to untreated cells. B, a peroxide scavenger inhibits neurite outgrowth induced by NGF. The same cells indicated in A were plated in the presence of NGF for 5 days in the presence or absence of 20 μm ebselen. Viability of the cells, measured by fluorescence-activated cell sorter, was not affected under these conditions. Neurite outgrowth was measured as described under “Experimental Procedures” except that neurites whose length was 0.5 and 1 times the cell body were also measured. 200 cells were counted for each plate, and the percentage of cells with neurites was calculated as described (6). Control, 6 ± 2%: +NGF, 75 ± 10%; +NGF-Ebselen 25 ± 10%; NGF versus control, p < 0.001; NGF versus ebselen + NGF, p < 0.02. The experiment was performed in triplicate. The viability of cells treated with 20 μm ebselen for 5 days was not significantly different from control cells, assayed by cytofluorimetry. C, long term ERK1/2 stimulation by SOD mimetic drugs is shown. Time-course of ERK1/2 induction by MnTMPyP (100 μm), a SOD mimetic drug is shown. PC12 cells were treated with MnTPyP for the times indicated in the absence or presence of ebselen (20 μm for 30 min). ERK1/2 activation was assayed by immunoblot with specific antibodies anti-p-ERK1/2. Values represent the means ± S.E. of at least three experiments performed in triplicate (lower panel). A representative experiment is shown in the upper panel. *, p < 0.01 relative to untreated cells. D, MnSOD stimulates ERK1/2. Several cell lines (HEK293, PC12, HeLa) were transfected with control vector, wild type (WT), and mutant (S82A) MnSOD expression vectors. 24 h later the cells were serum-deprived for 18 h and incubated in the presence of 20 μm ebselen for 3 h. Total extracts were prepared as described under “Experimental Procedures,” and 50 μg of proteins were immunoblotted with anti-p-ERK1/2 and anti-MnSOD antibodies. The values shown in the histogram are the means ± S.E. of at least three experiments, performed in triplicate. A representative experiment performed in HEK293 cells is shown in the upper panel. *, p < 0.01 relative to untreated control cells; **, p < 0.01 relative to untreated cells expressing wild type MnSOD.
Together these data suggest that low levels of hydrogen peroxide produced by mitochondrial SOD may be responsible for late ERK1/2 activation (3 h) by NGF (7). To determine whether this is the case, we expressed wild type or the inactive version of MnSOD (S82A) and determined the levels of active ERK1/2 in the presence or absence of ebselen. We find that 1) expression of wild type SOD, not the serine 82 mutant, stimulates p-ERK1/2 levels, and 2) late activation of ERK1/2 is inhibited by the peroxide scavenger (Fig. 5D). These data establish a link between MnSOD and ERK1/2 activation mediated by hydrogen peroxide. This circuitry probably favors the adaptation of the cell during differentiation to the higher metabolic rate (25). Higher respiration rate increases superoxide, which is converted by SOD to hydrogen peroxide. H2O2 rapidly diffuses and activates local ERK1/2 (26). Mitochondrial SOD appears to be a perfect sensor of superoxide and hydrogen peroxide. The half-life of superoxide at a low concentration (0.1 nm) is quite long (14 h) (27). MnSOD removes mitochondrial-derived superoxide at near-diffusion limiting rates. Under NGF stimulus hydrogen peroxide maintains active ERK1/2 (26) and supports the phosphorylation of several targets (28). MnSOD and catalase or peroxidase(s) are able to confine and maintain the levels of superoxide and hydrogen peroxide sufficient to reduce the turnover of local pERK1/2. Higher levels of H2O2 inhibit SOD, increase superoxide, and induce apoptosis (29). Mitochondria are the relevant sites where ROS are originated, and the balance between superoxide and peroxide is carefully controlled. Other cell compartments (membrane, cytoskeleton, and nucleus) can be influenced and modified by the shape and intensity of the ROS-ERK1/2 stimulus originated in the mitochondria.
MnSOD Cooperates with Ki-Ras to Induce and Maintain Terminal Differentiation
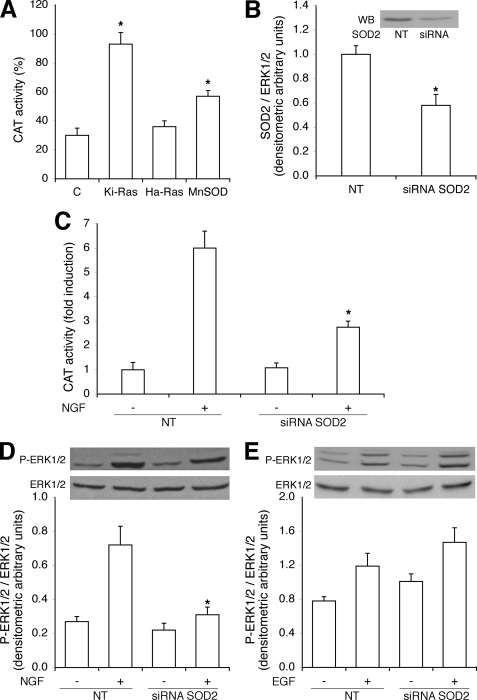
To determine the effects of MnSOD on PC12 differentiation, we transfected PC12 cells with an expression vector encoding rat MnSOD and measured NGF1A promoter transcription by a CAT assay. Fig. 6A shows that expression of MnSOD significantly induces NGF1A-CAT transcription, albeit less efficiently than Ki-Ras. To demonstrate that MnSOD is important for neural-induced transcription by NGF, we selectively knocked down MnSOD and analyzed the transcription of NGF1A and the levels of pERK1/2 in the presence of NGF. Figs. 6, B–D, show that silencing of MnSOD reduces NGF1A transcription and inhibits NGF-induced pERK1/2 (Fig. 6D and supplemental 3S). Conversely, silencing of MnSOD does not influence EGF-induced ERK1/2 (Fig. 6E). Under the conditions of these experiments (48 and 72 h) the cells with low MnSOD levels do not show significant changes in viability or growth (data not shown).
FIGURE 6.
MnSOD silencing impairs NGF-induced differentiation. A, MnSOD stimulates transcription of NFG1A promoter. CAT assay in cells transfected with Ki-Ras (2.5 μg), Ha-Ras (5 μg), and MnSOD (1 μg/3 ml/60 mm dish) expression vectors, normalized to the transfection efficiency, as described in “Experimental Procedures.” Values represent the means ± S.E. of at least three experiments performed in triplicate. *, p < 0.01 relative to control cells. B–E, MnSOD knockdown reduces NGF1A promoter transcription and ERK1/2 stimulation by NGF, not by EGF. Cells were transfected by electroporation with siRNA to MnSOD (siRNA SOD2) and control and scrambled siRNA (NT) as described under “Experimental Procedures.” 72 h later total proteins were extracted and subjected to the specific assays as indicated under “Experimental Procedures.” Values indicate the means ± S.E. derived from at least three experiments performed in triplicate. B, the upper panel shows a representative immunoblot (WB) with anti-MnSOD antibodies. *, p < 0.01 relative to cells transfected with NT. C, transcription of NGF1A promoter in the presence or absence of NGF is shown. D and E, ERK1/2 immunoblot in control or MnSOD silenced cells challenged with NGF (100 ng/ml, 3 h) or EGF (100 ng/ml 15 min) is shown. Values represent the means ± S.E. of at least three experiments performed in triplicate. In panels C and D, *, p < 0.01 relative to NGF treated cells transfected with NT.
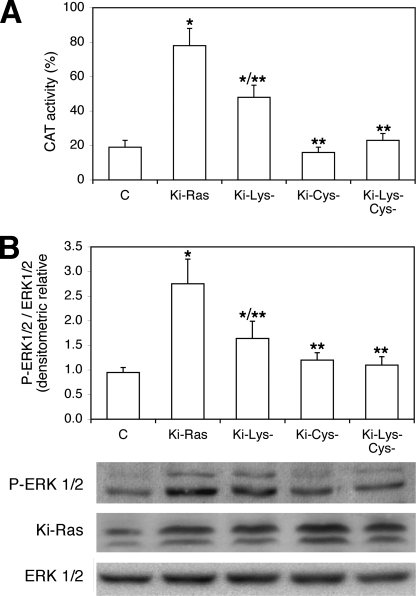
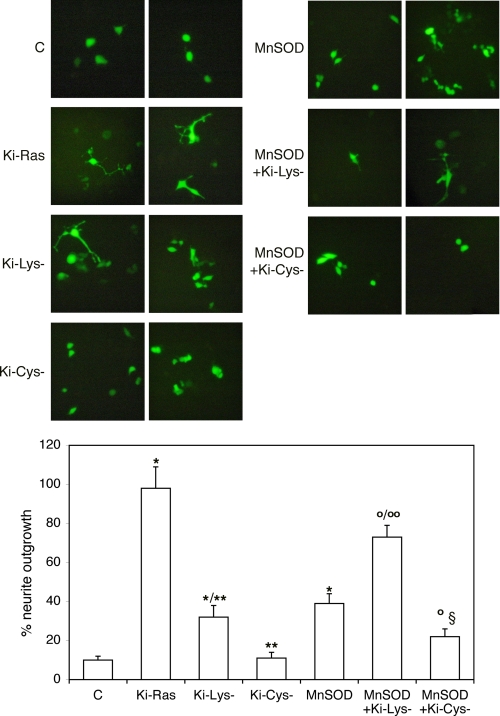
These data indicate that MnSOD mediates NGF effects on transcription of a neural specific promoter with a mechanism involving production of hydrogen peroxide and ERK1/2 activation (Figs. 5 and 6). To find a molecular link between MnSOD- and Ras-induced differentiation, we first tested the ability of various Ki-Ras (Val-12) mutants to stimulate NGF1A transcription. We expressed several Ki-Ras mutants in the COOH hypervariable region (1, 2). Specifically, we expressed a mutant in the cysteine residue of the CAAX box and a mutant in the polylysine stretch of the COOH terminus of Ki-Ras. The CAAX box mutant (Cys−) does not stimulate ERK1/2-dependent transcription, whereas the lysine (Lys−) mutant retains some activity (40–50%) on ERK1/2-induced transcription (Fig. 7, A and B). We tested the ability of these mutants to stimulate neuronal differentiation by measuring neurite outgrowth. Fig. 8 shows that 1) the Cys− mutant fails to induce terminal differentiation, 2) the Lys− mutant retains some ability to stimulate neurite outgrowth, and 3) MnSOD-expressing cells, on the other hand, display some neurites. Co-expression of MnSOD with the various mutants indicates that MnSOD rescues differentiation in cells expressing the Lys− mutant (Fig. 8). The Cys− mutant does not induce neurite outgrowth and inhibits the positive effects of MnSOD on differentiation (Fig. 8), indicating that in the absence of membrane-anchored Ras, MnSOD cannot stimulate differentiation of PC12 cells.
FIGURE 7.
Impact on PC12 differentiation of wild type and COOH-terminal Ki-Ras mutants. A, shown is NFG1A transcription in cells expressing Ki-Ras mutants at the COOH terminus. Ki-Ras (Val-12) mutants at the COOH terminus (5 lysines converted in alanine in the basic region are referred as Lys−, and cysteine of the CAAX box converted in alanine is referred as Cys−; see Ref. 1) were transfected and assayed for stimulation of NGF1A promoter activity. Values represent the means ± S.E. of at least three experiments performed in triplicate. * indicates p < 0.01 relative to control cells (C). ** indicates p < 0.01 relative to cells transfected with Ki-Ras. B, ERK1/2 activation by Ki-Ras mutants. In the same cells indicated in A, p-ERK1/2 was measured by immunoblot with specific antibodies. In the lower panel a representative immunoblot of Ki-Ras and p-ERK1/2 is shown. Values are the mean ± S.E. of at least three experiments performed in triplicate. *, p < 0.01 relative to control cells. **, p < 0.01 relative to cells transfected with Ki-Ras.
FIGURE 8.
Neurite outgrowth in cells expressing Ki-Ras mutants and MnSOD. PC12 cells were transiently co-transfected with Ki-Ras (Val-12) mutants, MnSOD, and GFP as indicated on each fluorescence micrograph. Control (C) cells were transfected only with GFP. Three days later the neurite length was scored as described under “Experimental Procedures” in at least 200 cells/dish. Non-transfected or control cells did not show appreciable neurite outgrowth. On the bottom, the statistical analysis of cells displaying neurites derived from three experiments is shown (see “Experimental Procedures”). *, p < 0.01 relative to control cells; **, p < 0.01 relative to cells transfected with Ki-Ras; °, p < 0.01 relative to cells transfected with MnSOD; °°, p < 0.01 relative to cells transfected with Ki-Lys−; §, indicates p < 0.01 relative to cells transfected with Ki-Cys−. We noticed that in MnSOD-transfected cells, all transfected cells displayed shorter neurites, whereas in Lys− -transfected cells, only a smaller fraction of the cells displayed longer neurites.
These data taken together illustrate the hierarchy of signals present in the Ki-Ras COOH terminus and the cooperation with MnSOD. These signals seem to play different roles in the induction of differentiation because 1) the CAAX box is the main anchoring site of Ras and its elimination broadly affects ERK1/2-induced transcription and differentiation, and 2) the polylysine stretch, the specific signal in the Ki-Ras terminus, is important for MnSOD induction (1). Cells expressing this mutant differentiate only when MnSOD is co-expressed. This signal cooperates in the induction of differentiation of PC12 cells provided that the major membrane anchor signal of Ki-Ras protein is intact. These data also indicate that MnSOD cooperates with but does not mediate all Ras effects on PC12 differentiation.
Integrity of Microtubular Cytoskeleton Is Required for Late NGF Activation of ERK1/2
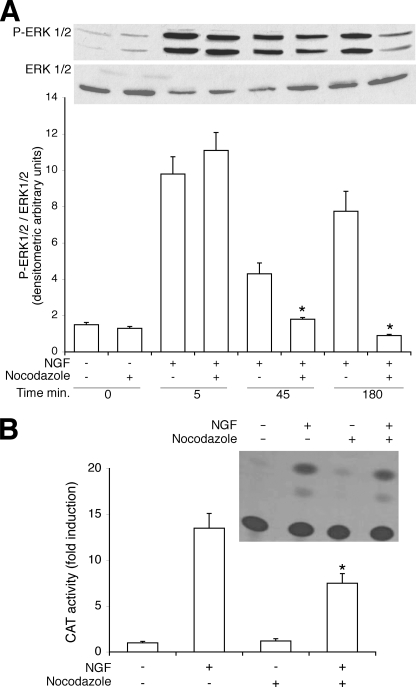
The data presented above suggest a mechanism for long term activation of ERK1/2 by NGF-Ki-Ras. H2O2 produced by mitochondrial MnSOD exerts its effects locally, as it is rapidly eliminated by catalase in the cytoplasm. Because Ki-Ras is stably localized under the plasma membrane (30), MnSOD is localized in the mitochondria, and the mitochondria are associated with the microtubule network (31), we tested whether the integrity of microtubule cytoskeleton is necessary for the propagation of ERK1/2 signal initiated by NGF and Ras. To this end we pretreated the cells with nocodazole, a drug that inhibits microtubule polymerization, and we stimulated the same cells with NGF. Fig. 9, A and B, show that the late peak of active ERK1/2 by NGF is selectively abolished in nocodazole-treated cells and that NGF1A transcription is severely impaired. The block of differentiation is not due to toxicity of the drug, as the early p-ERK1/2 peak induced by NGF or EGF or the transcription of control vectors are not affected (see the legend to Fig. 9).
FIGURE 9.
NGF stimulates the assembly of a macromolecular complex containing membrane, mitochondria, and cytoskeleton. A, long term ERK1/2 stimulation by NGF is impaired by nocodazole. Cells were treated with NGF (100 ng/ml) for the times indicated in the presence or absence of nocodazole (2 μm for 3 h) and analyzed for ERK1/2 activation by immunoblot with specific antibodies. Values shown represent the means ± S.E. of at least three experiments performed in triplicate (lower panel). A representative experiment is shown in the upper panel. *, p < 0.01 relative to cells treated only with NGF at the same time. The viability of the cells was not affected by 45 and 180 min of treatment with nocodazole. B, nocodazole inhibits NGF1A transcription. Cells were transfected with the CAT plasmids indicated in Fig. 2A, and 40 h later the cells were serum-starved for 5 h and treated for 4 h with 100 ng/ml NGF in the presence or absence of nocodazole (2 μm). The data are shown as CAT activity (-fold induction) normalized to the transfection efficiency. A representative autoradiogram is shown in the upper panel. CMV-LacZ expression and the viability of the cells were not affected by 4 h of treatment with nocodazole (2 μm). *, p < 0.01 relative to cells treated with NGF. Nocodazole (4 μm for 1 and 3 h) is not toxic and induces dispersion of mitochondrial clusters (49, 50).3
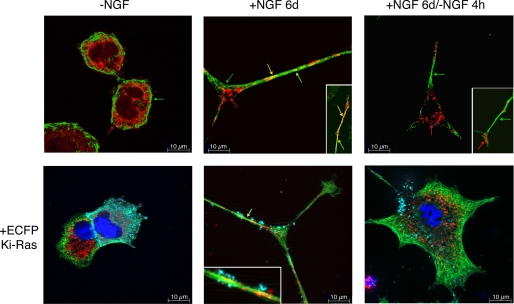
These data indicate that the integrity of microtubular cytoskeleton is essential for activation of ERK1/2 by NGF. Furthermore they suggest that NGF stimulates mitochondrial SOD through the formation of a macromolecular complex involving mitochondria, microtubules, and Ki-Ras. To test this hypothesis, we stimulated PC12 cells with NGF and stained the cells with mitotracker (mitochondria, red) and antibodies to α-tubulin (microtubules, green). Fig. 10 shows that in the absence of NGF, mitochondria are distributed around the nucleus and do not co-localize with α-tubulin (32). In differentiated cells, however, neurites show patches of mitochondria localized on microtubules (Fig. 10, NGF 6d, yellow). Co-localization of microtubules and mitochondria is induced by NGF because withdrawal of NGF for 4 h dissociates mitochondria and α-tubulin signals (Fig. 10, −NGF). Note that under these conditions microtubules in neurites are still well organized (+NGF 6d/−NGF 4 h). Control or NGF-treated cells expressing fluorescent wild type Ki-Ras display the same organization of mitochondria-microtubules shown above. NGF induces clustering of mitochondria and association with the cytoskeleton and the membrane (yellow). Withdrawal of NGF for 4 h dramatically changes the distribution of Ki-Ras, microtubules, and mitochondria and eliminates co-localization (Fig. 10, lower panels).
FIGURE 10.
NGF induces clustering of mitochondria, microtubules, and Ki-Ras. Staining with mitotracker and anti-α-tubulin antibodies of PC12 cells exposed to NGF for 6 days (complete differentiation) is shown. Differentiated cells were cultured for 4 h in the absence of NGF (6d/−NGF 4 h). The lower panels show cells transfected with ECFP-Ki-Ras, as indicated under “Experimental Procedures.” Cells were analyzed by structured epifluorescence illumination. On the left panel two cells are shown expressing high or lower levels of Ki-Ras. In both cells the signal appears to be specifically localized on the plasma membrane. In the insets of the central panels a 5× magnification of the neurite is shown to illustrate the co-localization of microtubules (green) and mitochondria (red) in proximity of Ki-Ras signal. In this panel a neurite that splits in two branches is shown. In the right panels, NGF was withdrawn for 4 h. The signals corresponding to mitochondria (red) and microtubules (green) appear dissociated, although the neurite is morphologically well delimited. We have scored at least 100 cells/sample in duplicate dishes, and this pattern was found in 70 ± 15% of the cells.
In conclusion, our data confirm and extend previous reports showing that NGF-coated spheres induced mitochondria clustering under the plasma membrane (33, 34). Physical association induced by NGF between mitochondria and plasma membrane accounts for the selective activation of MnSOD by ERK1/2 induced by Ki-Ras and NGF.
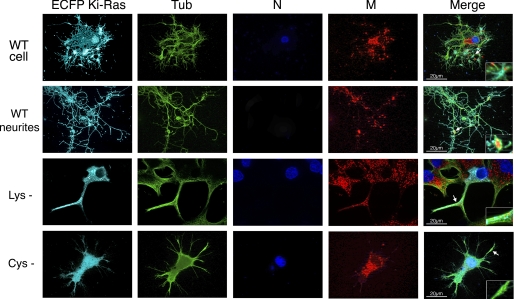
To dissect the Ras signals mediating mitochondrial-membrane clustering after NGF stimulation, we labeled the Ki-Ras mutants shown in Figs. 7 and 8 and have analyzed their cellular localization by confocal microscopy. Fig. 11 shows that the number of neurites is greatly reduced in cells expressing the Cys− or Lys− mutants. However, we note that the Ki-Ras Lys mutant partly retains membrane localization. Membrane localization is completely lost in Ki-Ras Cys− -expressing cells. In Ki-Ras Lys− -expressing cells, a fraction of Ki-Ras remains in the membrane. This fraction does not associate with mitochondria and microtubules after NGF stimulation (see the inset green and red spots). In Ki-Ras Cys− expressing cells, the Ki-Ras signal is completely disorganized and absent from cell membrane (Fig. 11). These data replicate the effects observed on transcription and differentiation of PC12 cells induced by these Ki-Ras mutants; the Cys− mutation completely abolishes membrane localization of the protein, whereas the Lys mutant partly retains it and cooperates with MnSOD.
FIGURE 11.
Ki-Ras mutants at the COOH terminus are unable to assemble mitochondria and cytoskeleton under the membrane. PC12 cells were transfected with wild type Ki-Ras or the Lys− or Cys− mutant versions (see “Experimental Procedures”) and stimulated with 100 ng/ml NGF for 3 days. Cells were stained with anti-α-tubulin antibodies (green, Tub), mitotracker (red, M), and Hoechst (blue, N) as described under in “Experimental Procedures.” Specifically cell bodies (cell) or neurites were selected and scored. Ki-Ras is shown in light blue. Although the number and the length of neurites were considerably lower in the cells expressing Ki-Ras mutants (Lys− and Cys−), the neurites did not present significant alteration of the microtubular network. Cells expressing wild type Ras display discrete regions where the tubulin, mitotracker and Ki-Ras signals overlap (arrows in wild type (WT) cell). Co-localization was lost in Ki-Ras Cys− -expressing cells. In Lys− -expressing cells, the signals corresponding to Ki-Ras, mitochondria, and α-tubulin did not overlap. The insets show a 5× magnification of the plasma membrane regions where Ki-Ras is localized. The patterns shown are representative of at least 60 ± 18% of the cells scored, on average 50 ± 15% per duplicate samples.
DISCUSSION
The data reported here indicate that the species and the site of ROS production are relevant for the completion of the differentiation program in PC12 cells, initiated by NGF. NGF improves mitochondrial respiration by reducing mitochondrial ROS. NGF and Ki-Ras selectively stimulate mitochondrial SOD (Fig. 1). The activity of this enzyme and local production of hydrogen peroxide are important elements governing long term ERK1/2 activation (Fig. 5). Under the same conditions, Ha-Ras and EGF, although powerful inducers of ERK1/2, were unable to stimulate mitochondrial SOD (1) (Fig. 1B). We wish to stress that EGF stimulation of ERK1/2 is transient and not persistent enough to stimulate MnSOD. Our data indicate that only sustained active ERK1/2 are able to stimulate mitochondrial SOD (Fig. 5). EGF, for the high turnover of the receptor, cannot sustain Ras-ERK1/2 signaling for long periods compared with NGF (7, 9, 10). Most likely, the two Ras isoforms are located in different membrane microdomains. This may account for the different effects on ROS metabolism and different ERK1/2 substrates. The Ha-Ras signaling complex is enucleated in the lipid rafts, where gp91phox NADPH oxidase is localized (35, 36). Local ERK1/2-activated by Ha-Ras is contiguous to the NADPH oxidase complex (37, 38).4 Ki-Ras, on the other hand, is localized in regions of the membrane cyclodextrin-resistant (36, 39) and contacts microtubular cytoskeleton (40). In a different context, it has been reported that Ki-Ras was associated to mitochondria (41). Together, these results suggest that the membrane domain where Ki-Ras is localized is close to the microtubular cytoskeleton and mitochondria. As to the mechanism of NGF induction of MnSOD, the data shown in Figs. 3 and 4 indicate that 1) NGF at 5 and 30 min stimulates the phosphorylation and the synthesis of new protein, respectively, and 2) at 3 h NGF increases the levels of the specific MnSOD mRNA. It is worth noting that MnSOD mRNA is efficiently translated on polysomes close to the outer wall of the mitochondria. In this location the 3′-untranslated region of the mRNA binds the protein kinase A anchor protein, AKAP121 (18). The nascent MnSOD protein can be phosphorylated by ERK1/2 induced by Ki-Ras. The efficiency of translation and phosphorylation can be optimized by NGF (Fig. 4B) and cAMP (18).
NGF stimulates several enzymes controlling ROS metabolism during PC12 differentiation, and the levels of ROS are critical during this period (3–5). In differentiating PC12 cells, MnSOD levels and activity are controlled at multiple levels by various types of stimuli. NGF, cAMP, and NO synthase directly or indirectly stimulate transcription of the enzyme (42, 43). MnSOD is induced very rapidly by NGF (5 and 30 min) followed by a late (3–24 h) stimulation. The ultimate result is the continuous availability of the enzyme, which appears to be relevant for induction and completion of differentiation. Mitochondrial SOD improves mitochondrial resistance to stress, participates to the shaping of ERK1/2 signaling (Fig. 5), suppresses growth (44), and stimulates differentiation (Fig. 6).
MnSOD induced by NGF also affects other cell compartments, including the nucleus. MnSOD is induced by ERK1/2 (Fig. 3) and generates hydrogen peroxide, which targets and amplifies ERK1/2 signal (Fig. 5) (27). This signal is confined to the mitochondria area and is delimited by catalase (45) because cytosolic SOD is not activated by Ki-Ras or NGF (1). The movement(s) of mitochondria on the microtubular cytoskeleton and the contact(s) with membranes transport the ERK1/2 signal to several cell compartments. It is of interest that in many cell types, PC12 included, ERK1/2 have been found associated with microtubular cytoskeleton (46, 47) and that under the same conditions described in Fig. 9 dynein mutants or nocodazole selectively inhibits the late NGF-induced peak of ERK1/2 (48, 49).
ROS are traditionally considered mediators of oxidative stress and inducers of apoptosis (50). The data reported here indicate that ROS and, specifically, peroxides transmit and mediate signals originated in the plasma membrane by tyrosine kinase receptors. In this context, ROS link metabolism to signal transduction pathways.
Supplementary Material
Acknowledgments
We thank Luca Cardone for the initial experiments on MnSOD phosphorylation in vitro, Mikko Laukkanen for the catalase expression vector, Rita Cerillo for technical assistance, and Franco D'Agnello for the art work.
This work was supported in part by the Associazione Italiana per la Ricerca sul Cancro, Ministero Italiano per l'Università e la Ricerca Scientifica, Fondo per gli Investimenti della Ricerca di Base, and Project “Colon,” Ministero della Salute, FSN 2004.

The on-line version of this article (available at http://www.jbc.org) contains supplemental Figs. 1S–3S.
P. Castagnola, unpublished data.
M. Santillo, A. Porcellini, and E. V. Avvedimento, manuscript in preparation.
- ROS
- reactive oxygen species
- siRNA
- small interfering RNA
- NGF
- nerve growth factor
- MnTMpyP
- Mn(III) tetrakis(1-methyl-4-pyridyl)porphyrin pentachloride
- EGF
- epidermal growth factor
- GFP
- green fluorescent protein
- CMV
- cytomegalovirus
- ECFP
- enhanced cyan fluorescent protein
- TMRE
- tetramethylrhodamine ethyl ester
- NT
- non-targeting
- ERK
- extracellular signal-regulated kinase
- MEK
- mitogen-activated protein kinase/extracellular signal-regulated kinase kinase
- SOD
- superoxide dismutase
- PBS
- phosphate-buffered saline
- CAT
- chloramphenicol acetyltransferase
- MnSOD
- manganese superoxide dismutase.
REFERENCES
- 1.Santillo M., Mondola P., Serù R., Annella T., Cassano S., Ciullo I., Tecce M. F., Iacomino G., Damiano S., Cuda G., Paternò R., Martignetti V., Mele E., Feliciello A., Avvedimento E. V. (2001) Curr. Biol. 11, 614–619 [DOI] [PubMed] [Google Scholar]
- 2.Cuda G., Paternò R., Ceravolo R., Candigliota M., Perrotti N., Perticone F., Faniello M. C., Schepis F., Ruocco A., Mele E., Cassano S., Bifulco M., Santillo M., Avvedimento E. V. (2002) Circulation 105, 968–974 [DOI] [PubMed] [Google Scholar]
- 3.Suzukawa K., Miura K., Mitsushita J., Resau J., Hirose K., Crystal R., Kamata T. (2000) J. Biol. Chem. 275, 13175–13178 [DOI] [PubMed] [Google Scholar]
- 4.Ibi M., Katsuyama M., Fan C., Iwata K., Nishinaka T., Yokoyama T., Yabe-Nishimura C. (2006) Free Radic. Biol. Med. 40, 1785–1795 [DOI] [PubMed] [Google Scholar]
- 5.Sampath D., Jackson G. R., Werrbach-Perez K., Perez-Polo J. R. (1994) J. Neurochem. 62, 2476–2479 [DOI] [PubMed] [Google Scholar]
- 6.Damon D. H., D'Amore P. A., Wagner J. A. (1990) J. Cell Biol. 110, 1333–1339 [DOI] [PMC free article] [PubMed] [Google Scholar]
- 7.Marshall C. J. (1995) Cell 80, 179–185 [DOI] [PubMed] [Google Scholar]
- 8.Babior B. M. (1999) Blood 93, 1464–1476 [PubMed] [Google Scholar]
- 9.Lazarovici P., Oshima M., Shavit D., Shibutani M., Jiang H., Monshipouri M., Fink D., Movsesyan V., Guroff G. (1997) J. Biol. Chem. 272, 11026–11034 [DOI] [PubMed] [Google Scholar]
- 10.Lax I., Wong A., Lamothe B., Lee A., Frost A., Hawes J., Schlessinger J. (2002) Mol. Cell 10, 709–719 [DOI] [PubMed] [Google Scholar]
- 11.Bumeister R., Rosse C., Anselmo A., Camonis J., White M. A. (2004) Curr. Biol. 14, 439–445 [DOI] [PubMed] [Google Scholar]
- 12.Wright J. H., Drueckes P., Bartoe J., Zhao Z., Shen S. H., Krebs E. G. (1997) Mol. Biol. Cell 8, 1575–1585 [DOI] [PMC free article] [PubMed] [Google Scholar]
- 13.Greene L. A., Tischler A. S. (1976) Proc. Natl. Acad. Sci. U.S.A. 73, 2424–2428 [DOI] [PMC free article] [PubMed] [Google Scholar]
- 14.Janssen-Timmen U., Lemaire P., Mattéi M. G., Revelant O., Charnay P. (1989) Gene 80, 325–336 [DOI] [PubMed] [Google Scholar]
- 15.Cassano S., Di Lieto A., Cerillo R., Avvedimento E. V. (1999) J. Biol. Chem. 274, 32574–32579 [DOI] [PubMed] [Google Scholar]
- 16.Marchisio P. C., Cremona O., Savoia P., Pellegrini G., Ortonne J. P., Verrando P., Burgeson R. E., Cancedda R., De Luca M. (1993) Exp. Cell Res. 205, 205–212 [DOI] [PubMed] [Google Scholar]
- 17.Chen Q., Lin R. Y., Rubin C. S. (1997) J. Biol. Chem. 272, 15247–15257 [DOI] [PubMed] [Google Scholar]
- 18.Ginsberg M. D., Feliciello A., Jones J. K., Avvedimento E. V., Gottesman M. E. (2003) J. Mol. Biol. 327, 885–897 [DOI] [PubMed] [Google Scholar]
- 19.McCord J. M., Fridovich I. (1969) J. Biol. Chem. 244, 6049–6055 [PubMed] [Google Scholar]
- 20.Castellano I., Cecere F., De Vendittis A., Cotugno R., Chambery A., Di Maro A., Michniewicz A., Parlato G., Masullo M., Avvedimento E. V., De Vendittis E., Ruocco M. R. (2009) Biopolymers 91, 1215–1226 [DOI] [PubMed] [Google Scholar]
- 21.Schewe T. (1995) Gen. Pharmacol. 26, 1153–1169 [DOI] [PubMed] [Google Scholar]
- 22.Heasley L. E., Johnson G. L. (1992) Mol. Biol. Cell 3, 545–553 [DOI] [PMC free article] [PubMed] [Google Scholar]
- 23.Traverse S., Gomez N., Paterson H., Marshall C., Cohen P. (1992) Biochem. J. 288, 351–355 [DOI] [PMC free article] [PubMed] [Google Scholar]
- 24.Faulkner K. M., Liochev S. I., Fridovich I. (1994) J. Biol. Chem. 269, 23471–23476 [PubMed] [Google Scholar]
- 25.Takii Y., Takoh K., Nishuzawa M., Matsue T. (2003) Electrochim. Acta 48, 20–22, 3381–3385 [Google Scholar]
- 26.Ranganathan A. C., Nelson K. K., Rodriguez A. M., Kim K. H., Tower G. B., Rutter J. L., Brinckerhoff C. E., Huang T. T., Epstein C. J., Jeffrey J. J., Melendez J. A. (2001) J. Biol. Chem. 276, 14264–14270 [DOI] [PubMed] [Google Scholar]
- 27.Peter P., Loffler G., Petrides P. E. (2006) Biochemie, German Ed., p. 123, Springer-Lehrbuch, Berlin [Google Scholar]
- 28.Kemmerling U., Muñoz P., Müller M., Sánchez G., Aylwin M. L., Klann E., Carrasco M. A., Hidalgo C. (2007) Cell Calcium 41, 491–502 [DOI] [PubMed] [Google Scholar]
- 29.Kim J. W., Li M. H., Jang J. H., Na H. K., Song N. Y., Lee C., Johnson J. A., Surh Y. J. (2008) Biochem. Pharmacol. 76, 1577–1589 [DOI] [PubMed] [Google Scholar]
- 30.Hancock J. F., Cadwallader K., Paterson H., Marshall C. J. (1991) EMBO J. 10, 4033–4039 [DOI] [PMC free article] [PubMed] [Google Scholar]
- 31.Müller M., Mironov S. L., Ivannikov M. V., Schmidt J., Richter D. W. (2005) Exp. Cell Res. 303, 114–127 [DOI] [PubMed] [Google Scholar]
- 32.Kreis T. E. (1987) EMBO J. 6, 2597–2606 [DOI] [PMC free article] [PubMed] [Google Scholar]
- 33.Chada S. R., Hollenbeck P. J. (2003) J. Exp. Biol. 206, 1985–1992 [DOI] [PubMed] [Google Scholar]
- 34.Chada S. R., Hollenbeck P. J. (2004) Curr. Biol. 14, 1272–1276 [DOI] [PubMed] [Google Scholar]
- 35.Vilhardt F., van Deurs B. (2004) EMBO J. 23, 739–748 [DOI] [PMC free article] [PubMed] [Google Scholar]
- 36.Fukano T., Sawano A., Ohba Y., Matsuda M., Miyawaki A. (2007) Cell Struct. Funct. 32, 9–15 [DOI] [PubMed] [Google Scholar]
- 37.Irani K., Xia Y., Zweier J. L., Sollott S. J., Der C. J., Fearon E. R., Sundaresan M., Finkel T., Goldschmidt-Clermont P. J. (1997) Science 275, 1649–1652 [DOI] [PubMed] [Google Scholar]
- 38.Svegliati S., Cancello R., Sambo P., Luchetti M., Paroncini P., Orlandini G., Discepoli G., Paterno R., Santillo M., Cuozzo C., Cassano S., Avvedimento E. V., Gabrielli A. (2005) J. Biol. Chem. 280, 36474–36482 [DOI] [PubMed] [Google Scholar]
- 39.Prior I. A., Hancock J. F. (2001) J. Cell Sci. 114, 1603–1608 [DOI] [PubMed] [Google Scholar]
- 40.Chen Z., Otto J. C., Bergo M. O., Young S. G., Casey P. J. (2000) J. Biol. Chem. 275, 41251–41257 [DOI] [PubMed] [Google Scholar]
- 41.Bivona T. G., Quatela S. E., Bodemann B. O., Ahearn I. M., Soskis M. J., Mor A., Miura J., Wiener H. H., Wright L., Saba S. G., Yim D., Fein A., Pérez de Castro I., Li C., Thompson C. B., Cox A. D., Philips M. R. (2006) Mol. Cell 21, 481–493 [DOI] [PubMed] [Google Scholar]
- 42.Bedogni B., Pani G., Colavitti R., Riccio A., Borrello S., Murphy M., Smith R., Eboli M. L., Galeotti T. (2003) J. Biol. Chem. 278, 16510–16519 [DOI] [PubMed] [Google Scholar]
- 43.Galeotti T., Pani G., Capone C., Bedogni B., Borrello S., Mancuso C., Eboli M. L. (2005) Biomed. Pharmacother. 59, 197–203 [DOI] [PubMed] [Google Scholar]
- 44.Hu Y., Rosen D. G., Zhou Y., Feng L., Yang G., Liu J., Huang P. (2005) J. Biol. Chem. 280, 39485–39492 [DOI] [PubMed] [Google Scholar]
- 45.Zhou Z., Kang Y. J. (2000) J. Histochem. Cytochem. 48, 585–594 [DOI] [PubMed] [Google Scholar]
- 46.Ding A., Chen B., Fuortes M., Blum E. (1996) J. Exp. Med. 183, 1899–1904 [DOI] [PMC free article] [PubMed] [Google Scholar]
- 47.Morishima-Kawashima M., Kosik K. S. (1996) Mol. Biol. Cell 7, 893–905 [DOI] [PMC free article] [PubMed] [Google Scholar]
- 48.Wu C., Ramirez A., Cui B., Ding J., Delcroix J. D., Valletta J. S., Liu J. J., Yang Y., Chu S., Mobley W. C. (2007) Traffic 8, 1503–1520 [DOI] [PubMed] [Google Scholar]
- 49.Smirnova E., Griparic L., Shurland D. L., van der Bliek A. M. (2001) Mol. Cell. Biol. 12, 2245–2256 [DOI] [PMC free article] [PubMed] [Google Scholar]
- 50.Gadjev I., Stone J. M., Gechev T. S. (2008) Int. Rev. Cell Mol. Biol. 270, 87–144 [DOI] [PubMed] [Google Scholar]
Associated Data
This section collects any data citations, data availability statements, or supplementary materials included in this article.


