Abstract
Inhibitor of DNA binding 4 (ID4) is a helix-loop-helix protein that heterodimerizes with basic helix-loop-helix transcription factors inhibiting their function. ID4 expression is important for adipogenic differentiation of the 3T3-L1 cell line, and inhibition of ID4 is associated with a concomitant decrease in CCAAT/enhancer-binding protein α and peroxisome proliferator-activated receptor γ mRNA and protein expression. Mice with a homozygous deletion of Id4 (Id4−/−) have reduced body fat and gain much less weight compared with wild-type littermates when placed on diets with high fat content. Mouse embryonic fibroblasts (MEFs) isolated from Id4−/− mice have reduced adipogenic potential when compared with wild-type MEFs. In agreement with changes in morphological differentiation, the levels of CCAAT/enhancer-binding protein α and peroxisome proliferator-activated receptor γ were also reduced in MEFs from Id4−/− mice. Our results demonstrate the importance of ID4 in adipocyte differentiation and the implications of this regulation for adipose tissue formation.
Keywords: Adipocyte, Adipose Tissue, Lipid, Mouse Genetics, Obesity, Adipocyte Differentiation, Mouse Models
Introduction
The emergence of obesity as a major public health concern underscores the importance of understanding adipose tissue biology, and it has led to the recognition of adipose tissue as a highly dynamic and complex tissue with diverse functions (1, 2). Adipose tissue formation is controlled by the coordinated action of multiple genes acting in a tightly regulated and highly integrated network designed to maintain energy homeostasis (2, 3). Abnormalities in adipose tissue function are widely recognized as contributing to a variety of metabolic disorders. Obesity, which is characterized by the excess accumulation of adipose tissue, can contribute to the development of pathological conditions such as hyperlipidemia, coronary artery disease, and diabetes (4). Interestingly, diminished adipose tissue, lipodystrophy, which typically occurs when the maturation and expansion of adipose tissue are impaired, results in similar metabolic disorders (5). Obesity and lipodystrophy are distinct disorders with the common characteristic that they both involve altered adipose tissue. Thus, understanding the biology of adipocytes and its regulation may provide insight into both the underlying function of adipose tissue as well as a broad spectrum of important metabolic diseases.
Several proteins are involved in the regulation of transcriptional events that mediate adipogenesis and adipocyte function (6, 7). Key among these are CCAAT/enhancer-binding proteins (C/EBPs)2 and the peroxisome proliferator-activated receptors (PPAR) (3, 6). C/EBPβ and C/EBPδ are expressed early in response to an adipogenic differentiation signal, and they regulate transcriptionally the expression of PPARγ and C/EBPα at a later time in differentiation (8, 9). Loss-of-function studies have demonstrated that PPARγ is required for adipogenesis in vivo and in vitro (10, 11). Deletion of PPARγ in the germ line of mice results in their failure to form adipose tissue (10, 12). Similarly, germ line deletion of C/EBPα leads to defective white adipose tissue formation in vivo and reduced adipogenic differentiation of mouse embryonic fibroblasts (MEFs) in vitro (9). Interestingly, ectopic expression of PPARγ in C/EBPα-deficient MEFs rescues the adipogenic potential of these cells, whereas C/EBPα is incapable of driving the adipogenic program in cells lacking PPARγ (13). These observations suggest that both PPARγ and C/EBPα function in an adipocyte differentiation pathway in which PPARγ is located downstream of C/EBPα. Despite the detailed understanding of these important regulators of adipogenesis, little is known about the regulation of molecules involved in earlier steps of adipogenesis (14, 15).
Inhibitors of DNA binding, Id genes, encode helix-loop-helix transcription factors that lack a DNA-binding domain and thereby can act as endogenous dominant negative regulators of basic HLH (bHLH) transcription factors by binding to them and inhibiting their ability to form biologically active dimers consisting of two individual bHLH proteins (16). The Id gene family includes four genes (Id1–4) that are involved in the regulation of many biological processes, including cell cycle progression and differentiation of many cell types, including adipocytes (16–19). Recently, in vitro studies have shown that ID2 and ID3 may regulate genes expressed during adipocyte differentiation, including adiponectin, hormone-sensitive lipase, and fatty-acid synthase (17, 19, 20). In addition to its role in adipocyte differentiation, ID2 also is known to contribute to the circadian regulation of lipid metabolism in vivo (21). The expression of another member of this family of proteins, ID4, increases in response to hormone-induced adipocyte differentiation, although its role in adipogenesis and adipose tissue formation is unknown (22). We therefore sought to determine whether ID4 contributes to adipogenesis in vitro and in vivo, and if so what effect it might have on adipose tissue formation.
EXPERIMENTAL PROCEDURES
Animals
C57BL/6 Id4−/− mice were derived as described previously (23). C57BL/6 adult animals indicated as “WT” or “control” in all experiments were age-matched littermates of the Id4−/− animals examined. All animals were housed in a standard pathogen-free facility at 22 °C on 12-h light/12-h dark cycle and had continuous access to standard rodent chow (Teklad Global Rodent 2018SX; Global Diets) containing 53.3% carbohydrates, 18.5% protein, and 5.5% fat. Mice on enriched fat diet (EFD) were maintained for 6 weeks on Love Mash (Bio-serv), containing 50.9% carbohydrates, 13.2% protein, and 14.3% fat. Mice on high fat diet (HFD) were maintained for 6 weeks on HFD (Bio-serv), containing 36.3% carbohydrates, 20% protein, and 35.5% fat. All animals had access to water ad libitum. Body weight changes were normalized by dividing the change in interval weight by the initial body weight, because animals of each genotype varied in weight at the beginning of individual experiments. Food consumption was measured using M2100 metabolic cages (Lab Products Inc.). All procedures were approved and performed in accordance with Dartmouth College Institutional Animal Care and Use Committee guidelines.
Cell Culture
Primary mouse embryonic fibroblasts (MEFs) were isolated from 13.5-day-old embryos by trypsin digestion and maintained in Dulbecco's modified Eagle's medium supplemented with 10% fetal bovine serum and 100 units/ml penicillin and 100 μg/ml streptomycin. Experiments were conducted with MEFs between passages 1 and 3. 3T3-L1 mouse pre-adipocyte cells were purchased from American Type Culture Collection and maintained as suggested by the provider. Adipocyte differentiation was induced by treating confluent 3T3-L1 cells (day 0) for 2 days with DMI, 1 μm dexamethasone (Sigma), 0.5 mm 3-isobutyl-1-methylxanthine (Sigma), and 5 μg/ml insulin (Sigma) or confluent MEFs with DMI-R, 1 μm dexamethasone, 0.5 mm 3-isobutyl-1-methylxanthine, 10 μg/ml insulin, plus 10 μm rosiglitazone (Alexis Biochemicals). Following treatment of either cell type with the designated drug mixture for 2 days, they received an additional 2 days of treatment with 10 μg/ml insulin, and then they were cultured in Dulbecco's modified Eagle's medium plus 10% fetal bovine serum until day 10. After 10 days of differentiation, cells were used for either RNA isolation using RNeasy (Qiagen) according to the manufacturer's instructions, protein isolation, or histological evaluation by staining for lipid accumulation with Oil Red O staining (Sigma). For retrovirus production, Phoenix cells (Orbigen) were transfected with the plasmids encoding the genes of interest using FuGENE 6 (Roche Applied Science). Following 48 h of culture, media containing retroviruses were harvested and used to transduce target cells in the presence of 8 μg/ml of Polybrene (Sigma). Stable cell lines were selected in the presence of 2 μg/ml puromycin (Sigma). We used shRNA against ID4 or scramble shRNA to engineer cells lines in which Id4 expression was inhibited. shRNA targeting Id4 had the following sequence: ID4.HIND, 5′-GATCCCCGTCAGCAAAGTGGAGATCCTTCAAGAGAGGATCTCCACTTTGCTGACTTTTTA-3′; ID4.HIND-As, 5′-AGCTTAAAAAGTCAGCAAAGTGGAGATCCTCTCTTGAAGGATCTCCACTTTGCTGACGGG-3′. Scramble shRNA and shRNA targeting Id4 were cloned in the expression vector pSUPER.Retro (OligoEngine).
Fat Mass Estimation
MRI was used to quantify percent body fat of mice. Mice were anesthetized by inhalation of 1–2% isoflurane in 50:50 (v/v) mixture of oxygen and air delivered through a face mask before and during the MRI scans. A rectal fiber optic probe was used to monitor the core body temperature. The animal core body temperature was maintained at 35–37 °C by using a thermostated water circulating heating element. All the MRI experiments were performed on a 7 tesla, 20-cm diameter horizontal bore magnet (Magnex Scientific Ltd.) equipped with actively shielded imaging gradients. The maximum gradient strength was 77 G/cm, and the magnet was interfaced to a Varian Inova Unity console (Varian, Inc.). A 38-mm diameter Varian birdcage coil was used for data acquisition. Proton density weighted multislice spin-echo images were acquired with the following parameters: repetition time (TR) 1.5 s, echo time (TE) 15 ms, matrix size of 128 × 128, and four signal averaging. Twenty four to 30 2-mm-thick transaxial slices were acquired from each animal examined (field of view 30 mm2) with either frequency-specific saturation on fat (1.3 ppm) or water (4.7 ppm) peaks. The total acquisition time was 12 min 48 s for each set of the water and (water suppressed) fat images. The frequency-selective suppression pulses were optimized to achieve the complete suppression using the Chemical Shift Selective (CHESS) procedure (24). The MRI images were transferred to ImageJ (National Institutes of Health) software (www.rsbweb.nih.gov) for analysis. Images were converted to binary and the program quantified the number of pixels corresponding to fat. Total area of fat for each image was summed and multiplied by fat density and section thickness to give total fat mass per mouse. Percent body fat was calculated by dividing fat mass by total body mass.
Histological Analysis
Fat tissues were fixed in 10% neutral buffered formalin overnight and embedded in paraffin. All specimens were cut in 5-μm sections and stained with hematoxylin and eosin (Sigma) according to standard protocols. Photomicrographs were obtained with a digital camera (Olympus BX60), and sections were analyzed using ImagePro5.1 software. Fat tissue histological sections were analyzed under ×20 magnification, and cell area was measured using ImageJ. Mean surface area was calculated based on the measurement of 200 adipocytes in three different histological sections from each of three different animals of each genotype. We used the area of the adipocyte as it appears histologically as a surrogate for adipocyte size, and we determined the area in μm2 by converting the number of pixels corresponding to an adipocyte into an area measured by a micrometer (25).
RNA Extraction and Quantitative Real Time PCR
Samples from white adipose tissue were harvested and immediately placed in TRIzol reagent (Invitrogen) for RNA isolation. Reverse transcription was performed using iScript cDNA synthesis kit (Bio-Rad) according to the manufacturer's instructions. cDNA served as the template for quantitative real time PCR using iQ SYBR Green Supermix (Bio-Rad). The primer sequences of the genes analyzed are available upon request. qRT-PCR was performed using iCycler Thermocycler (Bio-Rad) and relative quantification was calculated using the 2−(ΔΔCt) method.
Western Blot Analysis
3T3-L1 cells were isolated in lysis buffer (150 mm Tris, 150 mm NaCl, 0.1% SDS, 1% Nonidet P-40, 2 mm phenylmethylsulfonyl fluoride, and a protease inhibitor mixture (Roche Applied Science)) and centrifuged at 10,000 × g for 20 min at 4 °C. Western blot analysis was performed according to standard protocols using antibodies against ID4, C/EBPα, PPARγ (Santa Cruz Biotechnology Inc.), and β-actin (Sigma), which served as loading control.
Blood Profile
Serum adiponectin and leptin measurements were done in mice fed standard rodent chow diet ad libitum using an adiponectin ELISA kit (Linco) or a leptin ELISA kit (Crystal Chem). Triglycerides were assayed in mice fed a standard rodent chow diet or HFD ad libitum using a commercial kit (Biovision). Cholesterol and free fatty acid levels were assayed in animals fed an HFD using a commercial kit (Biovision).
Measurement of Blood Pressure
Blood pressure and heart rate of WT and Id4−/− mice were measure by the tail-cuff method using Coda 6 (Kent Scientific). All of the blood pressure and heart rate measurements were taken from 12- to 14-week-old mice, and the values from 150 successful readings (30 readings on each of 5 days) per mouse were used to calculate individual averages ± S.E.
Statistics
Mean ± S.E. values were plotted using Prism (version 5; GraphPad software). Statistical comparisons between groups were performed using the Student's t test. Data were considered significantly different if p values were ≤0.05.
RESULTS
Role of Id4 in Adipocyte Differentiation in Vitro
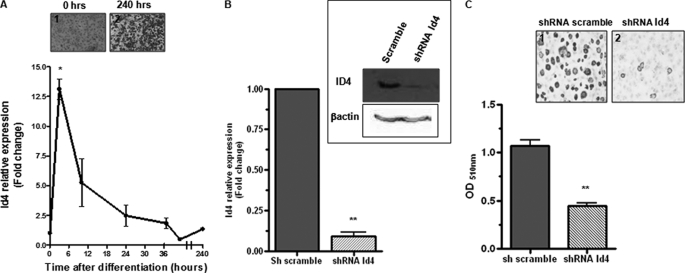
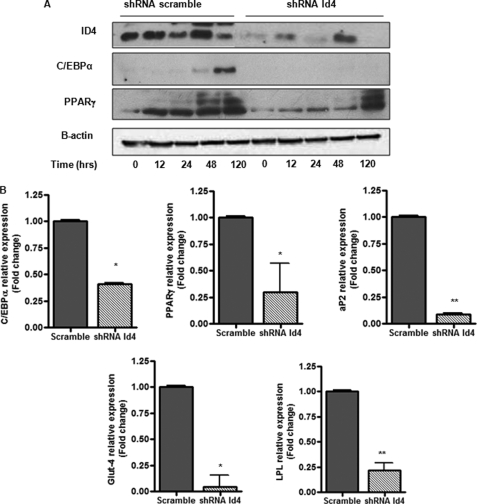
To evaluate the role of Id4 in adipocyte differentiation, we employed an established in vitro system for evaluating adipocyte differentiation, 3T3-L1 (26). As described under “Experimental Procedures,” 2 days after 3T3-L1 cells reached confluence, we replaced normal growth media with a widely used adipogenic mixture, DMI, to induce adipocyte differentiation (26). As expected, we observed that after 4–5 days of differentiation, these cells began to produce fat (data not shown). Therefore, we monitored the expression of ID4 during the course of 3T3-L1 differentiation (Fig. 1A). We found that Id4 expression was rapidly induced within 3 h of drug treatment and remained relatively high up to 48 h after the induction of differentiation. To address the importance of Id4 in the regulation of adipocyte differentiation, we used a recombinant retroviral vector to prepare 3T3-L1 cells stably expressing shRNA against Id4 and 3T3-L1 cells expressing scrambled shRNA for comparison as control. Cells expressing shRNA against Id4 had decreased levels of Id4 (Fig. 1B). Although there were no striking morphological changes in these altered 3T3-L1 cells prior to the initiation of differentiation (data not shown), 10 days following the induction of differentiation, there was a significant decrease in intracellular fat production as measured by Oil Red O staining of 3T3-L1 expressing shRNA against Id4 when compared with cells expressing the control plasmid (Fig. 1C). In addition, decreased expression of ID4 led to a significant decrease in the expression levels of C/EBPα and PPARγ (Fig. 2A), which are known to act as important regulators of genes involved in adipocyte differentiation. We also examined the mRNA levels of C/EBPα, PPARγ2, and adipocyte differentiation markers, aP2 (fatty acid-binding protein 4), Glut-4, and lipoprotein lipase after 10 days of differentiation, and we observed that they were significantly reduced in adipocytes with reduced levels of ID4 (Fig. 2B). Our finding that decreased Id4 expression in 3T3L1 cells results in reduced adipocyte differentiation and reduced expression of fat differentiation markers suggests an important role for ID4 in adipocyte differentiation.
FIGURE 1.
ID4 enhances adipocyte differentiation. A, analysis of Id4 mRNA induction by adipogenic mixture in 3T3-L1 cells by quantitative RT-PCR. Data points represent three independent experiments. Two-tailed Student's t tests were performed at individual time points to determine the statistical significance compared with day 0. Panels 1 and 2, Oil Red O staining of 3T3-L1 before and after 10 days of differentiation. B, qRT-PCR and Western blot analysis of Id4 expression in 3T3-L1 stably expressing shRNA against Id4 or shRNA control (scrambled) (n = 3). C, Oil Red O staining of 3T3-L1 stably expressing shRNA against Id4 or scrambled shRNA after 10 days of differentiation (panels 1 and 2). Extracted Oil Red O was measured at 510 nm. Cyclophilin was used as endogenous control for mRNA expression, and β-actin was used as loading control for Western blot. All values are mean ± S.E. *, p < 0.05; **, p < 0.01.
FIGURE 2.
Id4 modulates the expression of adipogenic markers. A, Western blot analysis of ID4, C/EBPα, and PPARγ at 0, 12, 24, 48, and 120 h after DMI-induced differentiation. β-Actin was used as loading control. B, qRT-PCR of C/EBPα, PPARγ2, aP2, Glut-4, and lipoprotein lipase mRNA in 3T3L1 stably expressing shRNA against Id4 or shRNA scrambled after 10 days of differentiation (n = 3). Cyclophilin was used as endogenous control for all mRNA expression. All values are mean ± S.E. *, p < 0.05; **, p < 0.01.
Reduced Adipose Tissue Deposits in Id4−/− Mice
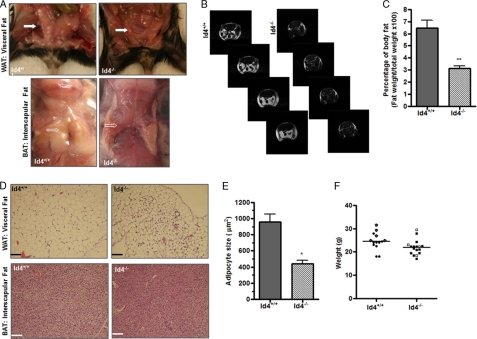
To examine the role of Id4 in the formation of adipose tissue, we evaluated mice with a homozygous deletion of the Id4 gene. We observed that Id4−/− mice had a reduction in both white adipose tissue (WAT), as exemplified by a greatly diminished visceral fat pad (Fig. 3A, upper panels), and brown adipose tissue (BAT), as demonstrated by greatly reduced fat in the interscapular area (Fig. 3A, lower panels). To quantify the amount of adipose tissue in Id4−/− mice, we compared the body fat mass in each of these genotypes using MRI. MRI allowed us to compare a more global measure of body fat in each individual mouse than can be otherwise estimated by standard anthropometric methods (27). Analysis of MRI axial sections of adipose tissue, which is recognizable in our MRI as bright white areas, confirmed the predicted decrease in body fat (Fig. 3B). We found that the average percentage of body fat weight in Id4−/− mice was ∼50% less than that observed in WT animals (Fig. 3C). To examine the residual adipose tissue at these sites in Id4−/− mice, we prepared hematoxylin and eosin-stained histological sections of WAT and BAT from WT and Id4−/− mice (Fig. 3D). We observed that the size of adipocytes in WAT from Id4−/− was smaller than that in tissue from WT animals. To quantify this apparent difference, we calculated the mean surface area of adipocytes from WAT of WT and Id4−/− mice as described under “Experimental Procedures.” We found that the size of Id4−/− adipocytes in fixed histological sections was approximately half the size observed in cells from WT animals (Fig. 3E). We therefore measured the weight of Id4−/− mice and observed a trend toward their having a decreased body weight compared with WT animals (Fig. 3F). Throughout these studies, we have combined the evaluation of female and male animals as we never identified a systematic physiological difference between animals of different sexes.
FIGURE 3.
Id4−/− animals have reduced fat. A, WAT in the visceral fat pad (closed arrows) and BAT in the interscapular area (open arrows) of representative Id4+/+ (WT) and Id4−/− mice. B, representative axial panels of MRI images of WT and Id4−/− mice obtained as described under “Experimental Procedures.” Fat appears as a bright white image. C, quantification of percent body fat by MRI. The average percentage of body fat weight ± S.E., calculated as described under “Experimental Procedures,” is shown (n = 6 mice per genotype). D, hematoxylin and eosin-stained histological sections of WAT and BAT from WT and Id4−/− mice. Original magnification ×20; scale bar, 100 μm. E, mean surface area of adipocytes (μm2) from WAT of WT and Id4−/− mice. The areas shown represent the mean ± S.E. area of 200 adipocytes per histological section of three different histological sections from each of three different animals of each genotype. F, body weight in grams of WT and Id4−/− mice on chow diet (n = 12 mice per genotype). Male animals are represented by open dots, and females are represented by closed dots. Values are mean ± S.E. (*, p < 0.05; **, p < 0.01).
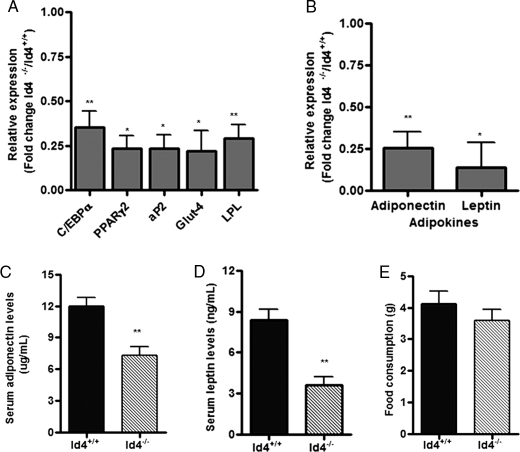
The observation that Id4−/− mice have reduced adipose tissue and decreased adipocyte size indicated an important role for ID4 in adipose tissue development. We therefore sought to determine whether the expression of tissue differentiation markers and adipokines typically expressed in adipose tissue is also altered in Id4−/− mice. Several of these we evaluated at the mRNA level, because adipocyte differentiation is controlled by transcriptional events (6). We observed that WAT from Id4−/− mice had reduced expression of transcriptional regulators C/EBPα and PPARγ2 and adipocyte differentiation markers aP2, Glut-4, and lipoprotein lipase compared with levels in WAT from WT mice (Fig. 4A). In addition, the expression of adiponectin and leptin mRNA in WAT from Id4−/− mice was significantly reduced compared with levels detected in this tissue from WT animals (Fig. 4B). Consistent with this finding, we observed that the levels of adiponectin (Fig. 4C) and leptin (Fig. 4D) protein were also decreased in serum samples from Id4−/− mice. To examine if the reduction in adipose tissue was associated with a decrease in food consumption, we monitored WT and Id4−/− animals in metabolic cages (Fig. 4E). We did not observe any difference in the amount of food consumed between the different genotypes.
FIGURE 4.
Reduced adipose tissue function in Id4−/− mice. A, C/EBPα, PPARγ2, aP2, Glut-4, and lipoprotein lipase (LPL) mRNA levels in visceral WAT from WT and Id4−/− mice determined by qRT-PCR (n = 4 mice per genotype). B, adiponectin and leptin mRNA levels in WAT from WT and Id4−/− mice determined by qRT-PCR (n = 4 mice per genotype). Cyclophilin was used as endogenous control for mRNA expression. C, adiponectin serum levels from WT and Id4−/− mice determined by ELISA (n = 8 mice per genotype). D, leptin serum levels from WT and Id4−/− mice determined by ELISA (n = 5 mice per genotype). E, food consumption of WT and Id4−/− mice. WT and Id4−/− animals were maintained in metabolic cages for 24 h with free access to water and food. Weight of food consumed was determined (n = 5). Values are mean ± S.E. *, p < 0.05 and **, p < 0.01.
Role of Id4 in the Differentiation of Mouse Embryonic Fibroblasts
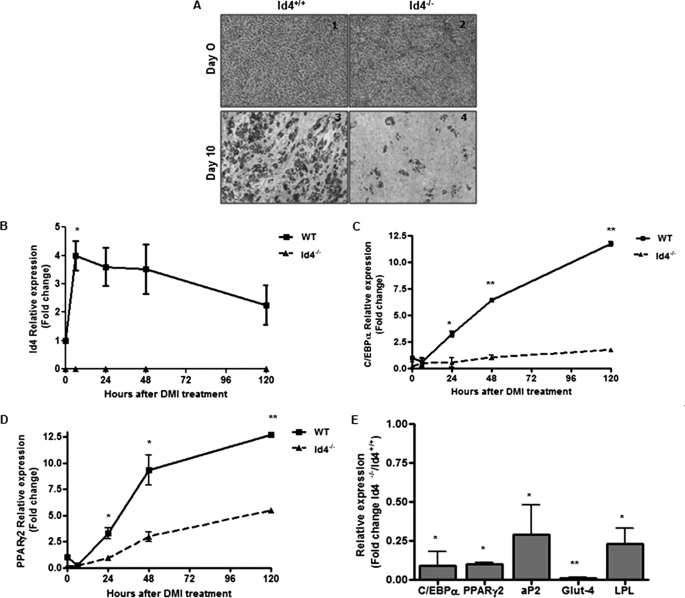
To further evaluate the role of ID4 in adipocyte differentiation, we examined MEFs isolated from WT and Id4−/− embryos (day 13.5) and used these cells as a model for adipocyte differentiation (28). Although we observed no morphological differences in these MEF cultures prior to the initiation of differentiation (Fig. 5A, panels 1 and 2), after 10 days of differentiation a significantly higher number of differentiated adipocytes, as identified by Oil Red O staining, were observed in the MEF cultures from WT animals compared with MEFs prepared from Id4−/− animals (Fig. 5A, panels 3 and 4). We monitored the levels of Id4 expression during the course of differentiation and found that Id4 mRNA expression was induced within 12 h of drug treatment and remained elevated for up to 120 h (Fig. 5B). We also monitored the expression levels of C/EBPα and PPARγ2 in WT and Id4−/− MEFs during adipocyte differentiation (Fig. 5, C and D). We found that in MEFs from Id4−/− mice, the expression of C/EBPα and PPARγ2 was significantly reduced during differentiation when compared with the WT cells. In addition, we examined the expression of adipogenic markers in WT and Id4−/− MEFs after 10 days of differentiation (Fig. 5E). We found that the expression of adipocyte differentiation markers was greatly reduced in the Id4−/− MEFs when compared with the WT cells, a finding consistent with the reduced expression of these markers that was observed in adipose tissue from Id4−/− animals (Fig. 4A).
FIGURE 5.
Effect of Id4 expression on adipocyte differentiation of MEFs. A, representative Oil Red O staining of WT and Id4−/− MEFs before (panels 1 and 2) and after (panels 3 and 4) 10 days of differentiation. B, Id4 mRNA expression levels determined by qRT-PCR. Two days after reaching confluence, MEFs were treated with DMI containing rosiglitazone (10 μm), and RNA was extracted at 0, 12, 24, 48, and 120 h. Two-tailed Student's t tests were performed at individual time points to determine the statistical significance compared with day 0. C/EBPα (C) and PPARγ2 (D) mRNA levels in WT and Id4−/− MEFs were determined by qRT-PCR. Two-tailed Student's t tests were performed at individual time points to determine the statistical significance between WT and Id4−/− samples. E, C/EBPα, PPARγ2, aP2, Glut-4, and lipoprotein lipase (LPL) mRNA levels in WT and Id4−/− MEFs 10 days after the initiation of differentiation determined by qRT-PCR. Each point is an average of expression levels determined in three independent MEF preparations. Values are mean ± S.E. Cyclophilin was used as the endogenous control for all qRT-PCR analysis. Values are mean ± S.E. *, p < 0.05; **, p < 0.01.
Id4 Expression Affects Diet-induced Weight Gain
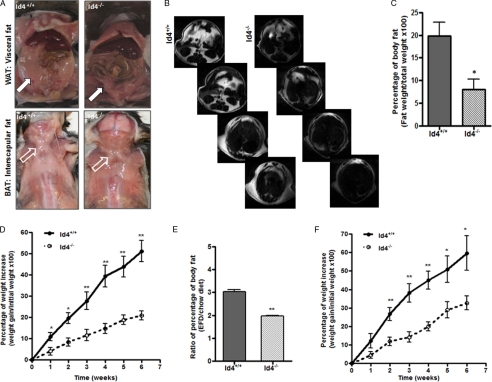
Our results suggest that the loss of Id4 leads to a decrease in fat tissue maturation. The apparent inability of Id4−/− mice to efficiently store dietary fat in adipose tissue raised the question as whether these animals would become obese when fed a high fat diet. To examine this possibility, we placed WT and Id4−/− mice on an EFD containing about the same amount of carbohydrates and proteins found in the routine animal chow diet but with higher amounts of fat. After 6 weeks on this diet, we examined the effects of increased levels of dietary fat on adipose tissue in these mice. Although there was no significant difference in the weight of adult WT or Id4−/− mice on the routine chow diet (Fig. 3F), examination of Id4−/− mice fed an EFD revealed them to be leaner than WT animals fed the EFD (data not shown). To analyze if the decreased weight gain in these animals was associated with a decrease in fat storage, we examined and quantified the amount of fat tissue present in Id4−/− and WT animals fed the EFD for 6 weeks. Gross pathological examination showed that Id4−/− mice maintained on an EFD have less WAT and BAT than WT mice (Fig. 6A). To confirm this apparent reduction, we quantified the percentage of body fat by MRI (Fig. 6B). We found that the average percentage of body fat weight in Id4−/− mice after 6 weeks on EFD was ∼63% less than that observed in WT animals (Fig. 6C). MRI examination also documented that the difference in the percentage of body fat of animals fed these two diets was higher in WT than Id4−/− animals (Fig. 6E). The body weights of WT and Id4−/− mice fed the EFD for 6 weeks was normalized to their initial weight and evaluated during the course of this experiment. We found that Id4−/− animals gained significantly less weight than did their WT counterparts when fed the EFD (Fig. 6D). Because Id4−/− animals showed a decrease in fat storage when maintained on a diet enriched for fat, we decided to challenge these mice with a diet that had even higher levels of fat content compared with the EFD, a high fat diet. We placed WT and Id4−/− mice on the HFD containing less carbohydrates and the same amount of proteins as are found in regular chow and EFDs but with more than twice the amount of fat contained in the EFD for 6 weeks. We weighed WT and Id4−/− mice during the period of time they were fed the HFD and observed an obvious difference in the size of Id4−/− and WT mice after 6 weeks (data not shown). Id4−/− mice gained significantly less weight than did their WT littermates when fed this diet (Fig. 6F). These findings indicate that the decrease in fat storage caused by the absence of Id4 was accentuated when the animals were fed diets enriched for fats.
FIGURE 6.
Adipose tissue in Id4−/− mice fed diets with increased fat content. A, WAT in the visceral fat pad (closed arrows) and BAT in the interscapular area (open arrows) of representative WT and Id4−/− mice after 6 weeks on an EFD are shown. B, representative panels of axial MRI sections of WT and Id4−/− mice after 6 weeks on EFD (n = 5 mice per genotype). Fat appears as a bright white image. C, percent body fat estimated by MRI. The average percentage of body fat, calculated as described under “Experimental Procedures,” is shown (n = 5 mice per genotype). Values are mean ± S.E. D, percentage of weight increase compared with initial weight of WT and Id4−/− mice during 6 weeks on EFD. Data points are the mean ± S.E. (n = 7 mice per genotype). E, ratio of percentage of body fat before and after EFD in WT and Id4−/− mice determined by MRI (n = 4 mice per genotype). F, percentage of weight increase compared with initial weight of WT and Id4−/− mice during 6 weeks on a HFD. Data points are the mean ± S.E. (n = 7 mice per genotype). *, p < 0.05; **, p < 0.01.
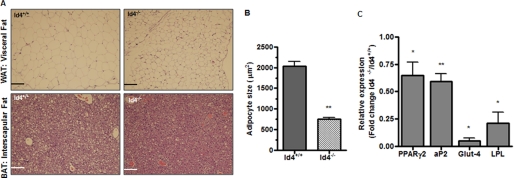
Previously, we observed that adipocytes from Id4−/− animals fed on regular chow were reduced in size compared with adipocytes from WT animals (Fig. 3E). To investigate if the reduced weight gain by Id4−/− was associated with morphological alterations in adipose tissue, we analyzed histological sections of WAT and BAT from Id4−/− and WT animals fed the EFD for 6 weeks. These analyses revealed that adipocytes from Id4−/− mice appeared smaller in size than those from WT mice (Fig. 7A). To quantify the size of adipocytes in white adipose tissue from Id4−/− and WT mice, we measured the area of the exposed surface in histological sections of WAT. We observed that the mean area of Id4−/− adipocytes was ∼40% the area observed in cells from WT mice (Fig. 7B). Similar to the differences in body fat that we observed on MRI examination (Fig. 3C and Fig. 6C), we found that the decreased adipocyte size in Id4−/− mice fed the EFD (Fig. 7B) was greater than the difference observed in WAT from these mice maintained on a regular chow diet (Fig. 3E). We also found that mRNA expression levels of markers of adipocyte differentiation PPARγ2, aP2, Glut-4, and lipoprotein lipase in WAT from Id4−/− mice fed an EFD for 6 weeks were significantly decreased (Fig. 7C).
FIGURE 7.
Effect of EFD on Id4−/− mice. A, hematoxylin and eosin-stained histological sections of WAT and BAT from WT and Id4−/− mice fed an EFD for 6 weeks. Original magnification was ×20; scale bars, 100 μm. B, mean surface area of adipocytes (μm2) from WT and Id4−/− mice fed an EFD for 6 weeks. The adipocyte size shown is the mean ± S.E. area of 200 adipocytes per histological section from three different histological sections of three different animals of each genotype. Values are mean ± S.E. C, PPARγ2, aP2, Glut-4, and lipoprotein lipase (LPL) mRNA levels in WAT from WT and Id4−/− mice determined by qRT-PCR in animals fed an EFD for 6 weeks (n = 3 mice per genotype). Cyclophilin was used as endogenous control for the qRT-PCR. *, p < 0.05; **, p < 0.01.
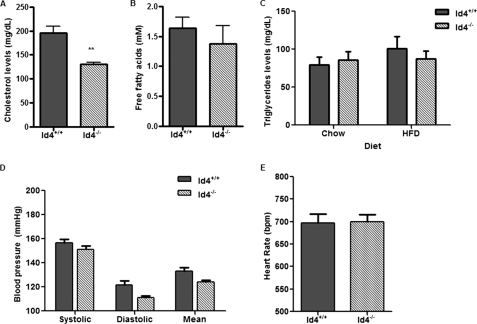
Genetic alterations in the PPARγ gene have been associated with important changes in fat homeostasis, blood pressure, and heart rate in mice and humans (12, 29, 30). To assess the effects of Id4 deletion on circulating fat in animals fed a HFD, we evaluated the levels of serum cholesterol, free fatty acids, and triglycerides in Id4−/− and WT animals after 6 weeks on the HFD (Fig. 8, A–C). We observed a significant reduction of serum cholesterol levels in Id4−/− mice compared with WT animals. Despite showing reduced serum cholesterol levels, Id4−/− animals did not exhibit a significant difference in triglycerides or free fatty acid levels when compared with levels in WT mice even after being fed a HFD. We also examined if Id4 deletion played a role in the regulation of blood pressure and heart rate in these animals (Fig. 8, D and E). Although no significant differences were identified, the systolic, diastolic, and mean blood pressures suggested a trend toward lower levels in the Id4−/− compared with WT mice (Fig. 8D).
FIGURE 8.
Effect of HFD on Id4−/− mice. A, serum cholesterol levels of WT and Id4−/− mice fed a HFD for 6 weeks (n = 5 mice per genotype). B, serum-free fatty acid levels of WT and Id4−/− mice fed a HFD for 6 weeks (n = 6 mice per genotype). C, serum triglycerides levels of WT and Id4−/− mice before and after being fed a HFD for 6 weeks (n = 8 mice per genotype). Blood pressure (D) and heart rate (E) measurements in WT and Id4−/− mice determined by the tail-cuff method. Determinations were made 30 times per day every other day during a 2-week period. The bars correspond to the mean ± S.E. of 5 days of measurements (n = 6 mice per genotype). **, p < 0.01.
DISCUSSION
ID4 belongs to a family of transcription factors that act as dominant negative inhibitors of bHLH transcription factors, which are key mediators of tissue-specific transcriptional activity in many different tissues throughout the body (31). The best characterized function of Id genes, their inhibition of cellular differentiation, has been widely characterized in vitro. For example, Id1, Id2, and Id3 expression decreases during in vitro adipose differentiation of 3T3-F442A cells, and constitutive expression of ID3 can block adipocyte differentiation (32). Consistent with such a view of Id gene function are observations demonstrating that in mature, differentiated tissues, the expression of the Id family of genes tends to be low, although in some stem cell populations their expression is high (33–35).
In apparent contrast to this inhibitory role for the Id family of genes, a more limited number of observations have suggested a role for ID family members in supporting lineage-specific differentiation (18, 22, 34, 36, 37). Both ID2 and ID4 have been shown to be induced in various cell culture systems during adipocyte differentiation in vitro (18, 22). Also, our evaluation of cells during adipocyte differentiation induced by treatment with dexamethasone, 3-isobutyl-1-methylxanthine, and insulin demonstrated that ID4 expression facilitates adipocyte maturation and fat production (Figs. 1, 2, and 5). In these experiments, we observed that mRNA levels of both C/EBPα and PPARγ2, important regulators of adipocyte differentiation, were reduced in Id4−/− MEFs when compared with WT cells, suggesting that ID4 modulates the expression of these key regulators (Fig. 5). In contrast to the observation that some Id genes are not found to be expressed in some mature tissues, Id2 and Id4 expression can be detected in adipose tissue of adult mice and humans (18, 22). Also, gene expression analysis of WAT from Id4−/− animals demonstrated that, in the absence of Id4, the expression levels of C/EBPα and PPARγ were reduced in vivo just as they were decreased in the absence of Id4 in vitro (Fig. 4A). Along with the observation of decreased adipocyte size (Fig. 3E) and decreased levels of expression of adipocyte markers in tissues of Id4−/− mice (Fig. 4A), these findings strongly support the interpretation that ID4 expression is critical for normal adipocyte differentiation in vivo.
ID4 expression is clearly permissive of adipocyte differentiation (Fig. 1), raising the issue of what molecular events mediate this activity. One possibility is the well described role of Id proteins in enhancing cellular proliferation that can occur as the result of Id genes inhibiting the expression of inhibitors of proliferation, such as p21 and p27 (38, 39). In vitro, adipocyte differentiation requires an initial period of proliferation, during which time epigenetic alterations important for differentiated gene expression may occur (8, 40). Alternatively, ID4 might act to inhibit bHLH molecules that function to limit adipocyte differentiation. A few molecules have been identified as potential inhibitors of adipocyte differentiation in vitro (41, 42). In addition, the finding that ID2 fosters neuronal maturation by inactivating HES, a bHLH transcription factor that inhibits neuronal differentiation, is suggestive of this possibility (34). Consistent with a pro-adipogenic role of Id proteins is the observation by others that ID2 expression in pre-adipocytes promotes PPARγ expression (18), although the mechanism mediating this activity of ID2 is unknown.
Inhibition of ID2 in vitro, like inhibition of ID4, disrupts adipocyte differentiation (18, 22). ID2 regulates fat metabolism in adipose tissue and liver, and the loss of Id2 leads to decreased adipogenesis, both in vitro and in vivo (18, 21). Like ID4, loss of ID2 in vivo severely compromised adipose tissue formation but does not block it completely. These findings provide strong evidence indicating that ID2 and ID4 play complementary rather than redundant roles in adipogenesis. In vivo, the expression of both these Id family proteins is required for normal adipose tissue formation, and animals in which the expression of either gene is inhibited have abnormal adipose tissue development (Fig. 3) (18).
Loss of Id4 function greatly inhibited weight gain in animals exposed to diets with both modestly elevated and high fat content (Fig. 6). We observed differences in both white and brown fat tissue not only in adult animals (Fig. 6A) but also in very young animals (data not shown). These findings are consistent with our observations that ID4 is a critical regulator of adipocyte differentiation (Figs. 1, 2, and 5), and they are in agreement with previous observations that animals with impaired adipose tissue development are protected from adipocyte hypertrophy when fed a HFD (5). WAT isolated from Id4−/− animals had a reduction in adipocyte size (Fig. 3E and Fig. 7B), which could reflect either a primary disorder of adipocyte size determination or altered fatty acid metabolism in Id4−/− adipose tissue. Ultimately it will be important to understand the fate of dietary fat in Id4−/− animals to understand the possible roles of reduced fat absorption, decreased fatty acid synthesis, and altered fatty acid oxidation in contributing to the phenotype we observe. Also, it will be of considerable interest to determine whether inhibition of ID4 in adult animals is sufficient to inhibit weight gain, as alterations in adipose tissue function in other settings leads to a broad variety of metabolic disorders, including obesity, insulin resistance, and hyperlipidemia (4). If inactivation of ID4 can inhibit weight gain induced by diet, exploring therapeutic strategies to inhibit ID4 may also impact the treatment of diabetes and hypertension, key aspects of a widely observed metabolic syndrome (1, 43).
Acknowledgments
We thank Sarah Gilman and Karen Moodie for assistance in the conduct of this research, and we are very appreciative of Drs. William Kinlaw III, Gustav Lienhard, and Ta Yuan Chang for their review of our manuscript and thoughtful suggestions.
This work was supported by The Theodora B. Betz Foundation (to M. A. I.).
- C/EBP
- CCAAT/enhancer-binding protein
- PPAR
- peroxisome proliferator-activated receptor
- MEF
- mouse embryonic fibroblast
- WT
- wild type
- qRT
- quantitative PCR
- ELISA
- enzyme-linked immunosorbent assay
- MRI
- magnetic resonance imaging
- WAT
- white adipose tissue
- BAT
- brown adipose tissue
- bHLH
- basic HLH helix-loop-helix
- EFD
- enriched fat diet
- HFD
- high fat diet
- shRNA
- small hairpin RNA.
REFERENCES
- 1.Laclaustra M., Corella D., Ordovas J. M. (2007) Nutr. Metab. Cardiovasc. Dis. 17, 125–139 [DOI] [PubMed] [Google Scholar]
- 2.Trayhurn P. (2005) Acta Physiol. Scand. 184, 285–293 [DOI] [PubMed] [Google Scholar]
- 3.Rosen E. D., Walkey C. J., Puigserver P., Spiegelman B. M. (2000) Genes Dev. 14, 1293–1307 [PubMed] [Google Scholar]
- 4.Kopelman P. G. (2000) Nature 404, 635–643 [DOI] [PubMed] [Google Scholar]
- 5.Reue K., Phan J. (2006) Curr. Opin. Clin. Nutr. Metab. Care 9, 436–441 [DOI] [PubMed] [Google Scholar]
- 6.Farmer S. R. (2006) Cell Metab 4, 263–273 [DOI] [PMC free article] [PubMed] [Google Scholar]
- 7.Morrison R. F., Farmer S. R. (1999) J. Cell. Biochem. 32, 59–67 [DOI] [PubMed] [Google Scholar]
- 8.Zuo Y., Qiang L., Farmer S. R. (2006) J. Biol. Chem. 281, 7960–7967 [DOI] [PubMed] [Google Scholar]
- 9.Wu Z., Rosen E. D., Brun R., Hauser S., Adelmant G., Troy A. E., McKeon C., Darlington G. J., Spiegelman B. M. (1999) Mol. Cell 3, 151–158 [DOI] [PubMed] [Google Scholar]
- 10.Barak Y., Nelson M. C., Ong E. S., Jones Y. Z., Ruiz-Lozano P., Chien K. R., Koder A., Evans R. M. (1999) Mol. Cell 4, 585–595 [DOI] [PubMed] [Google Scholar]
- 11.Rosen E. D., Sarraf P., Troy A. E., Bradwin G., Moore K., Milstone D. S., Spiegelman B. M., Mortensen R. M. (1999) Mol. Cell 4, 611–617 [DOI] [PubMed] [Google Scholar]
- 12.Duan S. Z., Ivashchenko C. Y., Whitesall S. E., D'Alecy L. G., Duquaine D. C., Brosius F. C., 3rd, Gonzalez F. J., Vinson C., Pierre M. A., Milstone D. S., Mortensen R. M. (2007) J. Clin. Invest. 117, 812–822 [DOI] [PMC free article] [PubMed] [Google Scholar]
- 13.Rosen E. D., Hsu C. H., Wang X., Sakai S., Freeman M. W., Gonzalez F. J., Spiegelman B. M. (2002) Genes Dev. 16, 22–26 [DOI] [PMC free article] [PubMed] [Google Scholar]
- 14.Imagawa M., Tsuchiya T., Nishihara T. (1999) Biochem. Biophys. Res. Commun. 254, 299–305 [DOI] [PubMed] [Google Scholar]
- 15.Rosen E. D., MacDougald O. A. (2006) Nat. Rev. Mol. Cell Biol. 7, 885–896 [DOI] [PubMed] [Google Scholar]
- 16.Jögi A., Persson P., Grynfeld A., Påhlman S., Axelson H. (2002) J. Biol. Chem. 277, 9118–9126 [DOI] [PubMed] [Google Scholar]
- 17.Moldes M., Boizard M., Liepvre X. L., Fève B., Dugail I., Pairault J. (1999) Biochem. J. 344, 873–880 [PMC free article] [PubMed] [Google Scholar]
- 18.Park K. W., Waki H., Villanueva C. J., Monticelli L. A., Hong C., Kang S., MacDougald O. A., Goldrath A. W., Tontonoz P. (2008) Mol. Endocrinol. 22, 2038–2048 [DOI] [PMC free article] [PubMed] [Google Scholar]
- 19.Rahmouni K., Sigmund C. D. (2008) Circ. Res. 103, 565–567 [DOI] [PMC free article] [PubMed] [Google Scholar]
- 20.Grønning L. M., Tingsabadh R., Hardy K., Dalen K. T., Jat P. S., Gnudi L., Shepherd P. R. (2006) Am. J. Physiol. Endocrinol. Metab. 290, E599–E606 [DOI] [PubMed] [Google Scholar]
- 21.Hou T. Y., Ward S. M., Murad J. M., Watson N. P., Israel M. A., Duffield G. E. (2009) J. Biol. Chem. 284, 31735–31745 [DOI] [PMC free article] [PubMed] [Google Scholar]
- 22.Chen H., Weng Y. C., Schatteman G. C., Sanders L., Christy R. J., Christy B. A. (1999) Biochem. Biophys. Res. Commun. 256, 614–619 [DOI] [PubMed] [Google Scholar]
- 23.Yun K., Mantani A., Garel S., Rubenstein J., Israel M. A. (2004) Development 131, 5441–5448 [DOI] [PubMed] [Google Scholar]
- 24.Haase A., Frahm J., Hänicke W., Matthaei D. (1985) Phys. Med. Biol. 30, 341–344 [DOI] [PubMed] [Google Scholar]
- 25.Chen H. C., Farese R. V., Jr. (2002) J. Lipid Res. 43, 986–989 [PubMed] [Google Scholar]
- 26.Green H., Meuth M. (1974) Cell 3, 127–133 [DOI] [PubMed] [Google Scholar]
- 27.Abate N., Burns D., Peshock R. M., Garg A., Grundy S. M. (1994) J. Lipid Res. 35, 1490–1496 [PubMed] [Google Scholar]
- 28.Kubota N., Terauchi Y., Miki H., Tamemoto H., Yamauchi T., Komeda K., Satoh S., Nakano R., Ishii C., Sugiyama T., Eto K., Tsubamoto Y., Okuno A., Murakami K., Sekihara H., Hasegawa G., Naito M., Toyoshima Y., Tanaka S., Shiota K., Kitamura T., Fujita T., Ezaki O., Aizawa S., Kadowaki T., et al. (1999) Mol. Cell 4, 597–609 [DOI] [PubMed] [Google Scholar]
- 29.Sattler F. R., Qian D., Louie S., Johnson D., Briggs W., DeQuattro V., Dube M. P. (2001) AIDS 15, 2001–2010 [DOI] [PubMed] [Google Scholar]
- 30.Tsai Y. S., Kim H. J., Takahashi N., Kim H. S., Hagaman J. R., Kim J. K., Maeda N. (2004) J. Clin. Invest. 114, 240–249 [DOI] [PMC free article] [PubMed] [Google Scholar]
- 31.Ruzinova M. B., Benezra R. (2003) Trends Cell Biol. 13, 410–418 [DOI] [PubMed] [Google Scholar]
- 32.Moldes M., Lasnier F., Fève B., Pairault J., Djian P. (1997) Mol. Cell. Biol. 17, 1796–1804 [DOI] [PMC free article] [PubMed] [Google Scholar]
- 33.Chen Y., Wu H., Wang S., Koito H., Li J., Ye F., Hoang J., Escobar S. S., Gow A., Arnett H. A., Trapp B. D., Karandikar N. J., Hsieh J., Lu Q. R. (2009) Nat. Neurosci. 12, 1398–1406 [DOI] [PMC free article] [PubMed] [Google Scholar]
- 34.Havrda M. C., Harris B. T., Mantani A., Ward N. M., Paolella B. R., Cuzon V. C., Yeh H. H., Israel M. A. (2008) J. Neurosci. 28, 14074–14086 [DOI] [PMC free article] [PubMed] [Google Scholar]
- 35.Liu C. J., Ding B., Wang H., Lengyel P. (2002) Mol. Cell. Biol. 22, 2893–2905 [DOI] [PMC free article] [PubMed] [Google Scholar]
- 36.Du Y., Yip H. (2009) Differentiation 79, 84–92 [DOI] [PubMed] [Google Scholar]
- 37.Carey J. P., Asirvatham A. J., Galm O., Ghogomu T. A., Chaudhary J. (2009) BMC Cancer 9, 173. [DOI] [PMC free article] [PubMed] [Google Scholar]
- 38.Ciarapica R., Annibali D., Raimondi L., Savino M., Nasi S., Rota R. (2009) Oncogene 28, 1881–1891 [DOI] [PubMed] [Google Scholar]
- 39.Prabhu S., Ignatova A., Park S. T., Sun X. H. (1997) Mol. Cell. Biol. 17, 5888–5896 [DOI] [PMC free article] [PubMed] [Google Scholar]
- 40.Tang Q. Q., Otto T. C., Lane M. D. (2003) Proc. Natl. Acad. Sci. U.S.A. 100, 44–49 [DOI] [PMC free article] [PubMed] [Google Scholar]
- 41.Gulbagci N. T., Li L., Ling B., Gopinadhan S., Walsh M., Rossner M., Nave K. A., Taneja R. (2009) EMBO Rep. 10, 79–86 [DOI] [PMC free article] [PubMed] [Google Scholar]
- 42.Ross D. A., Rao P. K., Kadesch T. (2004) Mol. Cell. Biol. 24, 3505–3513 [DOI] [PMC free article] [PubMed] [Google Scholar]
- 43.Hotamisligil G. S., Erbay E. (2008) Nat. Rev. Immunol. 8, 923–934 [DOI] [PMC free article] [PubMed] [Google Scholar]


