Abstract
A prototype time-of-flight (TOF) PET scanner based on cerium-doped lanthanum bromide [LaBr3 (5% Ce)] has been developed. LaBr3 has high light output, excellent energy resolution, and fast timing properties that have been predicted to lead to good image quality. Intrinsic performance measurements of spatial resolution, sensitivity, and scatter fraction demonstrate good conventional PET performance; the results agree with previous simulation studies. Phantom measurements show the excellent image quality achievable with the prototype system. Phantom measurements and corresponding simulations show a faster and more uniform convergence rate, as well as more uniform quantification, for TOF reconstruction of the data, which have 375-ps intrinsic timing resolution, compared to non-TOF images. Measurements and simulations of a hot and cold sphere phantom show that the 7% energy resolution helps to mitigate residual errors in the scatter estimate because a high energy threshold (>480 keV) can be used to restrict the amount of scatter accepted without a loss of true events. Preliminary results with incorporation of a model of detector blurring in the iterative reconstruction algorithm show improved contrast recovery but also point out the importance of an accurate resolution model of the tails of LaBr3’s point spread function. The LaBr3 TOF-PET scanner has demonstrated the impact of superior timing and energy resolutions on image quality.
Keywords: Time-of-flight PET, lanthanum bromide
1. Introduction
Time-of-flight (TOF) positron emission tomography (PET) was first proposed in the 1980s (Ter-Pogossian et al 1982, Gariod et al 1982, Mullani et al 1984, Wong et al 1984, Lewellen et al 1988, Mazoyer et al 1990) to improve the noise characteristics of PET images but fell out of favor because the fast scintillators available had poor conventional imaging performance. In addition, the main applications of PET at the time were for brain and cardiac imaging, which benefited more from the high count-rate capability of the available non-TOF scintillators than from the noise reduction associated with TOF imaging. Over the past few years there has been renewed interest in TOF-PET imaging (Moses 2002, Surti et al 2003) due to the availability of fast scintillators that also have high light output and high stopping power. Whole-body oncology imaging with [18F]fluorodeoxyglucose (FDG), now the main application of PET, is also well-suited to TOF imaging and can take advantage of the increased TOF benefit for large patients. A commercially available TOF-PET scanner (Philips Gemini TF) based on yttrium-doped lutetium oxyorthosilicate (LYSO) detectors was introduced in 2006 (Surti et al 2007). The scanner is a fully three-dimensional (3D) system that achieves high conventional imaging performance with an intrinsic timing resolution of ~600 ps (system average) that permits TOF reconstruction. In the last few years the other major PET manufacturers have developed TOF-PET systems as well. The performance of a prototype Siemens PET/CT scanner with TOF capability based on LSO detectors has recently been reported (Jakoby et al 2008). In addition, GE Medical Systems has introduced a TOF-PET system based on LYSO detectors (Turkington et al 2009, Kemp et al 2009). The timing resolution of these systems is in the same 550–600 ps range as that of the Philips Gemini TF.
Metrics to describe the benefit of TOF on image variance have been previously derived (Tomitani 1981, Budinger 1983); based on these metrics, the variance benefit of TOF is predicted to increase as the timing resolution (Δτ) decreases. While these metrics were derived for an analytical reconstruction algorithm of a uniform activity distribution and do not include the other benefits of TOF that are less easily quantified (e.g., faster and more uniform convergence of iterative reconstructions) (Karp et al 2008), they have nonetheless been shown to be useful to predict global TOF performance gains (Surti et al 2006). Wong et al (1983) also predicted increased signal-to-noise (SNR) ratio with improved timing resolution, again for uniform distributions and analytical reconstruction. To take further advantage of this TOF benefit, we have developed a TOF-PET system based on LaBr3 crystals, which have a faster decay time and higher light output than LSO or LYSO; together, these characteristics improve the timing resolution of LaBr3 over that of LSO or LYSO. The salient characteristics of the various scintillators used in PET systems are listed in table 1. The ideal scintillator would have a high light output for good energy resolution and scatter rejection as well as good timing resolution, a high stopping power (as reflected by the linear attenuation coefficient μ) for both high sensitivity and good spatial resolution, and a fast decay time (τ) for good count rate performance and TOF measurements. As can be seen in table 1, LaBr3 is both fast and bright, but it has the drawback of a lower stopping power than some other scintillators used for PET.
Table 1.
Common scintillators for PET imaging.
| Scintillator | Decay time τ (ns) | Attenuation coefficient μ (cm−1) | Light output (photons/MeV) |
|---|---|---|---|
| NaI(Tl) | 230 | 0.35 | 41,000 |
| BGO | 300 | 0.95 | 7,000 |
| GSO | 60 | 0.70 | 10,000 |
| BaF2 | 2 | 0.45 | 2,000 |
| LYSO, LSO | 40 | 0.86–0.90 | 26,000 |
| LaBr3 | 21 | 0.47 | 60,000 |
LaBr3 doped with Ce (0.5%) was first investigated by van Loef et al (2001) at Delft University, followed by the group at Radiation Monitoring Devices (Shah et al 2003), who found improved timing resolution with increased Ce concentration. For small crystals with 5% Ce doping, the timing resolution was found to be 260 ps full-width at half-maximum (FWHM), and the energy resolution at 511 keV was better than 4% FWHM. Our group has developed arrays of LaBr3 (5% Ce) in cooperation with Saint Gobain Crystals (Newbury, OH). Kuhn et al (2004) showed that an Anger-logic array of 4 × 4 × 30 mm3 LaBr3 (5% Ce) crystals coupled via a continuous light guide to a large hexagonal array of 51-mm photomultiplier tubes (PMTs) could achieve a timing resolution of 313 ps FWHM and an average energy resolution at 511 keV of 5.1% FWHM. Although there is a modest degradation in performance of a large array of crystals indirectly coupled to the PMTs through a light guide compared with that for small, individual crystals coupled directly to the PMTs, those results demonstrated the feasibility of building a scanner based on arrays of LaBr3 crystals.
Several simulation studies (Surti et al 2004, Surti et al 2006) were performed to predict the performance of a LaBr3-based whole-body PET system. Surti et al (2004) used Monte Carlo simulation tools to examine the non-TOF performance of such a system and compared it with that for scanners with LSO or gadolinium oxyorthosilicate (GSO) crystals. The conventional imaging performance was found to be good for LaBr3 in simulation, in contrast with older TOF-PET scanners based on BaF2 or CsF. The sensitivity and spatial resolution are lower than those obtained with a LSO scanner, but for a given crystal-PMT array configuration the count-rate capability is superior and takes advantage of reduced pile-up due to the fast decay of LaBr3. When the lower stopping power of LaBr3 was partially compensated by using longer crystals and a larger axial field of view (FOV), the noise equivalent count (NEC) rate (Strother et al 1990) achievable with LaBr3 was seen to be higher than that with LSO; these simulations demonstrated that the lower sensitivity of LaBr3 is partially offset by its lower scatter and randoms fractions because the better energy resolution allows a higher low energy threshold (LET) to be used. In addition, the high light output and fast decay allow the use of large PMTs: rather than the 39-mm PMTs used on the Gemini TF scanner with LYSO detectors, 51-mm PMTs were selected for both practical reasons and for their very good timing performance. This choice defines the count-rate performance, both deadtime and pulse pile-up characteristics, of the scanner. It was also observed with the simulations that while the spatial resolution with LaBr3 is somewhat worse than that for LSO at low count rates, the spatial resolutions for the two scintillators for a fixed crystal-PMT configuration without pulse pile-up correction are comparable at high count rates because pulse pile-up effects are less significant at high activities with LaBr3 due to its faster decay time. There is also lower deadtime due to the faster decay time with LaBr3.
In this work, we present intrinsic performance measurements of a prototype LaBr3-based TOF-PET system. In addition, the relative impact of timing and energy resolutions are also studied through simulations in order to isolate the different physical characteristics of the crystal.
2. Materials and Methods
2.1. Scanner
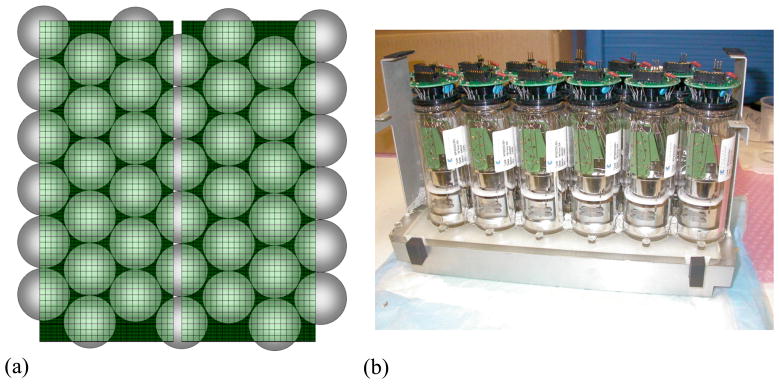
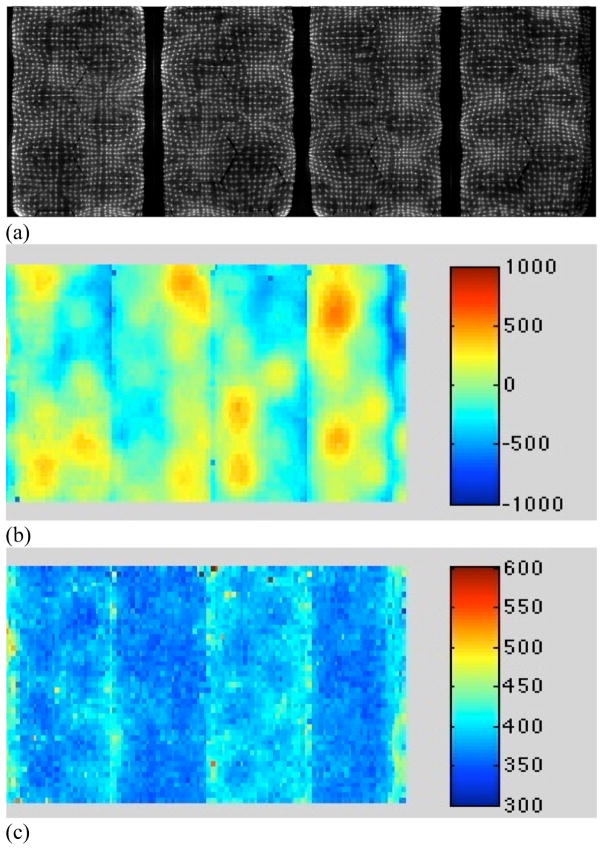
The LaBr3 system comprises modules of 1620 4 × 4 × 30 mm3 LaBr3 (5% Ce) crystals built by Saint Gobain Crystals, coupled through a continuous, 8-mm thick light guide with a 5-mm thick glass hermetic seal to a hexagonal array of 51-mm Photonis XP20D0 PMTs. The crystals are arranged in a rectangular grid (27 × 60) and isolated from each other by white reflective powder; the crystal pitch is 4.3 mm. Each module is imaged by 24 PMTs, 12 of which are coupled exclusively to that module and 12 of which are shared with neighboring modules (see figure 1). A complete scanner consists of 24 detector modules with 432 PMTs: 6 PMT rows in the axial direction and 72 PMT columns around the ring. The ring diameter of the scanner is 93 cm; the axial FOV is 25 cm, although it is currently limited to 19.35 cm by the number of available electronic channels, with only five of the six axial PMT rows currently being utilized. Figure 2(a) shows a two-dimensional positioning flood for four modules. This is used to correct for positioning non-linearities and shows the good discrimination among all crystals in the array.
Figure 1.
LaBr3 detector module. (a) Schematic showing adjacent modules with overlapping PMTs. (b) Photograph of a single module with PMTs and 8-mm thick light guide. There are 1620 crystals per module. Only five of the six possible axial rows of PMTs are currently used due to limitations in the number of available electronic channels.
Figure 2.
Typical position and timing performance of LaBr3 detectors. (a) 2D position flood map for four modules. (b) Timing offset map for four of the 24 modules. The range of timing offset factors is ±1 ns (red to dark blue), since no hardware adjustments have been made for PMT transit times. The major source of bias in the timing offsets is differences in timing at the PMT level (large areas of non-uniformity visible). (c) Timing resolution map for the same four modules after the crystal-based (software) timing offset correction. The timing resolution is fairly uniform (light to dark blue) with an average (system) timing resolution over all 24 detectors of 375 ps.
2.2. Electronics
The LaBr3 system was developed in parallel with the Philips Gemini TF, and we adapted the commercial electronics for use in our system. However, to optimize the timing resolution we found that we needed to modify the trigger electronics, which only allowed one trigger zone for each detector module. We developed new trigger electronics with each trigger determined by signals from seven PMTs added together, and the trigger time is calculated as the time this analog sum signal crosses a programmable trigger threshold. The seven PMTs nearest the hit crystal collect most (80–93%) of the emitted light, and each group of seven PMTs sees light only from a portion of the crystals in the module. The seven-PMT design is “local” in the sense that each PMT may contribute to several different sets of seven PMTs; the triggers overlap each other, and the most light will generally be collected by the set of seven closest to the hit crystal. The PMT in the gap between modules and the edge PMTs with only three neighbors are not used as centers of local trigger zones. Smaller trigger zones have been found to improve timing resolution at low count rates due to reduced noise from only seven PMTs and at high rates due to reduced pulse pile-up from near-simultaneous events. Details on the electronics are given in (Kyba et al 2008). With these electronics, a system timing resolution of 375 ps FWHM has been achieved, compared to 460-ps timing resolution achieved with the original trigger electronics (Karp et al 2005). However, since we removed delay-lines from the original electronics, which led to degraded signal rise-times, we lost the ability to correct for PMT transit time differences in hardware; this affects the timing resolution, since the trigger now has (timing) mis-matched PMTs. Thus, we have not yet reached the best possible system timing resolution, which should approach 313 ps as demonstrated with bench top measurements (Kuhn et al 2004).
The transit time in a crystal varies from crystal to crystal, depending on which PMT is closest to the crystal and the crystal’s position in the local trigger zone centered on that PMT. Therefore, it is necessary to calibrate these timing offsets to obtain accurate TOF measurements. A low-activity, rotating line source whose location is known is used to perform this calibration. It is assumed that the absolute time offsets for each crystal are independent, so the bias in the measurement of the TOF difference for a given crystal pair is simply the difference of the absolute time biases of each crystal. By using the rotating line source, each crystal in the PET scanner is in coincidence with a reasonably large number of crystals on the opposite side. Therefore, it is not a requirement that the time differences between all crystal pairs be measured. Given the location of the source, the true TOF difference between the arrival times of each annihilation photon can be computed and compared to the measured TOF difference to generate a TOF difference error. A histogram of TOF difference errors is generated for each crystal, and the peak (relative bias) calculated. The location of the peak is subtracted from the bias estimate (assumed to be zero without prior information), and the process is iterated until the crystal timing histograms are all centered about zero. The output is a timing offset correction for each crystal (see figure 2(b)). This correction is written as a look-up table that can be used either in real time or as an off-line timing correction for the measured list-mode data before reconstruction.
The range (minimum to maximum) of timing offset factors for the entire scanner is about ±1 ns, since there is no adjustment in hardware for PMT transit time differences. The major source of bias in the timing offsets is differences in timing at the PMT level, as can be seen from the structure in the timing offset map shown in figure 2(b). As the map of timing resolution values across four modules shows in figure 2(c), the timing resolution is very uniform after timing calibration although there are individual crystals with somewhat poorer timing resolution, especially at the edges of the modules.
Energy calibration is similar to that we have previously developed for non-TOF scanners. A point source in the center of the FOV is used to measure the energy offsets for each crystal and generate a correction table that is applied on-line before the list-mode data are written to disk. With correction, the overall energy resolution for 511-keV photons is 6.5% FWHM. With this energy resolution, the lower energy threshold can be raised to 485 keV without significant loss of trues sensitivity.
As can be seen in figure 2(a), the crystals are easily identified even with large PMTs. Spatial distortion removal is performed by drawing contiguous boundaries between all individual crystals in this flood map and assigning all events within each region to the physical center position of that crystal. A non-conventional sampling method has also been studied (Surti et al 2009) to improve the spatial resolution by sub-sampling the crystal flood map to sample the Compton scattered, inter-crystal events in the detector. This technique was not implemented for the imaging studies reported here.
As was seen with the Gemini TF (Surti et al 2007), the LaBr3 scanner shows a dependence of energy and timing resolutions on count rate, even when local clustering is utilized to limit the number of PMTs used (Kyba et al 2008). This is the result of using large (51-mm) PMTs, which partially offsets the improved count rate capability anticipated from the shorter decay time of LaBr3. Since TOF blurring is modeled during reconstruction, it is important to know the timing resolution for each study. The dependence of timing resolution on singles rate was measured with a central 2.0-MBq (55 μCi) 22Na point source surrounded by decaying 20-cm diameter cylinders; these results are used as a look-up table during reconstruction.
2.3. Reconstruction
Data from the scanner are acquired and stored in list-mode. Prior to reconstruction, the data are corrected for timing offsets as described earlier; this is the only correction applied to the data before reconstruction. An iterative list-mode ordered subsets expectation maximization (OSEM) algorithm (Hudson and Larkin 1994, Parra and Barrett 1998, Reader et al 1998), modified to include TOF modeling (TOF-OSEM) (Popescu et al 2004), is used for reconstruction. Modified Kaiser-Bessel (“blob”) basis functions (Lewitt 1992, Matej and Lewitt 1996) are used rather than voxels to constrain the image to be a continuous function at all stages of reconstruction; the FWHM of the blob function is chosen to match roughly the FWHM measured in the sinogram at the center of the FOV. Attenuation, detector efficiency/normalization, scatter, and random coincidences are incorporated into the system model. Transmission imaging for attenuation correction is accomplished with a rotating point source (740 MBq) of 137Cs located 0.4 cm axially and 33.2 cm radially from the center of the scanner (Smith et al 1997, Daube-Witherspoon et al 2003). Random coincidences are smoothed (Casey 1986) to reduce noise. The single-scatter simulation model (Ollinger 1996, Watson et al 1996, Accorsi et al 2004), extended to include TOF information (Werner et al 2006, Watson 2007), is used to estimate scatter. The FWHM of the Gaussian TOF kernel modeled during reconstruction is chosen to be that measured previously for the singles rate of the study (Daube-Witherspoon et al 2006). Reconstruction is accelerated by using 25–33 chronologically ordered subsets and up to 10 3.6-GHz Intel Xeon dual-processor machines.
2.4. Performance measurements
Some intrinsic performance characteristics of the prototype scanner were measured following the NU2-2001 PET standard of the National Electrical Manufacturers Association (NEMA) (NEMA 2001). Except as noted, all measurements were performed with a LET of 470 keV and a coincidence time window of 5 ns.
2.4.1. Spatial resolution
The spatial resolution was measured with a point source of 18F, located at transverse radial positions of 1 and 10 cm. The data were reconstructed into 1-mm voxels with the 3D-Fourier reprojection (3D-FRP) algorithm (Matej and Lewitt 2001). The NU2-2001 protocol for determining the FWHM was followed. In addition, the point spread function (PSF) response of the scanner was measured in the sinogram by moving the point source out to 20 cm in 5-cm increments. The PSF is of interest in order to incorporate spatial resolution information into the system model to compensate for the detector blurring that results from the lower stopping power of LaBr3.
2.4.2. Sensitivity
The sensitivity was measured using a 70-cm long line source of 18F (20 MBq), encapsulated in aluminum sleeves of varying thicknesses, as described by the NU2-2001 protocol. The sensitivity was measured for LETs between 385 and 485 keV to illustrate the loss of trues sensitivity with increasing LET due to multiple scattering in the detector.
2.4.3. Intrinsic scatter fraction
The intrinsic scatter fraction was measured using a line source of 18F (10–20 MBq), radially offset by 4.5 cm, in a 20-cm diameter, 70-cm long polyethylene cylinder, as specified by the NEMA NU2-2001 protocol. The intrinsic scatter fraction was measured for LETs between 385 and 485 keV. The measurement was also performed using 27- and 35-cm diameter cylinders. These phantom diameters have previously been shown to approximate typical and heavy patients, while a 20-cm diameter cylinder results in count rates more consistent with those for light patients (Surti et al 2007). The calculation of the scatter fraction followed the NU2-2001 protocol; for the larger phantoms, radial bins were set to zero at radii greater than 2 cm beyond the radius of the phantom (i.e., 15.5 cm and 19.5 cm for the 27- and 35-cm diameter cylinders, respectively).
2.5. Phantom measurements
2.5.1. Impact of timing resolution
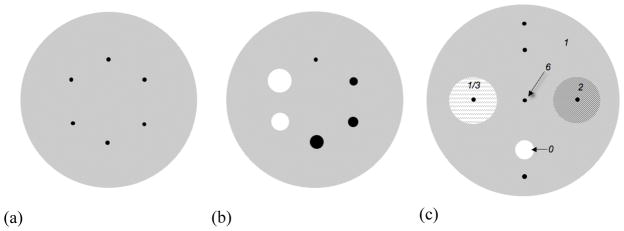
A 35-cm diameter, 30-cm long phantom containing six 10-mm diameter spheres at an 8-cm radius [see figure 3(a)] was positioned in the scanner so that the spheres were located ¼ of the axial FOV from the center of the scanner. The sphere:background activity ratio was 6:1. The background was filled with 185 MBq 18F (0.17 μCi/cc). Eight replicate scans were acquired with 54M prompt+delayed events each. With the current sensitivity of the scanner, it is estimated that the prompt rate for a typical patient study with 3.7 kBq/cc (0.1 μCi/cc) will be 50–75 kcps. While the intrinsic timing resolution of the system is 375 ps, at the count rates for the phantom study the timing resolution was slightly degraded to 400 ps. The randoms fraction was 31%, and the scatter fraction estimated by the single-scatter simulation method was 34%. Attenuation correction was performed by calculated correction for a uniform, 35-cm diameter, water-filled cylinder.
Figure 3.
Schematic drawings of the phantoms used. (a) 35-cm diameter cylinder with six hot 10-mm diameter spheres at an 8-cm radius for measurements of the impact of timing resolution. (b) Phantom used for measurements of the effect of energy resolution and LET. The 10-mm hot lesions of (a) were replaced with four hot spheres (diameters = 10, 13, 17, and 22 mm) and two cold spheres (diameters = 28 and 37 mm). (c) 40-cm diameter cylinder phantom used in the simulation studies. Six 10-mm diameter hot spheres were positioned at various locations in the phantom, including one in a lung-like region (activity = 1/3 that of background) and one in a liver-like region (activity = 2 * background). The hot sphere/background activity ratio was 6:1. A 40-mm diameter cold sphere was also included in the simulation. The attenuation distribution was uniform.
The data were reconstructed with and without TOF using 100%, 75%, 50%, 33%, and 17% of the total acquired data (54M, 41M, 27M, 18M, and 9M coincidences, respectively). The TOF kernel width was 400 ps. In addition, to isolate the effect of timing resolution on contrast/noise performance, the timing resolution of the measured data was degraded in software by adding a random time to the measured time difference to create a data set with 650-ps timing resolution; this value was chosen because it corresponds to the timing resolution of our Gemini TF scanner for a typical patient study. These modified data were reconstructed with a 650-ps TOF kernel.
Circular regions of interest (ROIs) (10-mm diameter) were drawn around each sphere. Annular ROIs (24-mm inner diameter, 7-mm width) were drawn in the background around each sphere, and the local contrast recovery coefficient (CRClocal) was determined from
| (1) |
where H and B were the average counts in the ROIs drawn on the sphere and annulus around the sphere, respectively, and ao was the actual activity ratio (6.0). Background image noise was calculated as the percent standard deviation in a large (8-cm diameter) circular ROI drawn in the center of the phantom in the same slice. The contrast results were averaged over all six spheres and the eight replicates (48 samples); the background noise results were averaged over the eight replicates.
2.5.2. Impact of energy resolution
A 35-cm diameter, 30-cm long phantom containing six spheres with diameters of 10, 13, 17, 22, 28, and 37 mm [see figure 3(b)] was positioned in the scanner so that the spheres were centered in the axial FOV. The four smallest spheres were filled with 18F with a sphere:background activity ratio of 6:1; the two largest spheres were filled with non-radioactive water. The background was filled with 36 MBq 18F (0.032 μCi/cc). The data were acquired with a LET of 380 keV and thresholded in software prior to reconstruction with a LET of 480 keV. A single scan was acquired with 43M prompt+delayed events. The timing resolution for this study was also 400 ps. The randoms fraction was 30%, and the scatter fraction estimated by the single-scatter simulation method was 37%. Attenuation correction was performed by calculated correction as above.
The data were reconstructed with and without TOF with a 400-ps TOF kernel. In addition, to understand better the effect of energy resolution and LET on contrast/noise performance, the original data were degraded in software to 12% energy resolution by adding a random energy to the measured energy of each photon. These data were then thresholded with a 440-keV LET prior to reconstruction; these correspond to the energy resolution and LET of our Gemini TF scanner and resulted in a 49% scatter fraction.
Circular ROIs with diameters equal to the physical sphere diameters were drawn around each sphere. Annular ROIs were drawn in the background around each sphere with a 7-mm gap between the inner diameter and sphere edge and a width of 7 mm; the local contrast recovery coefficient for the hot spheres was determined with (1). For the cold spheres, CRClocal was calculated as 1-C/B, where C was the average value in the ROI drawn on the cold sphere. Background image noise was calculated as the percent standard deviation in a large (8-cm diameter) circular ROI drawn in the center of the phantom.
2.5.3. Resolution modeling
Due to its lower density, the PSF for LaBr3 has longer tails than that of LYSO or LSO. To compensate for this loss of resolution, detector blurring was included in the system model during reconstruction. For an initial evaluation of the efficacy of resolution modeling for the LaBr3 system, a Gaussian function (5.4-mm FWHM) was taken as the model of detector blurring and the measured sphere phantom data were reconstructed with this new system model. When convolved with the blob profile (5-mm radius, 4-mm grid spacing), this gives a FWHM close to the FWHM of the PSF at a 10-cm radius. Since the hot spheres were located at a radius of 8 cm, this non-spatially variant resolution model was taken to represent the blurring of the spheres. However, the PSF of the LaBr3 system is non-Gaussian: the longer tails reflect the lower stopping power and greater subsequent intra-crystal scattering. For a more accurate resolution model, a weighted sum of Gaussian functions with FWHMs of 4.5 and 10.5 mm was used. When convolved with the same blob profile, this matches both the FWHM and FWTM of the PSF at a 10-cm radius and, therefore, would be expected to recover detector resolution losses more completely than the single Gaussian. Contrast/noise analysis was performed as described in section 2.5.1 (but with only one replicate).
2.6. Simulation studies
In order to assess separately the impacts of the improved timing and energy resolutions with LaBr3 on scanner performance, Monte Carlo simulations were performed using an EGS4-based system simulation package (Adam et al 1999, Surti et al 2004). These studies allowed us to differentiate the intrinsic performance capability of LaBr3 from the operational performance of the existing prototype system with its hybrid electronics. A 40-cm diameter, 30-cm long cylinder with six 10-mm diameter spheres was used; the sphere:background activity ratio was 6:1 [(see figure 3(c)]. One of the hot spheres was located in a lung-like 10-cm diameter cylinder with 1/3 of the background activity; another was positioned in a liver-like 10-cm diameter cylinder with an activity twice that of background. The remaining four hot spheres were positioned at various locations in the background. A 40-mm diameter cold sphere was also included. The attenuation distribution was uniform. The timing resolutions studied were 650 ps and 375 ps (intrinsic timing resolution of the LaBr3 system); the data were also reconstructed without TOF information. The energy resolution (LET) combinations simulated were 12% (440 keV) and 7% (490 keV). Ten replicate simulations were performed, each with 70M trues+scatter events (42M trues+scatter events were simulated for the 7% energy resolution case); both trues+scatter events and true events alone were stored and reconstructed.
Circular ROIs (10-mm diameter) were drawn around each hot sphere; a 40-mm diameter ROI was drawn around the cold sphere. Annular ROIs (24-mm inner diameter, 7-mm width) were drawn in the background around each hot sphere; the annulus around the cold sphere had a 54-mm inner diameter and 5-mm width. The local contrast recovery coefficients were determined as above. The background noise was determined from the average of the percent standard deviations in four 8-cm circular ROIs drawn in the uniform background areas. The contrast and noise results were averaged over the 10 replicates.
3. Results
3.1. Performance measurements
3.1.1. Spatial resolution
The average spatial resolution at a 1-cm radius is 5.8 mm FWHM and 12.8 mm FWTM. At a 10-cm radius, the transverse resolution is 6.5 mm FWHM and 14.5 mm FWTM; the axial resolution is 6.3 mm FWHM (14.4 mm FWTM). Surti et al (2009) has recently demonstrated that sub-sampling the crystal map can lead to improvements in spatial resolution on the order of 0.4 mm FWHM near the center of the scanner; however, this sub-sampling technique was not incorporated in the scanner for the imaging studies in this work.
3.1.2. Sensitivity
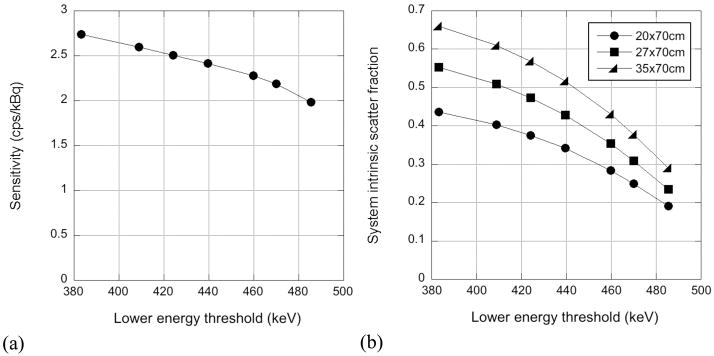
Fig. 4(a) shows the measured sensitivity at the transverse center of the scanner as a function of LET. The sensitivity shows a slow fall-off with increasing LET up to approximately 475 keV. The trues sensitivity of a scanner with a 7% energy resolution would be expected to be constant to ~475 keV; the additional sensitivity at lower LET values is the result of true coincidences that have undergone intra-crystal scattering. Above 475 keV, the sensitivity drops off more markedly as true coincidences are rejected by the LET.
Figure 4.
(a) Sensitivity at the center of the scanner as a function of LET. (b) System scatter fraction as a function of LET for 20-, 27-, and 35-cm diameter cylinders.
3.1.3. Intrinsic scatter fraction
Fig. 4(b) shows the system intrinsic scatter fraction as a function of LET for the three cylinder sizes used. For a 440-keV LET, the scatter fraction ranges between 34% and 52% for the 20- and 35-cm cylinders, respectively. By raising the LET to 470 keV, the scatter fraction can be reduced to 25% and 38%, respectively.
3.2. Phantom measurements
3.2.1. Impact of timing resolution
Figure 5 shows images for one replicate of the measured lesion phantom with 400-ps with TOF (top row) and without TOF (bottom row) reconstruction for different numbers of counts (9 – 54M). The number of iterations for the TOF and non-TOF images shown was chosen to match the noise of the respective full-count reconstructions (far right): four iterations were used for the TOF reconstruction, and six iterations were used for the non-TOF reconstruction. The same number of iterations was used for all count levels shown. It can be seen that the visual detectability of the hot spheres remains high with TOF reconstruction as the number of events decreases, while the spheres are not all visible without TOF even when all counts are used. The visual image quality of the TOF image with 27M events is comparable to the non-TOF image with 54M events.
Figure 5.
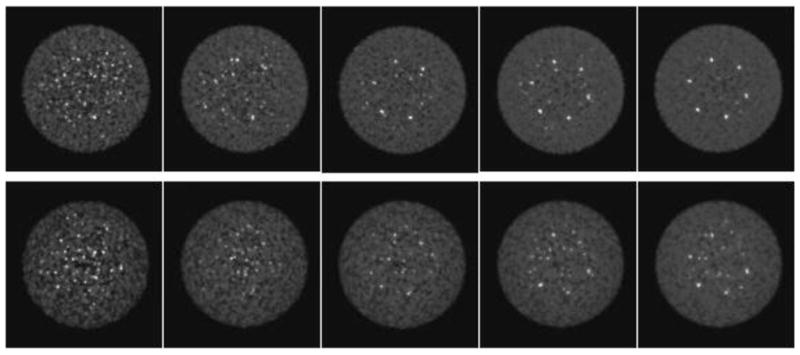
Images from one replicate of measured lesion phantom with 400-ps timing resolution for different count densities (top) with and (bottom) without TOF information. From left to right, the number of coincidences is 9, 18, 27, 41, and 54M. The iterations of the TOF (4) and non-TOF (6) images shown were chosen to match the noise for the 54-Mct reconstructions (and kept the same for the lower count images).
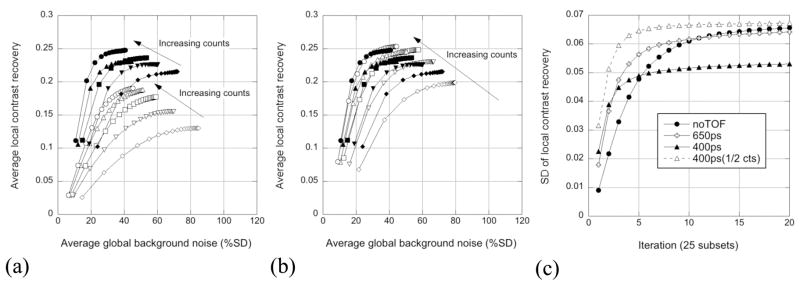
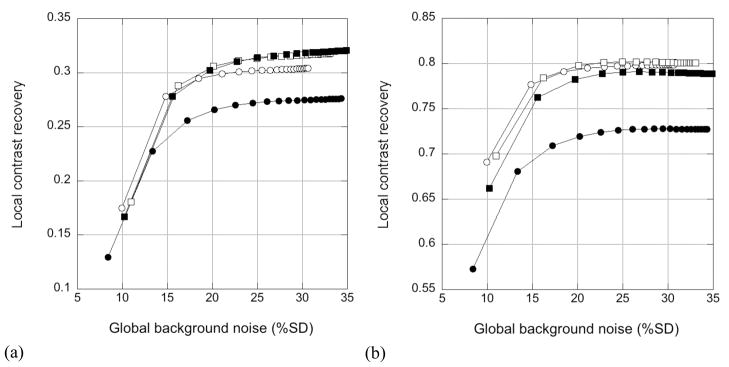
Figure 6 shows the contrast/noise performance for the measured hot lesion phantom, averaged over all 48 replicates of the 10-mm diameter spheres (6 spheres, 8 replicates). Fig. 6(a) shows CRClocal vs. background noise for reconstruction of the 400-ps data; solid symbols are for TOF reconstruction, and open symbols are for non-TOF reconstruction. The individual curves correspond to different numbers of counts. As has been previously observed, faster convergence is seen with TOF reconstruction than without TOF. Higher contrast is seen with TOF reconstruction; this has been observed on the Gemini TF scanner, as well (Surti et al 2007). Figure 6(b) compares results for the 400-ps data (solid symbols) and data degraded in software to 650 ps (open symbols). The average contrast/noise performance is comparable for the two timing resolutions although the 650-ps data are slightly noisier at later iterations and appear to converge somewhat more slowly than the 400-ps data; in addition, the contrast with 650-ps timing resolution is somewhat lower than that for 400-ps timing for the lowest count levels (9M events).
Figure 6.
(a) Contrast/noise performance for 400-ps (solid symbols) and non-TOF reconstruction (open symbols) from measured lesion phantom data. The different symbols represent the performance for the different count levels shown in figure 5. Results shown are averages over the 48 replicate spheres and 8 replicate background ROIs. (b) Contrast/noise performance for 400-ps (solid symbols) and software-degraded 650-ps (open symbols) timing resolutions. (c) SD over the 48 replicate spheres of CRClocal as a function of iteration for the hot spheres for TOF reconstructions of 400-ps and 650-ps data and non-TOF reconstruction from the 54-Mct studies; the result from the 27-Mct study for the 400-ps timing resolution is also shown (open triangles).
Figure 6(c) shows the standard deviation (SD) of CRClocal over the 48 replicate spheres for the full-count (54 Mcts) case. The SD is noticeably smaller for the 400-ps data; variability for the 650-ps data is only slightly less than that without TOF. The variability of the non-TOF and 650-ps data is comparable to that of the 400-ps data with one-half the number of events (open triangles). Therefore, while on average the contrast levels are similar for TOF reconstructions with the two timing resolutions, the variability of the measurement decreases with better timing resolution.
3.2.2. Impact of energy resolution
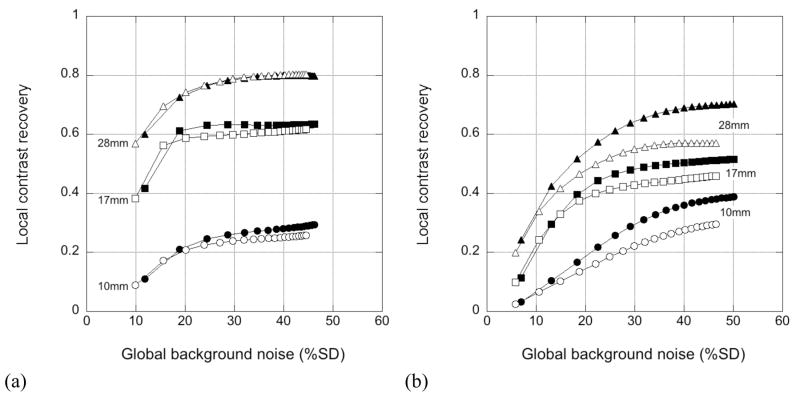
Fig. 7 shows the contrast/noise performance from the measured sphere phantom study for the 10- and 17-mm hot spheres and 28-mm cold sphere with and without TOF reconstruction. The solid symbols are the results for the measured data with 7% energy resolution and a 480-keV LET; the open symbols are the results for the data blurred in software to 12% energy resolution with a 440-keV LET. The contrast/noise performance of the other spheres (not shown) was similar. Differences in the contrast/noise performance for the two energy resolutions studied are small, although they are more apparent without TOF. Because of the more local nature of the TOF reconstruction, we postulate that TOF images are less sensitive to errors in the scatter estimate than non-TOF reconstructions.
Figure 7.
Impact of energy resolution and LET on measured hot and cold sphere phantom data. CRClocal vs. background noise curves are shown for 10- and 17-mm hot and 28-mm cold spheres (a) with TOF (400 ps) and (b) without TOF reconstruction. The solid symbols are for the measured data with 7% energy resolution and 480-keV LET; the open symbols are for the data blurred in software to 12% energy resolution with a 440-keV LET.
3.2.3. Resolution modeling
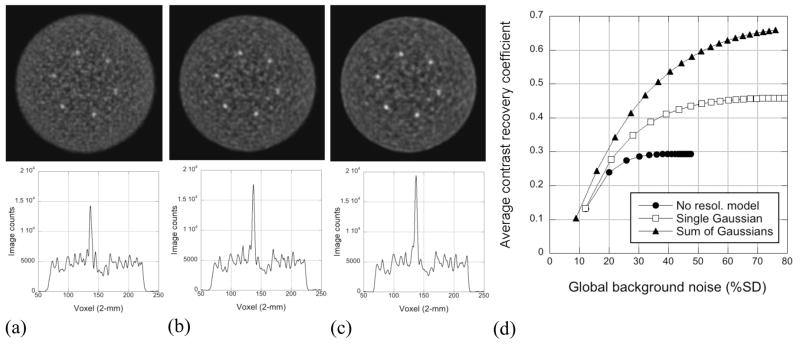
Figure 8(a–c) shows images of the measured 35-cm lesion phantom without (a) and with resolution modeling with a single Gaussian (b) and a sum of Gaussian functions (c). The iteration numbers shown were chosen to match the background noise. Horizontal profiles (6-mm wide) through the topmost hot sphere are shown below each image. Figure 8(d) shows CRClocal vs. noise performance where the contrast values are averages over the 6 spheres. Including a simple Gaussian resolution model leads to CRClocal values ~2 times higher than those without resolution modeling at fixed noise. Using a sum of Gaussians further increases the contrast but leads to a hint of possible overshoot artefacts near the edge of the phantom although these are not seen over the noise in the profile.
Figure 8.
Effect of resolution modeling on the lesion phantom. Images for one replicate with 54 Mcts are shown at comparable noise levels for (a) no resolution modeling (5 iterations), (b) a single Gaussian model with narrower blobs (4 iterations), and (c) a sum of Gaussians model, also with narrower blobs (5 iterations). Horizontal, 6-mm wide profiles through the topmost sphere are shown below the images. The contrast/noise performance for this study is shown in (d).
3.3. Simulation studies
3.3.1 Impact of timing resolution
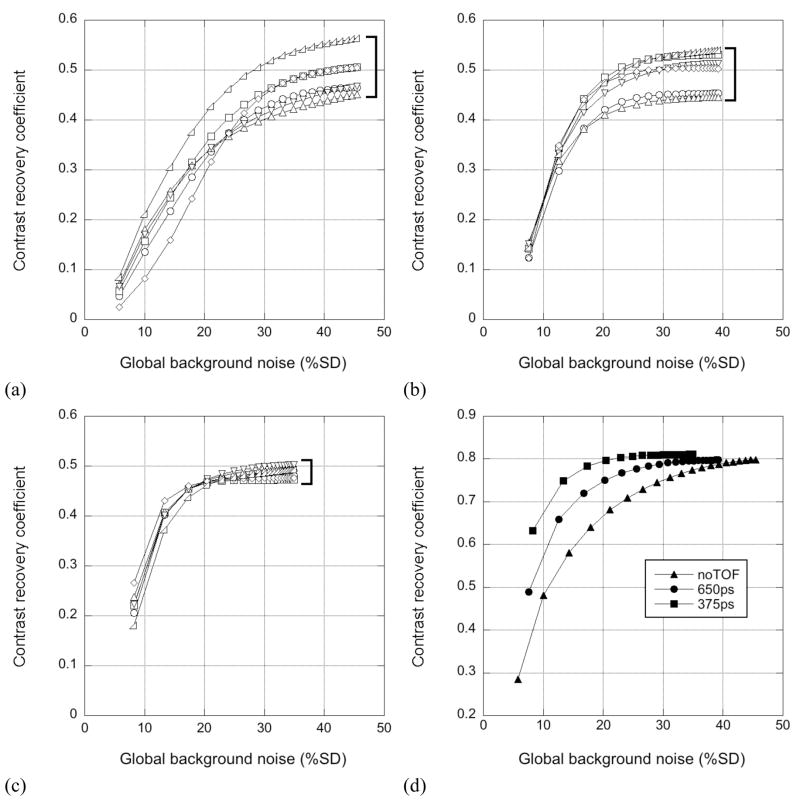
Figure 9 shows CRClocal vs. noise performance for the trues+scatter simulation with 12% energy resolution (440-keV LET) with different timing resolutions. The results for the six hot spheres are shown in figures 9(a–c); the results for the 40-mm cold sphere are plotted in figure 9(d). It can be seen that TOF information leads to faster convergence and a better contrast/noise trade-off (i.e., increased contrast at fixed noise or comparable contrast at lower noise). Having better timing resolution further improves this tradeoff. In addition, as can be seen from the hot sphere results, the rate of convergence of the six spheres becomes more uniform as the timing resolution improves, and the variation in contrast at or near convergence of the hot spheres, which were located at different radial positions and in different local activity environments, is smaller with better timing resolution. This improved uniformity of quantification with TOF has also been observed by Vandenberghe et al (2006). These results are in agreement with the measured results with one exception: unlike the measured data where lower contrast was seen without TOF, comparable contrasts at convergence are seen with and without TOF in simulation.
Figure 9.
CRClocal vs. background noise for 40-cm cylinder trues+scatter simulations with different timing resolutions. The contrast/noise performance for the six hot spheres is shown for (a) non-TOF reconstruction, (b) TOF reconstruction of the 650-ps data, and (c) TOF reconstruction of the 375-ps data. Contrast/noise performance is plotted for the 40-mm cold sphere in (d) for the non-TOF case (triangles), 650-ps timing resolution (circles), and 375-ps timing resolution (squares). Each of the curves plotted is an average over the 10 replicates for a given sphere location.
3.3.2 Impact of energy resolution
Figure 10 shows CRClocal vs. noise performance for TOF reconstructions of the 12% energy resolution with a 440-keV LET (circles) and 7% energy resolution with a 490-keV LET (squares). The open symbols are for trues-only data, while the closed symbols show results for trues+scatter data. Figure 10(a) shows the average results for the six 10-mm hot spheres, averaged over the 10 replicates (60 replicate lesions) for TOF reconstruction. Figure 10(b) is a plot for the 40-mm cold sphere, averaged over the 10 replicates. The uncertainty (SD) in the measured CRClocal values is approximately ±0.03 for the hot spheres and ±0.01 for the cold sphere. It can be seen that the contrast values for the trues+scatter data with 12% energy resolution are lower than those obtained for the trues-only data. This difference between trues-only and trues+scatter contrast values largely disappears for the 7% energy resolution. The scatter fraction for the 12% case was 41%, while that for the 7% simulation was 22%. The small discrepancy between contrast values for 12% and 7% energy resolutions is consistent with those observed for the 10-mm hot sphere in the measured phantom study. For the simulated data, the contrast at convergence for 12% energy resolution is 14% lower than that with 7% energy resolution; in the measured phantom study, this difference was 12% with TOF reconstruction (and larger without TOF).
Figure 10.
CRClocal vs. background noise for 40-cm cylinder simulations with different energy resolutions, reconstructed with TOF (375 ps). (a) Results averaged over the six 10-mm hot spheres and 10 replicate simulations. (b) Results for the 40-mm cold sphere, averaged over the 10 replicates. The circles correspond to the 12% energy resolution with a 440-keV LET; the squares represent the results for 7% energy resolution with a 490-keV LET. Trues-only results are shown with open symbols, while the closed symbols show trues+scatter results. The uncertainty (SD) of the hot sphere contrast values is ±0.03; the SD of the cold sphere contrast values is ±0.01.
Figure 11 shows profiles through the simulated and estimated scatter sinograms, summed over all time bins and azimuthal angles for the 12% (left) and 7% (right) energy resolutions. The noisy curves are the simulated scatter, while the smooth, black curves are the SSS estimate. Plots are shown (a, c) for a direct projection (i.e., for coincidences between detectors in the same, central ring) and (b, d) for coincidences between detectors at either end of the axial FOV (oblique projection). It can be seen that for direct projections the scatter is underestimated for the 12% energy resolution while for the 7% energy resolution, the estimate is very close to the actual scatter. For oblique projections, the error is greater, and even the 7% energy resolution case shows a modest error although it is less than that for the 12% energy resolution. The total scatter is underestimated by 5.2% for 7% energy resolution and 7.3% for 12% energy resolution. However, the scatter fraction is higher for the 12% energy resolution study, so the error has a larger effect on the reconstructed image. The better energy resolution, coupled with the higher LET, leads to less scatter accepted and subsequently lower bias resulting from inaccuracies in the scatter estimate. These results are consistent with the improved contrast recovery seen with better energy resolution.
Figure 11.
Radial profiles through scatter sinograms, summed over all time bins and angular projection angles. The noisy curves are the actual simulated scatter, while the smooth, black lines are the estimated scatter from the SSS algorithm, extended to include TOF information (although that information is suppressed in these plots). Curves are shown (a, b) for 12% energy resolution with a 440-keV LET and (c, d) for 7% energy resolution with a 490-keV LET. Results are shown (a, c) for coincidences between detectors in a central ring (direct projection) and (b, d) for coincidences between detectors at either end of the axial FOV (oblique projection).
4. Discussion
There is good agreement between the measured intrinsic performance characteristics (spatial resolution, scatter fraction, and sensitivity) and those predicted from previous simulation studies for a LaBr3 scanner of this geometry and from measured data on the LYSO-based Gemini TF system. The measured spatial resolution is consistent with that predicted for low activities from simulation (Surti et al 2004). There is a small degradation in resolution (~1 mm FWHM at the center) from that on the LYSO-based Gemini TF (Surti et al 2007); this is expected since the stopping power of LaBr3 is lower than that of LYSO, so the annihilation photons travel farther before interacting/stopping in the crystal. In addition, the crystal spacing with the LaBr3 system is 4.3 mm, compared with 4.07 mm for the Gemini TF: this will also affect the spatial resolution. As noted earlier, a non-conventional technique for sub-sampling the crystal map has been proposed (Surti et al 2009) that can improve the spatial resolution of the LaBr3 system by 0.4 mm.
The measured scatter fraction is higher at 470 keV than that predicted by the simulation (Surti et al 2004). This is partly due to the fact that the simulation assumed a 6.5% energy resolution, rather than the 7% that has been measured at the count rates of the study. In addition, the scatter fraction is somewhat increased because the usable axial FOV is limited by the electronics, so there is a 6-cm gap between the end of the usable FOV and the back end shielding. We have observed an asymmetry in the scatter fraction measured at the front and back halves of the scanner that suggests that this gap admits more out-of-field scatter, primarily coming from activity inside the end-shielding but beyond the usable axial FOV.
The sensitivity of the LaBr3 scanner is also lower than its potential because the axial FOV is reduced although close to what would be predicted for the shorter axial FOV. From the simulation results and measured sensitivity on the Gemini TF, we would expect nearly a factor of 2 increase in the sensitivity when the full 25-cm axial FOV is available. An upgrade to the electronics to support the full axial FOV is under development.
The LaBr3 system shows a dependence of energy and timing resolutions on count rate, even when local clustering is used to localize the PMTs used. The large (51-mm) PMTs used result in a large area of overlap between clusters, which leads to increased pulse pile-up. These PMTs were the most cost-effective PMTs with excellent performance at the time the scanner was designed; since then, the performance of smaller, 39-mm PMTs has improved. As has been shown by Kuhn et al (2004), smaller PMTs would eliminate much of this count rate dependence. Pulse shape analysis of digitized signals will, in principle, also reduce the pulse pile-up effects, and work is on-going in this area (Wiener et al 2008).
The simulation study of the impact of energy resolution and LET (figures 10 and 11) indicates that the scatter estimate from the SSS model for TOF is somewhat inaccurate in the presence of a high scatter fraction. With a higher LET, less scatter is accepted, so inaccuracies in the scatter estimate have less of an effect on the overall quantitative accuracy. The better energy resolution of LaBr3 allows for a high LET without a significant loss of true events. The remaining inaccuracy in the scatter estimate is largely due to multiple scatters, which are not modeled explicitly by the single-scatter simulation but are included by fitting the tails of the scatter estimate to the measured data outside the patient. For large objects, such as the 40-cm cylinder used in the simulation studies and the measured 35-cm hot and cold sphere phantom, the scaling can be subject to small errors that are then magnified by the high scatter fraction.
Both the simulation and measured data with different timing resolutions demonstrate the advantages of better timing resolution in more uniform convergence across the image, independent of location and surrounding activity, and more uniform (less variable) quantification. This local TOF benefit is in addition to the global noise reduction, evident in figure 6, and is a strong incentive to improve the timing resolution even further.
As noted earlier, there is a discrepancy between the contrast achieved at convergence for TOF and non-TOF reconstruction in measured phantom studies that is not observed in simulations. This same difference has been observed for Gemini TF measurements (Surti et al 2007). While the origin of the discrepancy is not known, we speculate that errors in the scatter estimate over those shown for simulated data in Figure 11 are the likely cause. The scatter estimate is sensitive to errors in both timing resolution and energy resolution, which are both known exactly for the simulation but not for the measurements. Because the TOF reconstruction is more local, it is less sensitive to errors in the scatter estimate. Further improvements to the scatter correction algorithm are under investigation.
The results seen with the preliminary study of resolution modeling demonstrate the dramatic effect that others (e.g., Alessio et al 2006, Panin et al 2007, Tohme and Qi 2009) have observed with resolution recovery but also show the need for a careful model. Especially for a crystal such as LaBr3 with long tails in the PSF, the resolution model must take those tails into account accurately to recover as much resolution as possible. As one attempts to recover more resolution, edge artefacts are not unexpected due in part to the slower convergence of high frequencies. However, any artefacts resulting from the simple resolution models used in this work are small and may be insignificant in clinical data. We have recently begun a thorough assessment of detector blurring on individual lines of response, considering detector module edge effects as well as the loss of azimuthal symmetry introduced by gaps between the detector modules. Our previous work has demonstrated that blob basis functions act to reduce noise without sacrificing image contrast; therefore, we believe that the combination of blobs with more accurate spatial resolution modeling will be beneficial. However, to avoid overcompensating for spatial resolution effects, the blob parameters must be modified. The optimization of resolution modeling with blob basis functions is the subject of future work.
5. Conclusions
A LaBr3 TOF-PET scanner has been built to demonstrate that it is possible to achieve good PET performance for conventional imaging with excellent performance with TOF. The timing resolution of the LaBr3 system (375 ps) is superior to that achieved in commercial TOF-PET scanners (550–600 ps). In addition, the energy resolution with LaBr3 is better than that of either LYSO or LSO, allowing for a tighter energy window with a reduced scatter contamination. While we anticipate further improvements to the scanner, especially with regard to timing resolution and sensitivity, as the electronics are improved, the current performance of the LaBr3 system is excellent and allows us to proceed with further studies, both phantom and human, to better understand and characterize the importance of TOF in PET imaging and the relative roles played by timing, energy, and spatial resolutions on clinical performance and accuracy of quantification.
Acknowledgments
We would like to thank Dr Samuel Matej and Dr Robert Lewitt (Department of Radiology, University of Pennsylvania) for helpful discussions. This work was supported by the National Institutes of Health grants No. R01-CA113941 and R33-EB001684 and sponsored research agreements with Philips Healthcare and Saint Gobain Crystals.
References
- Accorsi R, Adam L-E, Werner ME, Karp JS. Optimization of a fully 3D single scatter simulation algorithm for 3D PET. Phys Med Biol. 2004;49:2577–98. doi: 10.1088/0031-9155/49/12/008. [DOI] [PubMed] [Google Scholar]
- Adam L-E, Karp JS, Brix G. Investigation of scattered radiation in 3D whole-body positron emission tomography with Monte-Carlo simulations. Phys Med Biol. 1999;44:2879–95. doi: 10.1088/0031-9155/44/12/302. [DOI] [PubMed] [Google Scholar]
- Alessio AM, Kinahan PE, Lewellen TK. Modeling and incorporation of system response functions in 3-D whole body PET. IEEE Trans Med Imaging. 2006;25:828–37. doi: 10.1109/tmi.2006.873222. [DOI] [PubMed] [Google Scholar]
- Budinger TF. Time-of-flight positron emission tomography: status relative to conventional PET. J Nucl Med. 1983;24:73–8. [PubMed] [Google Scholar]
- Casey ME, Hoffman EJ. Quantitation in positron emission tomography: 7. A technique to reduce noise in accidental coincidence measurements and coincidence efficiency calibration. J Comput Assist Tomogr. 1986;10:845–850. [PubMed] [Google Scholar]
- Daube-Witherspoon ME, Popescu LM, Matej S, Cardi CA, Lewitt RM, Karp JS. Rebinning and reconstruction of point source transmission data for positron emission tomography. In: Metzler S, editor. 2003 IEEE Nuclear Science Symp. and Medical Imaging Conf. Record; Portland, OR. 2003. [Google Scholar]
- Daube-Witherspoon ME, Surti S, Matej S, Werner M, Jayanthi S, Karp JS. Influence of time-of-flight kernel accuracy in TOF-PET reconstruction. In: Phlips B, editor. 2006 IEEE Nuclear Science Symp. and Medical Imaging Conf. Record; San Diego, CA. 2006. [Google Scholar]
- Gariod R, Allemand R, Cormoreche E, Laval M, Moszynski M. The LETI positron tomograph architecture and time of flight improvements. Proc. of IEEE Workshop on Time-of-Flight Emission Tomography; St. Louis, MO. 1982.1982. [Google Scholar]
- Hudson HM, Larkin RS. Accelerated image reconstruction using ordered subsets of projection data. IEEE Trans Med Imaging. 1994;13:601–609. doi: 10.1109/42.363108. [DOI] [PubMed] [Google Scholar]
- Jakoby BW, Bercier Y, Conti M, Casey M, Gremillion T, Hayden C, Bendriem B, Townsend DW. Performance investigation of a time-of-flight PET/CT scanner. In: Sellin P, editor. 2008 IEEE Nuclear Science Symp. and Medical Imaging Conf. Record; Dresden, Germany. 2008. [Google Scholar]
- Karp JS, Kuhn A, Perkins AE, Surti S, Werner ME, Daube-Witherspoon ME, Popescu L, Vandenberghe S, Muehllehner G. Characterization of a time-of-flight PET scanner based on lanthanum bromide. In: Yu B, editor. 2005 IEEE Nuclear Science Symp. and Medical Imaging Conf. Record; Puerto Rico. 2005. [Google Scholar]
- Karp JS, Surti S, Daube-Witherspoon ME, Muehllehner G. Benefit of time-of-flight in PET: Experimental and clinical results. J Nucl Med. 2008;49:462–70. doi: 10.2967/jnumed.107.044834. [DOI] [PMC free article] [PubMed] [Google Scholar]
- Kemp B, Nathan M, Rohren E, Peller P, Murphy R, Lowe V. Clinical evaluation of a prototype time-of-flight PET/CT system. J Nucl Med. 2009;50(Supplement 2):1513. (abstract) [Google Scholar]
- Kuhn A, Surti S, Karp JS, Raby PS, Shah KS, Perkins AE, Muehllehner G. Design of a lanthanum bromide detector for time-of-flight PET. IEEE Trans Nucl Sci. 2004;51:2550–7. [Google Scholar]
- Kyba CCM, Wiener RI, Newcomer FM, Perkins AE, Kulp RR, Werner ME, Surti S, Dressnandt N, Van Berg R, Karp JS. Evaluation of local PMT triggering electronics for a TOF-PET scanner. In: Sellin P, editor. 2008 IEEE Nuclear Science Symp. and Medical Imaging Conf. Record; Dresden, Germany. 2008. [Google Scholar]
- Lewellen TK, Bice AN, Harrison RL, Pencke MD, Link JM. Performance measurements of the SP3000/UW time-of-flight positron emission tomography. IEEE Trans Nucl Sci. 1988;35:665–9. [Google Scholar]
- Lewitt RM. Alternatives to voxels for image representation in iterative reconstruction algorithms. Phys Med Biol. 1992;37:705–16. doi: 10.1088/0031-9155/37/3/015. [DOI] [PubMed] [Google Scholar]
- Matej S, Lewitt RM. Practical considerations for 3-D image reconstruction using spherically symmetric volume elements. IEEE Trans Med Imaging. 1996;15:68–78. doi: 10.1109/42.481442. [DOI] [PubMed] [Google Scholar]
- Matej S, Lewitt RM. 3D-FRP: Direct Fourier reconstruction with Fourier reprojection for fully 3-D PET. IEEE Trans Nucl Sci. 2001;48:1378–85. [Google Scholar]
- Mazoyer B, Trebossen R, Schoukroun C, Verrey B, Syrota A, Vacher J, Lemasson P, Monnet O, Bouvier A, Lecomte JL. Physical characteristics of TTV03, a new high spatial resolution time-of-flight positron tomograph. IEEE Trans Nucl Sci. 1990;37:778–82. [Google Scholar]
- Moses WW. Current trends in scintillator detectors and materials. Nucl Instrum Methods Phys Res A. 2002;487:123–8. [Google Scholar]
- Mullani NA, Gaeta J, Yerian K, Wong WH, Hartz RK, Philippe EA, Bristow D, Gould KL. Dynamic imaging with high resolution time-of-flight PET camera TOFPET-I. IEEE Trans Nucl Sci. 1984;NS-31:609–13. [Google Scholar]
- NEMA Standards Publication NU 2. Performance Measurements of Positron Emission Tomographs. Rosslyn, VA: National Electrical Manufacturers Association; 2001. [Google Scholar]
- Ollinger JM. Model-based scatter correction for fully 3D PET. Phys Med Biol. 1996;41:153–76. doi: 10.1088/0031-9155/41/1/012. [DOI] [PubMed] [Google Scholar]
- Panin VY, Kehren F, Michel C, Casey M. Fully 3-D PET reconstruction with system matrix derived from point source measurements. IEEE Trans Med Imaging. 2006;25:907–21. doi: 10.1109/tmi.2006.876171. [DOI] [PubMed] [Google Scholar]
- Parra L, Barrett HH. List-mode likelihood: EM algorithm and image quality estimation demonstrated on 2-D PET. IEEE Trans Med Imaging. 1998;17:228–35. doi: 10.1109/42.700734. [DOI] [PMC free article] [PubMed] [Google Scholar]
- Popescu LM, Matej S, Lewitt RM. Iterative image reconstruction using geometrically ordered subsets with list-mode data. In: Seibert JA, editor. 2004 IEEE Nuclear Science Symp. and Medical Imaging Conf. Record; Rome, Italy. 2004. [Google Scholar]
- Reader AJ, Erlandsson K, Flower MA, Ott RJ. Fast accurate iterative reconstruction for low-statistics positron volume imaging. Phys Med Biol. 1998;43:835–46. doi: 10.1088/0031-9155/43/4/012. [DOI] [PubMed] [Google Scholar]
- Shah KS, Glodo J, Kluderman M, Moses WW, Derenzo SE, Weber AJ. LaBr3: Ce scintillators for gamma-ray spectroscopy. IEEE Trans Nucl Sci. 2003;50:2410–3. [Google Scholar]
- Smith RJ, Karp JS, Muehllehner G, Gualtieri E, Bernard F. Singles transmission scans performed post-injection for quantitative whole-body PET imaging. IEEE Trans Nucl Sci. 1997;44:1329–35. [Google Scholar]
- Strother SC, Casey ME, Hoffman EJ. Measuring PET scanner sensitivity: relating countrates to image signal-to-noise ratios using noise equivalent counts. IEEE Trans Nucl Sci. 1990;37:783–8. [Google Scholar]
- Surti S, Karp JS, Muehllehner G, Raby PS. Investigation of lanthanum scintillators for 3-D PET. IEEE Trans Nucl Sci. 2003;50:348–54. [Google Scholar]
- Surti S, Karp JS, Muehllehner G. Image quality assessment of LaBr3-based whole-body 3D PET scanners: a Monte Carlo evaluation. Phys Med Biol. 2004;49:4593–610. doi: 10.1088/0031-9155/49/19/010. [DOI] [PubMed] [Google Scholar]
- Surti S, Karp JS, Popescu LM, Daube-Witherspoon ME, Werner M. Investigation of time-of-flight benefit for fully 3-D PET. IEEE Trans Med Imaging. 2006;25:529–538. doi: 10.1109/TMI.2006.871419. [DOI] [PubMed] [Google Scholar]
- Surti S, Kuhn A, Werner ME, Perkins AE, Kolthammer J, Karp JS. Performance of Philips Gemini TF PET/CT scanner with special consideration for its time-of-flight imaging capabilities. J Nucl Med. 2007;48:471–80. [PubMed] [Google Scholar]
- Surti S, Scheuermann R, Werner ME, Karp JS. Improved spatial resolution in PET scanners using sampling techniques. IEEE Trans Nucl Sci. 2009;56:596–601. doi: 10.1109/TNS.2009.2013389. [DOI] [PMC free article] [PubMed] [Google Scholar]
- Ter-Pogossian MM, Ficke DC, Yamamoto M, Hood JT. Super PETT I: A positron emission tomograph utilizing photon time-of-flight information. IEEE Trans Med Imaging. 1982;MI-1:179–92. doi: 10.1109/TMI.1982.4307570. [DOI] [PubMed] [Google Scholar]
- Tohme MS, Qi J. Iterative image reconstruction for positron emission tomography based on a detector response function estimated from point source measurements. Phys Med Biol. 2009;54:3709–25. doi: 10.1088/0031-9155/54/12/007. [DOI] [PMC free article] [PubMed] [Google Scholar]
- Tomitani T. Image-reconstruction and noise evaluation in photon time-of-flight assisted positron emission tomography. IEEE Trans Nucl Sci. 1981;NS-28:4582–9. [Google Scholar]
- Turkington T, Williams J, Wollenweber S, Stearns C, Ganin A, Wilson J. Image quality evaluation on a new time-of-flight PET. J Nucl Med. 2009;50(Supplement 2):351. (abstract) [Google Scholar]
- van Loef EVD, Derenbos P, van Eijk CWE, Kramer K, Gudel HU. High-energy-resolution scintillator: Ce3+ activated LaBr3. Appl Phys Lett. 2001;79:1573–5. [Google Scholar]
- Vandenberghe S, Karp JS, Lemahieu I. Influence of TOF resolution on object dependent convergence in iterative listmode MLEM. J Nucl Med. 2006;47:58P. (abstract) [Google Scholar]
- Watson CC, Newport D, Casey ME. A single scatter simulation technique for scatter correction in 3D PET. In: Grangeat P, Amans J-L, editors. Three-Dimensional Image Reconstruction in Radiology and Nuclear Medicine. Dordrecht, The Netherlands: Kluwer; 1996. pp. 255–68. [Google Scholar]
- Watson CC. Extension of single scatter simulation to scatter correction of time-of-flight PET. IEEE Trans Nucl Sci. 2007;54:1679–86. [Google Scholar]
- Werner ME, Surti S, Karp JS. Implementation and evaluation of a 3D PET single scatter simulation with TOF modeling. In: Phlips B, editor. 2006 IEEE Nuclear Science Symp. and Medical Imaging Conf. Record; San Diego, CA. 2006. [Google Scholar]
- Wiener RI, Surti S, Kyba CCM, Newcomer FM, Van Berg R, Karp JS. An investigation of waveform sampling for improved signal processing in TOF PET. In: Sellin P, editor. 2008 IEEE Nuclear Science Symp. Medical Imaging Conf. Record; Dresden, Germany. 2008. [Google Scholar]
- Wong WH, Mullani NA, Philippe EA, Hartz R, Gould KL. Image improvement and design optimization of the time-of-flight PET. J Nucl Med. 1983;24:52–60. [PubMed] [Google Scholar]
- Wong WH, Mullani NA, Wardworth G, Hartz RK, Bristow D. Characteristics of small barium fluoride (BaF2) scintillator for high intrinsic resolution time-of-flight positron emission tomography. IEEE Trans Nucl Sci. 1984;NS-31:381–6. [Google Scholar]


