Abstract
There is a need to develop therapies that promote growth or remyelination of mammalian CNS axons. Although the feasibility of pre-clinical treatment strategies should be tested in animal models, in vitro assays are usually faster and less expensive. As a result, in vitro models are ideal for screening large numbers of potential therapeutics prior to use in more complex in vivo systems. In 1953, Sholl introduced a technique that is a reliable and sensitive method for quantifying indices of neurite outgrowth. However, application of the technique is limited because it is labor-intensive. Several methods have been developed to reduce the analysis time for the Sholl technique; but these methods require extensive pre-processing of digital images, they introduce user bias or they have not been compared to manual analysis to ensure accuracy. Here we describe a new, semi-automated Sholl technique for quantifying neuronal and glial process morphology. Using MetaMorph®, we developed an unbiased analysis protocol that can be performed ~3x faster than manual quantification with a comparable level of accuracy regardless of cell morphology. The laborious image processing typical of most computer-aided analysis is avoided by embedding image correction functions into the automated portion of the analysis. The sensitivity and validity of the technique was confirmed by quantifying neuron growth treated with growth factors or oligodendroglial maturation in the presence or absence of thyroid hormone. Thus, this technique provides a rapid and sensitive method for quantifying changes in cell morphology and screening for treatment effects in multiple cell types in vitro.
Keywords: dorsal root ganglion; sensory; regeneration; oligodendrocyte progenitor; myelin; BDNF; NGF; morphometry; morphometric, technique
INTRODUCTION
Endogenous repair of the injured or diseased adult central nervous system (CNS) is inefficient and incomplete. As such, new strategies are needed to promote axonal regeneration and remyelination. Ideally, before new therapies can be moved into clinical trials, they will be tested in well-established animal models. However, such studies are time and resource intensive making it difficult to know which candidate drugs should be prioritized for in vivo testing. In vitro models represent relatively quick and inexpensive tools for screening drugs and prioritizing their use in animal models.
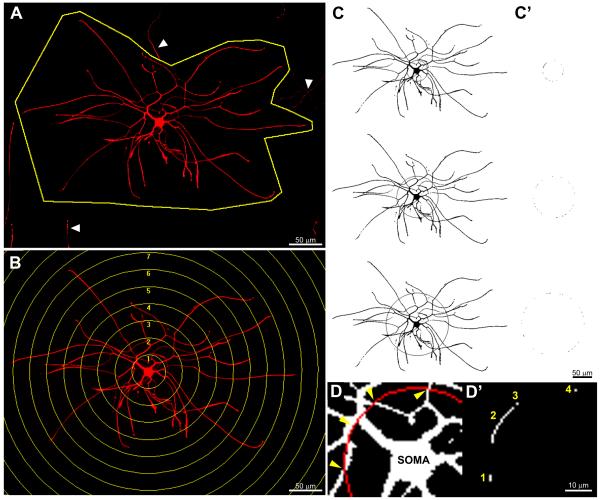
Sholl analysis (1953; 1956) is a common technique used to quantify different indices of neuron morphology (for a recent review see Brown et al., 2008). For example, a Sholl profile provides quantitative indices of axon length and branching complexity that can be compared between experimental groups. A Sholl profile is obtained by overlaying a template of concentric circles onto a two or three-dimensional image of a neuron; then, the number of neuritic processes that intersect those circles are plotted as a function of radial distance from the cell soma (Fig. 1).
Figure 1. Processing sequence for semi-automated analysis.
Images were generated from screen shots taken during the semi-automated analysis. A) First, the cell of interest is manually outlined to exclude neurites from other cells (arrowheads). B) Second, circles of increasing radii are manually centered over the cell soma on the newly clipped image generated in (A). C) The images are then manually thresholded (the resulting pixels on the cell above threshold in black) and single pixels automatically removed to reduce false positives. The “logical AND” function is then performed between superimposed rings and cellular pixels above threshold to determine the number of intersections per ring. Each collection of co-localized pixels (C’) is then logged to a text file and quantified as 1 intersecting neurite. D) High-powered example of axonal intersections with a Sholl ring (arrowheads) and resultant number of intersections logged to text file (D’). Note: The screenshots for C & C’ have been inverted to highlight ring intersections.
Manually counting ring intersections to generate a Sholl profile is time consuming and tedious. For this reason, researchers and software companies have developed computer-assisted and manual adaptations (see supplemental table 1); however, there are limitations associated with both adaptations. “Automated” computer-assisted protocols require extensive image editing before axons or dendritic trees become clearly visible from background (Gutierrez and Davies, 2007). In addition, to the best of the authors’ knowledge, there are no published reports that have compared automated and manual Sholl analyses. Recently, Gutierrez and Davies (2007) introduced a Sholl analysis technique that does not require image editing; yet, this technique requires significant user input to identify axon terminals and bifurcation points for a given neuron. Although this approach is faster than manual Sholl technique when it is applied to neurons with only a few, relatively simple arborizations, there is still bias introduced into each assay and this bias and the time needed for quantification will increase when the technique is applied to cells with higher axonal density.
In this report, we describe a novel, unbiased semi-automated Sholl method that can be used to rapidly quantify differences in growth or differentiation of neurons or glia. Specifically, we have developed a macro in MetaMorph® that eliminates the need for laborious image processing. This was accomplished by embedding image correction functions into the automated portion of the analysis. This facilitates the analysis of more cells with less variability and increased statistical sensitivity. When compared to conventional, manual quantification, the semi-automated method was 3x faster but with a similar level of sensitivity and minimal inter-user variability. We validated the accuracy of the technique by examining the effects of two neurotrophic factors (brain-derived neurotrophic factor (BDNF) and nerve growth factor (NGF)) on axon outgrowth from sensory neurons in vitro. Using the semi-automated analysis we can also quantitatively identify oligodendrocytes at different developmental states independent of lineage-specific cell markers.
MATERIALS & METHODS
Primary neuronal cultures
Adult, wild-type C57BL/6 mice were terminally anesthetized and dorsal root ganglia (DRGs) were rapidly dissected from cervical and lumbar spinal cord (Gensel et al., 2009; Lindsay et al., 1991). Excised DRGs were incubated in dispase 2 (5 U/ml; Roche) and collagenase type 2 (200 U/ml; Worthington) for 45 min in Ca2+ free Hanks’ Balanced Salt Solution (HBSS; Mediatech). Enzymes were removed, 250 μg/ml DNase I type 2 (Sigma) was added, and DRGs incubated for 5 min. DRGs were suspended in 500 μl HBSS media, triturated, then centrifuged at 3000 rpm for 3 min. The DRG pellet was resuspended in Neurobasal A medium (NBA) supplemented with 2% B27, 1% Glutamax™ l and 1% penicillin-streptomycin. Cells were plated on poly-D-lysine (25 μg/ml) and laminin (10 μg/ml; Invitrogen) coated glass coverslips at 200-400 cells/coverslip in 500μl of NBA. After 3 days in vitro, NBA was removed and equivalent volumes of NBA or NBA supplemented with NGF (10ng/ml) or BDNF (50ng/ml) were added for 24 hrs. Cells were washed with 0.1 M PBS then fixed with 2% paraformaldehyde for 30 min. Unless stated otherwise, all media components were obtained from Invitrogen (Gland Island, NY).
Primary oligodendrocyte progenitor cell cultures
Cerebral cortices from embryonic day 18 or postnatal day 2 rats were dissected, minced then digested for 15 min at 37 °C in S-MEM (Gibco, Grand Island, NY) containing 1% trypsin (Yang et al., 2005). DNAse (60 μg/ml) was added and cells were resuspended in DMEM supplemented with 10% fetal bovine serum (Hyclone), 1% Glutamax™, 1% penicillin-streptomycin, triturated, then centrifuged at 1200 rpm for 3 minutes. Pellets were resuspended in supplemented DMEM, triturated, and plated in T-75 flasks coated with poly-L-lysine (100μg/ml). Flasks were replenished with fresh media every other day. Ten to twelve days after plating, flasks were shaken for 1 hr (250 rpm) and non-adherent microglia discarded. Flasks were then sealed and shaken for 15 hrs (250 rpm) at 37-degrees then at 300 rpm for 45 minutes. Non-adherent oligodendrocyte progenitor cells (OPCs) were collected, counted, and plated on poly-L-lysine coated coverslips at 10,000 cells/coverslip. Cells were incubated for at least one hour in the supplemented DMEM before media was changed to basic media (Neurobasal (NB) Media (Gibco) containing 2% B27 supplement plus PDGF (15ng/ml); Peprotech). After 3 days in vitro, media was removed and replaced with fresh basic media or with NB + B27 + T3 (3,3′ ,5 triiodo-L-thyronine sodium salt; 30ng/ml; Sigma-Aldrich) and T4 (L-thyroxine sodium salt; 40ng/ml; Sigma Aldrich) to accelerate oligodendrocyte differentiation. After 24hrs (combination immunohistochemical marker analysis) or 3 days (single immunohistochemical marker analysis) cells were fixed with 2% paraformaldehyde for 30 min.
Immunohistochemistry and Digital Image Generation
A monoclonal rabbit anti-β-tubulin III antibody was used to label DRG neurons (1:2000; Sigma). Monoclonal anti-A2B5 (1:1000) and anti-PLP antibodies used to identify oligodendrocyte lineage cells (1:100; Chemicon). Alexa Fluor 546 (AF546)-conjugated secondary antibody (1:1000; Molecular Probes) was used to detect labeled DRG neurons and oligodendrocyte lineage cells. To quantify axon growth and oligodendrocyte differentiation, the stereology feature of the MCID image analysis software (InterFocus Imaging Ltd., Cambridge, England) was used to randomly sample DRG coverslips (β-tubulin III+ cells) or oligodendrocyte lineage cell coverslips (A2B5/PLP+ cells). The MCID software controlled the motorized X-Y stage of an Axioplan 2 imaging microscope (Zeiss) and 10% of each coverslip was sampled to generate digital images of 20-30 cells per group. Only cells with isolated processes that did not contact other cells were quantified. Prior to acquisition, camera settings were optimized (gain for red channel adjusted) for detecting AF546 immunoreactivity while reducing background signal.
Semi-automated analysis
To reduce human bias, a semi-automated Sholl (1953) analysis program was developed for digital images using the MetaMorph® Offline version 6.3r0 image analysis system (Molecular Devices, Downington, PA). First, the cells and processes of interest were outlined to exclude adjacent cells or areas of non-specific immunoreactivity (Fig. 1A). Templates of concentric circles increasing in radii by 50μm (DRGs) or 10μm (oligodendrocytes) were overlaid onto the center of a digitized cell soma (Fig. 1B). For each cell, densitometric thresholds were set to remove background labeling and identify detailed cellular processes. Single pixels of immunoreactive labeling above the threshold of detection were automatically removed to reduce false positives. The total number of objects above threshold intersecting each circle was tallied using an automated macro (Fig. 1C-D). The maximal ring with an intersecting process (max distance) and sum of the number of intersections (branching complexity) for all rings were generated for each cell and compared among groups. See supplemental table 2 and the supplemental methods for a more detailed description of the semi-automated macro.
Statistics
All statistics (except intraclass correlation coefficients), areas under the curve, and graphical representation of the data were generated using GraphPad Prism 5.0 (GraphPad Software Inc., La Jolla, CA). Grubb’s test was used to remove statistical outliers. Pearson’s correlation coefficient was used to determine the statistical significance of regression data. For group comparisons, data were analyzed using ANOVA followed by Dunnett’s or Tukey’s test for multiple comparisons. Independent samples t-tests were also used to compare two groups separately. Type A intraclass correlation coefficients were calculated using SPSS Statistics 17.0 (SPSS Inc., Chicago, IL). All p-values<0.05 were considered significant. Unless noted otherwise, all data represent the mean ± SEM. Figures were prepared using Adobe Photoshop CS (Adobe Systems Inc., San Jose, CA) and GraphPad Prism 5.0.
RESULTS
Semi-automated method accurately produces Sholl profiles for a variety of neurons
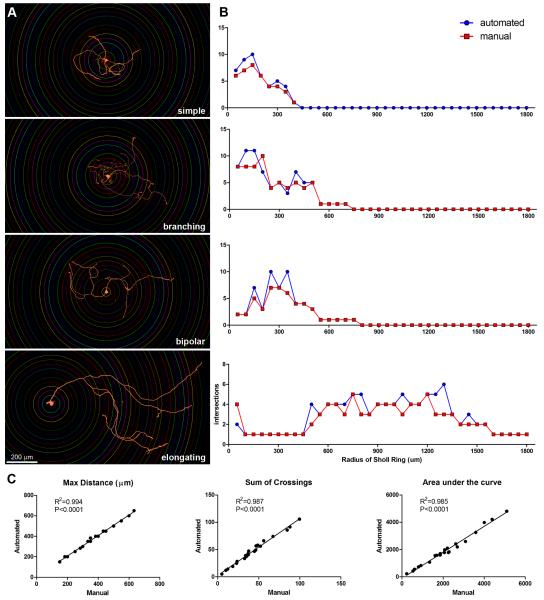
To test the accuracy of the semi-automated Sholl analysis, images of 23 different DRG neurons with multiple axonal morphologies were analyzed. Examples of the types of cells selected are shown in Figure 2A. Three different users generated data using manual and semi-automated methods. These values were averaged among users for each technique and then were compared using regression analysis. Two users were experienced with the system while the other had no prior experience. All data derived using the semi-automated technique significantly correlated with manual counts (Figure 2B-C).
Figure 2. Semi-automated Sholl analysis correlates with manual quantification.
A) Screen shots of cells with superimposed Sholl rings. These examples encompass the full range of variability common to sensory neurons in culture. B) Sholl profiles of corresponding cells in (A) comparing manual and semi-automated quantification. Notice the similarities between manual and semi-automated counts regardless of the complexity of axonal arborizations exhibited by DRG neurons. C) Correlations between data generated by manual or semi-automated analysis for different outcome measures (n=23 cells; all values are the average of three independent user quantifications).
Semi-automated analysis can be performed quickly with little inter-user variability
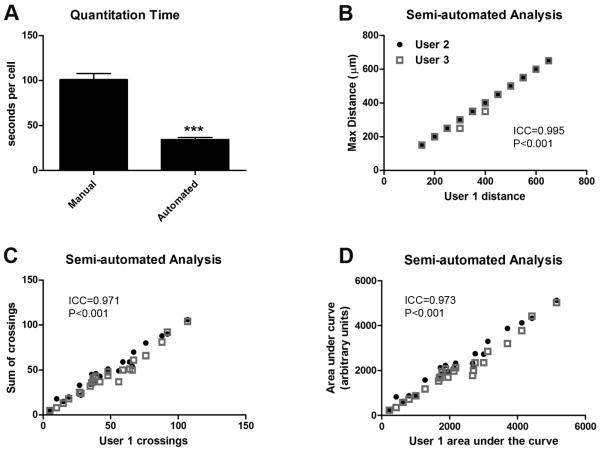
The time needed to complete manual and semi-automated analysis was recorded for each cell. For manual counts, users started with images of cells with superimposed Sholl rings in place. Timing for the semi-automated analysis included the time to outline the cell of interest, threshold the image, and for the automated portion of the analysis to generate and export the number of crossings per ring. Although some user-directed pre-processing (i.e. outlining and thresholding) was required for semi-automated analysis, this technique was still ~3x faster than the manual technique (Figure 3A). A breakdown of user-directed vs. automated aspects of the semi-automated analysis revealed that the average time for manual outlining and threshold level selection was 21.7 +/− 16.9 seconds (mean +/− SD) while it took MetaMorph® 8.5 +/− 0.2 seconds to run the automated portion of the analysis. User familiarity with the system had some effect on speed. One user had no prior experience with the system and took an average of 35.4 +/− 24.1 seconds to perform the user-directed part of the analysis while experienced users, those who had analyzed 25 or more cells previously, did the same in 15.3 +/− 5.5 seconds. This increased speed did not come at a cost of decreased precision. Indeed, calculations of intraclass correlation coefficients revealed significant agreement among all users for all outcome measures examined (Figure 3B-D).
Figure 3. Semi-automated Sholl analysis is faster than manual analysis with little inter-user variability.
A) Average time for manual and semi-automated analysis. Semi-automated analysis significantly reduced the average time needed to quantify Sholl profiles (***p<0.001). B-D) Scatter plots between three different users reveals minimal inter-user variability associated with semi-automated analysis (average standard deviation among users <10%; ICC=intraclass correlation coefficient).
Semi-automated analysis is sensitive to growth factor-mediated increases in neurite growth
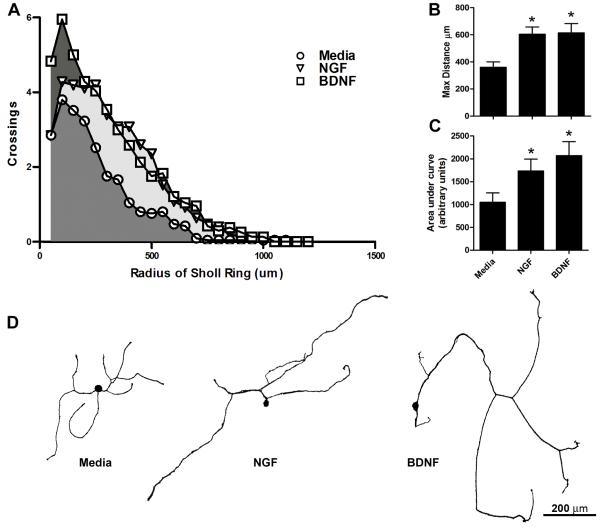
Growth factors, such as BDNF and NGF, are needed for sensory axon extension and arborization during development and can increase axonal sprouting after injury (Lentz et al., 1999; McTigue et al., 1998). Also, treating DRG cultures with NGF or BDNF increases neurite outgrowth (Kimpinski et al., 1997). To evaluate the sensitivity of the semi-automated Sholl analysis for detecting growth-factor mediated changes in axon growth, images of DRG neurons treated with media (control), NGF or BDNF were analyzed. Semi-automated analysis detected significant increases in the maximal distance of axon growth and area under the curve between growth factor treated groups as compared to control (Figure 4). Area under the curve is a measure of axonal arborization and elongation. Thus, the semi-automated analysis is sensitive to experimentally-induced changes in axon growth.
Figure 4. Semi-automated Sholl analysis detects increased axon growth in response to the growth factors NGF and BDNF.
Quantification of neurite outgrowth from DRG neurons treated with media alone (control) or media supplemented with NGF or BDNF (n=21-25/group). A) Sholl profiles generated with the semi-automated analysis revealed increased numbers of axon crossings (indicative of increased axon branching and length) after NGF or BDNF treatment compared to control. B) The maximal distance of axon growth away from the soma was significantly increased with NGF and BDNF treatment compared to control. C) The area under curve produced in (A) was significantly larger with NGF or BDNF treatment vs. control. D) β-tubulin III-stained cellular profiles representative of the statistical average for axon length and total crossings from cultures treated for 24hrs with media, NGF, or BDNF. *p<0.05 vs. media.
Semi-automated analysis can detect changes in maturation state and morphology of oligodendrocyte lineage cells
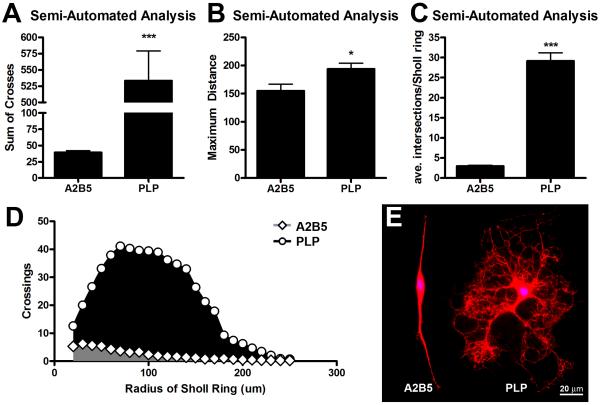
Typically, the state of differentiation for an oligodendrocyte lineage cell is determined by labeling with lineage-specific cell markers (for review see Miller, 2002). For example, A2B5 labels progenitor cells while proteolipid protein (PLP) labels mature, myelinating oligodendrocytes (Richardson, 2001). To determine the utility of semi-automated Sholl analysis for differentiating between oligodendrocyte lineage cells during different stages of development, we generated Sholl profiles for A2B5 or PLP-positive cells. Semi-automated analysis detected a significant increase in the sum of crossings, maximum distance and the average number of intersections per Sholl ring for PLP vs. A2B5 positive cells (Fig. 5).
Figure 5. Semi-automated Sholl analysis is sensitive to oligodendrocyte maturation state.
Quantification of process complexity from immature (A2B5+; n=25) or mature (PLP+; n=18) oligodendrocyte lineage cells. A) Semi-automated Sholl analysis detected an increase in the number of Sholl ring crossings (indicative of increased process branching and extensions from the cell body) for PLP+ vs. A2B5+ cells. B) Processes extending from PLP+ cells reached significantly farther from the cell soma compared to A2B5+ cells. C) The average number of processes intersecting each Sholl ring was significantly increased for mature (PLP+) oligodendrocytes. Note: Only Sholl rings contacted by cell processes were included to determine the average. D) Differences in cell morphology can be quantitatively visualized by plotting the average number of intersection for each Sholl ring, i.e. the Sholl profiles. The area under this curve was significantly larger for PLP+ vs. A2B5+ cells (p<0.001). E) Representative images of A2B5+ and PLP+ stained oligodendrocyte lineage cells. *p<0.05, ***p<0.001 vs. A2B5.
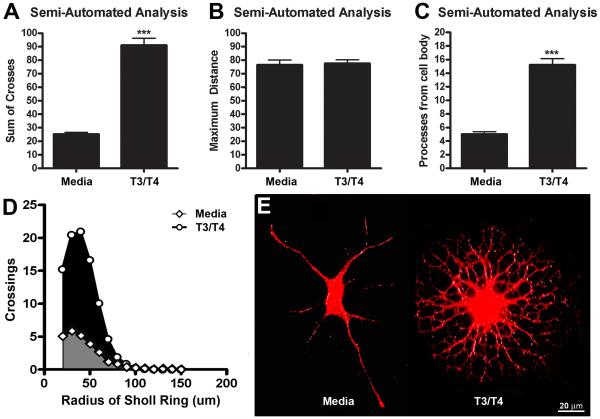
A variety of factors (i.e. cell origin, species, or the treatments used to drive differentiation) can influence the specificity and overlap of lineage markers used to detect oligodendrocyte maturation states (Zhang, 2001). However, as cells of the oligodendrocyte lineage mature, the number and complexity of processes extending from the soma increases (Trapp et al., 1997). To determine if semi-automated Sholl analysis could be used to quantify differences in oligodendrocyte maturation independent of lineage markers, oligodendrocytes were treated with or without T3 and T4, hormones that accelerate oligodendrocyte differentiation (Barres et al., 1994), and then stained using a combination of A2B5 and PLP antibodies conjugated to the same secondary antibody (AF546). Digital images of cells were then analyzed and compared. Even after 24 hrs of T3/T4 treatment (typically treatments lasts 3-4 days to generate high numbers of mature oligodendrocytes; see Barres et al., 1994), semi-automated analysis detected a significant increase in the sum of crossings in T3/T4-treated oligodendrocytes compared to media-treated controls (Figure 6A). The maximum distance was similar in both conditions demonstrating that differences in crossing number were due to increased process complexity and not process length (Figure 6B). The number of processes intersecting the first Sholl ring (an indication of the number of processes from the cell body) was significantly increased by T3/T4 treatment (Figure 6C). Additionally, a Sholl profile curve confirmed the increase in oligodendrocyte process arborization in the T3/T4 treated group (Figure 6D). These results further support the feasibility of using a semi-automated analysis to quantify and differentiate between mature and immature oligodendroglia.
Figure 6. Semi-automated Sholl analysis is sensitive T3/T4-mediated changes in oligodendrocyte process morphology.
Quantification of process complexity from A2B5+/PLP+ oligodendrocyte lineage cells treated with media alone (control) or media supplemented with T3/T4 (n=30). A) Semi-automated Sholl analysis detected an increase in the number of Sholl ring crossings (indicative of increased process branching and extensions from the cell body) after T3/T4 treatment compared to control. B) Regardless of maturation stage, the average maximal distance of oligodendrocyte process length did not change. C) The number of processes extending from the cell body (i.e. number of intersections for the Sholl ring closest to the cell body) significantly increased in oligodendrocytes treated with T3/T4. D) The area under Sholl ring by intersection curve was significantly larger with T3/T4 treatment compared to control (p<0.001). E) Representative images of A2B5+ and PLP+ stained oligodendrocyte lineage cells treated with or without T3/T4 for 24hrs. ***p<0.001 vs. media
DISCUSSION
Previously, we used the semi-automated Sholl technique to detect differences in DRG axon growth (Gensel et al., 2009). In that study, significant differences in axon growth were detected using media isolated from macrophages stimulated with different inflammatory stimuli. The current work further validates this technique by comparing it to manual analysis and demonstrating the ability of the semi-automated method to detect neurotrophin-mediated increases in axon growth. In addition, its utility has been expanded to assess growth in different cell types, specifically cultured oligodendrocytes.
Most semi-automated analysis programs require extensive editing to produce noise-free images (Gutierrez and Davies, 2007). With the current method we overcome this by optimizing image acquisition settings and by using the remove single pixel tool built into the MetaMorph® software. Specifically, by immunolabeling processes with Alexafluor 546 and taking images with a color camera we were able to adjust the red gain and maximize the contrast between signal and background. This approach eliminated the need for any pre-processing of digital images to improve signal-to-noise ratios prior to determining threshold levels. The remove single pixel feature was then used to eliminate any spurious noise in the digital image. Similar automated pre-processing functions exist for most image analysis software programs and can be included in other versions of automated Sholl analyses (see supplemental table 1) User intervention is still required to manually outline the cell and processes of interest as well as select a threshold level; however, on average both of these steps took no more than 15 seconds after a small amount of practice. There was no significant difference in analysis time between experienced and inexperienced users after 25 cells were analyzed.
Overall the time for semi-automated analysis was approximately 3 times faster than manual analysis and was independent of cellular morphology. This time difference (~30 seconds) may seem small on a per cell basis; however, when considered for an entire experiment this time savings is substantial. Significant effects for robust treatments can be detected with as few as 25 cells per group (Figure 4), but group sizes of 40 or more cells are more common (Gutierrez and Davies, 2007; Gensel et al., 2009). If multiple treatments are being tested, and then confirmed using biological replicates, hundreds to thousands of cells could easily be analyzed for a single experiment. Reducing the analysis time by 30 seconds per cell with the semi-automated method could reduce the total time needed for the analysis by days. Importantly, the rapid analysis allows for a large number of cells to be quantified in a small amount of time without the introduction of user fatigue or subjective user variability.
Other systems have been developed to reduce the time needed to generate Sholl profiles, but these have some limitations. The “fast Sholl” analysis developed by Gutierrez and Davies (2007) does not require any digital preprocessing. Instead, it derives Sholl profiles from manually determined points of axonal bifurcation and termination (Gutierrez and Davies, 2007). This system can be performed as rapidly as semi-automated analysis and may be useful to investigators examining cells which have limited meandering axons that cross a single ring multiple times. For cells with branches crossing a single ring several times or when branches grow back toward the cell soma and cross smaller diameter rings, the “fast Sholl” method underestimates the number of ring intersections (Gutierrez and Davies, 2007). This is important if distinctions between arborizing and elongating growth phenotypes are to be made (see below). The fast Sholl method also relies on subjective determination of bifurcation and terminal points which may be prone to user fatigue when quantifying complex cellular morphologies (e.g. see cells of the oligodendrocyte lineage in Figs. 5-6) or large data sets. While the “fast Sholl” analysis provides a low-cost alternative to rapidly quantifying axon profiles for neurons, the sensitivity for quantifying changes in non-neuronal cells has yet to be determined. Other low-cost alternatives also exist (see supplemental table 1) for examples); however, they often have strict limitations on image quality (Gutierrez and Davies, 2007). The current data show that semi-automated analysis can accurately generate Sholl profiles. Although to the best of the authors’ knowledge, the accuracy, precision, or sensitivity of these other systems has not been documented, the results of the current work support the use of semi-automated or automated Sholl analysis programs.
When determining the regenerative potential of therapeutic interventions in vitro, it is important to understand what type of axon growth is being induced. Neurons can extend compact neurites with many branches (arbors) or long solitary elongating axons with few branches (Smith and Skene, 1997). Therapies that induce an arborizing vs. elongating regeneration after injury/disease may have different effects on functional recovery (Guizar-Sahagun et al., 2004). For instance, pain is often associated with excess sprouting (arborization) while long distance regeneration will require elongating axon growth (Hofstetter et al., 2005). Most automated analysis systems available to assess neurite outgrowth in vitro can not distinguish between these two types of axon growth (Price et al., 2006; Ramm et al., 2003; Pool et al., 2008; Mitchell et al., 2007; Bilsland et al., 2006; Meijering et al., 2004). Indeed in those systems, growth is quantified by determining the total area or density of labeled processes sampled from random fields. Little pre-processing is generally needed since outcome measures can be normalized to the number of cell bodies sampled. While these systems can be performed rapidly and are sensitive to increased axon growth, little morphological data is gathered. Sholl profiles provide an ideal way to differentiate between arborizing and elongating phenotypes. By comparing the sum of the intersections between treatment groups at different distances from the cell soma using the semi-automated Sholl analysis presented, we were able to detect subtle changes in branching complexity, i.e. when branches cross over a ring several times and/or grow back toward the cell soma (see Kigerl et al., 2009).
In addition to neurons, semi-automated Sholl analysis was sensitive to treatment-induced morphological changes in oligodendrocyte maturation (see Fig. 6). Typically, oligodendrocyte maturation is determined by qualitative lineage-specific cell markers and/or general process characteristics (unipolar, bipolar, or multipolar) (for review see Miller, 2002). While useful, these criteria do not always identify an exact stage of development. Sholl analysis can be used to quantify process length and complexity in glial cells (Lechuga-Sancho et al., 2006; Murtie et al., 2007). However, as oligodendrocytes mature and develop more branched processes, it becomes difficult to manually perform Sholl analysis quickly and error-free. Semi-automated analysis overcomes these issues while maintaining sensitivity. A goal for treating demyelinating disorders is to increase remyelination by driving oligodendrocyte precursor cells toward a mature, myelinating oligodendrocyte (Mi et al., 2009). Therefore, application of a semi-automated method to quickly and accurately screen oligodendrocyte developmental stages has relevance in a number of demyelinating pathologies (e.g. multiple sclerosis, transverse myelitis).
In order for semi-automated Sholl analysis to be performed accurately, cells must be plated at low densities so individual cells and accompanying processes can be identified. One must also optimize labeling and image acquisition techniques to maximize the contrast between signal and background. If these criteria are not met, the semi-automated program will not produce accurate results. Once optimized, the resolution of the analysis is dependent upon incremental changes in Sholl ring diameter; to increase resolution more Sholl rings must be examined with small increases in diameter. With manual analysis, time and user bias increase as more rings are analyzed. In contrast, semi-automated analysis is objective and the average time the computer takes to record intersections for each ring (< 4 tenths of a second) is negligible. To increase resolution, new sets of Sholl rings can be generated and quickly plugged into the existing macro. For the current work, ring diameters were decreased from 50 (for DRG neurons) to 10 microns to quantify the maturation state of cultured oligodendrocytes. As can be seen by the small error values in Figure 6, changing the ring diameter did not decrease the sensitivity of the semi-automated analysis.
According to Mitchell et al., (2007), in vitro assays of outgrowth should meet the following criteria to be useful tools for quantification. They must: 1) have an endpoint with a window between controls and therapy, 2) reproduce activities of accepted control molecules, 3) be fast, reproducible, and convenient, and 4) be quantitative to allow statistical analyses. Semi-automated Sholl analysis meets these criteria and provides an efficient way to gather morphological data about a variety of in vitro culture systems. When cells are plated at a low density so individual processes can be identified, the semi-automated analysis is sensitive to changes in cellular morphology across different neuronal and non-neuronal cell types. In addition, this method correlates with manual analysis, has minimum inter-user variability, and is 3x faster than manual analysis. The resolution of the analysis can be increased and large samples of cells analyzed easily thereby reducing variability and allowing greater realization of experimental manipulations.
Supplementary Material
ACKNOWLEDGEMENTS
This work is supported by The Craig H. Neilsen Foundation; Paralysis Project of America; NINDS NS037846 and NS059776. We are grateful to Dr. Daniel Ankeny and Dr. Satoshi Nakamura for their assistance in developing Sholl analysis in our laboratory and to Akshata Almad for help generating OPC cultures and labeling oligodendrocyte lineage cells. We also thank Dr. Kristina Kigerl and Dr. Ming Wang for technical assistance with DRG preparations and Dr. Metin Gurcan for advice about the experimental design.
Footnotes
Publisher's Disclaimer: This is a PDF file of an unedited manuscript that has been accepted for publication. As a service to our customers we are providing this early version of the manuscript. The manuscript will undergo copyediting, typesetting, and review of the resulting proof before it is published in its final citable form. Please note that during the production process errors may be discovered which could affect the content, and all legal disclaimers that apply to the journal pertain.
REFERENCES
- Barres BA, Lazar MA, Raff MC. A Novel Role for Thyroid-Hormone, Glucocorticoids and Retinoic Acid in Timing Oligodendrocyte Development. Development. 1994;120:1097–1108. doi: 10.1242/dev.120.5.1097. [DOI] [PubMed] [Google Scholar]
- Bilsland JG, Haldon C, Goddard J, Oliver K, Murray F, Wheeldon A, Cumberbatch J, McAllister G, Munoz-Sanjuan I. A rapid method for the quantification of mouse hippocampal neurogenesis in vivo by flow cytometry - Validation with conventional and enhanced immunohistochemical methods. Journal of Neuroscience Methods. 2006;157:54–63. doi: 10.1016/j.jneumeth.2006.03.026. [DOI] [PubMed] [Google Scholar]
- Brown KM, Gillette TA, Ascoli GA. Quantifying neuronal size: Summing up trees and splitting the branch difference. Seminars in Cell & Developmental Biology. 2008;19:485–493. doi: 10.1016/j.semcdb.2008.08.005. [DOI] [PMC free article] [PubMed] [Google Scholar]
- Gensel JC, Nakamura S, Guan Z, van Rooijen N, Ankeny DP, Popovich PG. Macrophages Promote Axon Regeneration with Concurrent Neurotoxicity. J Neurosci. 2009;29:3956–3968. doi: 10.1523/JNEUROSCI.3992-08.2009. [DOI] [PMC free article] [PubMed] [Google Scholar]
- Guizar-Sahagun G, Grijalva I, Salgado-Ceballos H, Espitia A, Orozco S, Ibarra A, Martinez A, Franco-Bourland RE, Madrazo I. Spontaneous and induced aberrant sprouting at the site of injury is irrelevant to motor function outcome in rats with spinal cord injury. Brain Research. 2004;1013:143–151. doi: 10.1016/j.brainres.2004.03.062. [DOI] [PubMed] [Google Scholar]
- Gutierrez H, Davies AM. A fast and accurate procedure for deriving the Sholl profile in quantitative studies of neuronal morphology. Journal of Neuroscience Methods. 2007;163:24–30. doi: 10.1016/j.jneumeth.2007.02.002. [DOI] [PubMed] [Google Scholar]
- Hofstetter CP, Holmstrom NAV, Lilja JA, Schweinhardt P, Hao JX, Spenger C, Wiesenfeld-Hallin Z, Kurpad SN, Frisen J, Olson L. Allodynia limits the usefulness of intraspinal neural stem cell grafts; directed differentiation improves outcome. Nat Neurosci. 2005;8:346–353. doi: 10.1038/nn1405. [DOI] [PubMed] [Google Scholar]
- Kimpinski K, Campenot RB, Mearow K. Effects of the neurotrophins nerve growth factor, neurotrophin-3, and brain-derived neurotrophic factor (BDNF) on neurite growth from adult sensory neurons in compartmented cultures. Journal of Neurobiology. 1997;33:395–410. doi: 10.1002/(sici)1097-4695(199710)33:4<395::aid-neu5>3.0.co;2-5. [DOI] [PubMed] [Google Scholar]
- Lechuga-Sancho AM, Arroba AI, Frago LM, Garcia-Caceres C, de Celix ADR, Argente J, Chowen JA. Reduction in the number of astrocytes and their projections is associated with increased synaptic protein density in the hypothalamus of poorly controlled diabetic rats. Endocrinology. 2006;147:5314–5324. doi: 10.1210/en.2006-0766. [DOI] [PubMed] [Google Scholar]
- Lentz SI, Knudson CM, Korsmeyer SJ, Snider WD. Neurotrophins support the development of diverse sensory axon morphologies. J Neurosci. 1999;19:1038–1048. doi: 10.1523/JNEUROSCI.19-03-01038.1999. [DOI] [PMC free article] [PubMed] [Google Scholar]
- Lindsay R, Winter J, Evison C. Culture of adult mammalian peripheral neurons. In: Chad J, Wheals H, editors. Cellular Neurobiology: A Practical Approach. IRL Press; New York: 1991. pp. 3–17. [Google Scholar]
- McTigue DM, Horner PJ, Stokes BT, Gage FH. Neurotrophin-3 and brain-derived neurotrophic factor induce oligodendrocyte proliferation and myelination of regenerating axons in the contused adult rat spinal cord. J Neurosci. 1998;18:5354–5365. doi: 10.1523/JNEUROSCI.18-14-05354.1998. [DOI] [PMC free article] [PubMed] [Google Scholar]
- Meijering E, Jacob M, Sarria JCF, Steiner P, Hirling H, Unser M. Design and validation of a tool for neurite tracing and analysis in fluorescence microscopy images. Cytometry Part A. 2004;58A:167–176. doi: 10.1002/cyto.a.20022. [DOI] [PubMed] [Google Scholar]
- Mi S, Miller RH, Tang W, Lee XH, Hu B, Wu WT, Zhang YP, Shields CB, Zhang YJ, Miklasz S, Shea D, Mason J, Franklin RJM, Ji BX, Shao ZH, Chedotal A, Bernard F, Roulois A, Xu JF, Jung V, Pepinsky B. Promotion of Central Nervous System Remyelination by Induced Differentiation of Oligodendrocyte Precursor Cells. Annals of Neurology. 2009;65:304–315. doi: 10.1002/ana.21581. [DOI] [PubMed] [Google Scholar]
- Miller RH. Regulation of oligodendrocyte development in the vertebrate CNS. Progress in Neurobiology. 2002;67:451–467. doi: 10.1016/s0301-0082(02)00058-8. [DOI] [PubMed] [Google Scholar]
- Mitchell PJ, Hanson JC, Quets-Nguyen AT, Bergeron A, Smith RC. A quantitative method for analysis of in vitro neurite outgrowth. Journal of Neuroscience Methods. 2007;164:350–362. doi: 10.1016/j.jneumeth.2007.04.021. [DOI] [PubMed] [Google Scholar]
- Murtie JC, Macklin WB, Corfas G. Morphometric analysis of oligodendrocytes in the adult mouse frontal cortex. Journal of Neuroscience Research. 2007;85:2080–2086. doi: 10.1002/jnr.21339. [DOI] [PubMed] [Google Scholar]
- Pool M, Thiemann J, Bar-Or A, Fournier AE. NeuriteTracer: A novel ImageJ plugin for automated quantification of neurite outgrowth. Journal of Neuroscience Methods. 2008;168:134–139. doi: 10.1016/j.jneumeth.2007.08.029. [DOI] [PubMed] [Google Scholar]
- Price RD, Oe T, Yamaji T, Matsuoka N. A simple, flexible, nonfluorescent system for the automated screening of neurite outgrowth. Journal of Biomolecular Screening. 2006;11:155–164. doi: 10.1177/1087057105283344. [DOI] [PubMed] [Google Scholar]
- Ramm P, Alexandrov Y, Cholewinski A, Cybuch Y, Nadon R, Soltys BJ. Automated screening of neurite outgrowth. Journal of Biomolecular Screening. 2003;8:7–18. doi: 10.1177/1087057102239779. [DOI] [PubMed] [Google Scholar]
- Richardson WD. Oligodendrocyte development. In: Jessen KR, Richardson WD, editors. Glial Cell Development: Basic Principles and Clinical Relevance. Oxford University Press; Oxford: 2001. pp. 21–54. [Google Scholar]
- Sholl DA. Dendritic organization in the neurons of the visual and motor cortices of the cat. J Anat. 1953;87:387–406. [PMC free article] [PubMed] [Google Scholar]
- Sholl DA. The Organization of the Cerebral Cortex. John Wiley; New York: 1956. [Google Scholar]
- Smith DS, Skene JHP. A transcription-dependent switch controls competence of adult neurons for distinct modes of axon growth. J Neurosci. 1997;17:646–658. doi: 10.1523/JNEUROSCI.17-02-00646.1997. [DOI] [PMC free article] [PubMed] [Google Scholar]
- Trapp BD, Nishiyama A, Cheng D, Macklin E. Differentiation and death of premyelinating oligodendrocytes in developing rodent brain. Journal of Cell Biology. 1997;137:459–468. doi: 10.1083/jcb.137.2.459. [DOI] [PMC free article] [PubMed] [Google Scholar]
- Yang ZS, Watanabe M, Nishiyama A. Optimization of oligodendrocyte progenitor cell culture method for enhanced survival. Journal of Neuroscience Methods. 2005;149:50–56. doi: 10.1016/j.jneumeth.2005.05.003. [DOI] [PubMed] [Google Scholar]
- Zhang SC. Defining glial cells during CNS development. Nat Rev Neurosci. 2001;2:840–843. doi: 10.1038/35097593. [DOI] [PubMed] [Google Scholar]
- Kigerl Kristina A., Gensel John C., Ankeny Daniel P., Alexander Jessica K., Donnelly Dustin J., Popovich Phillip G. Identification of Two Distinct Macrophage Subsets with Divergent Effects Causing either Neurotoxicity or Regeneration in the Injured Mouse Spinal Cord. Journal of Neuroscience. 2009 Oct 28;29:13435–13444. doi: 10.1523/JNEUROSCI.3257-09.2009. [DOI] [PMC free article] [PubMed] [Google Scholar]
Associated Data
This section collects any data citations, data availability statements, or supplementary materials included in this article.


