Abstract
Q-ball imaging (QBI) is a high angular resolution diffusion imaging (HARDI) technique which has been proven very successful in resolving multiple intravoxel fiber orientations in MR images. The standard computation of the orientation distribution function (ODF, the probability of diffusion in a given direction) from q-ball data uses linear radial projection, neglecting the change in the volume element along each direction. This results in spherical distributions that are different from the true ODFs. For instance, they are neither normalized nor as sharp as expected, and generally require post-processing, such as artificial sharpening. In this paper, a new technique is proposed that, by considering the solid angle factor, uses the mathematically correct definition of the ODF and results in a dimensionless and normalized ODF expression. Our model is flexible enough so that ODFs can be estimated either from single q-shell datasets, or by exploiting the greater information available from multiple q-shell acquisitions. We show that the latter can be achieved by using a more accurate multi-exponential model for the diffusion signal. The improved performance of the proposed method is demonstrated on artificial examples and high-resolution HARDI data acquired on a 7T magnet.
Keywords: Orientation distribution function (ODF), q-ball imaging (QBI), high angular resolution diffusion imaging (HARDI), constant solid angle (CSA)
INTRODUCTION
Diffusion-weighted magnetic resonance imaging provides valuable information about the fiber architecture of tissue by measuring the diffusion of water in three-dimensional (3D) space. The microscopic diffusion may be measured using the model-free diffusion spectrum imaging (DSI) (1), which exploits the direct Fourier inversion of the diffusion signal. This technique is time intensive, as it measures the signal on a 3D (e.g., 11×11×11) Cartesian lattice. Thus, an alternative approach based on sampling only on one or multiple spherical shells in q-space has been proposed, referred to as high angular resolution diffusion imaging (HARDI) (2). The spherical shell, being a 2D manifold, includes a number of measurement points which grows quadratically with the desired angular resolution, as opposed to cubically with the spatial resolution in the entire 3D lattice of DSI.
While the 3D probability density function (PDF) of diffusion is helpful in studying the tissue microstructure, the orientation distribution function (ODF) – the marginal probability of diffusion in a given direction – is the quantity of interest for mapping the orientation architecture of the tissue. Q-ball imaging (QBI), (3), is a widely used reconstruction scheme for HARDI, from which ODFs are approximated through a spherical tomographic inversion called the Funk-Radon transform (4). This technique’s simplicity and its ability to resolve intravoxel fiber orientations have made it popular for fiber tracking and characterizing white matter architecture. A number of recently proposed methods have turned QBI into a very efficient and robust technique (5)–(11). Moreover, a few works have suggested exploiting data from multiple q-shells to benefit from the high signal-to-noise ratio (SNR) and high angular contrast-to-noise ratio (CNR) of the data acquired at respectively low and high b-values, (3), (12)–(14). Using multiple q-shells also allows us to employ richer models for the diffusion signal, as discussed in this paper. Nevertheless, QBI only allows us to compute the diffusion ODF, which is a blurred version of the underlying fiber distribution (fiber ODF). To overcome this blurring, spherical deconvolution methods have been proposed, (15)–(17). Other strategies used in HARDI include the Persistent Angular Structure (18) and Diffusion Orientation Transform (DOT) (19), both of which compute non-ODF quantities revealing the orientations of microstructural fibers. (For a comparison between all the mentioned methods, see (20)–(21).) In this work, we attempt to reduce the blurring in QBI by defining the ODF as the true marginal probability of diffusion, and proposing a suitable computational approach.
The definition of the ODF used in the original QBI is, however, different from the actual marginal PDF of diffusion in constant solid angle. It is computed as a linear radial projection of the PDF, which does not take into account the quadratic growth of the volume element with respect to its distance from the origin (see the “General ODF Definition” section and Fig. 1 for more details). This inaccurate formulation generally distorts the ODF, produces non-distribution functions, and has created the need for artificial post-processing such as manual normalization and sharpening.
Fig. 1.
Radial integration of the PDF, (left) in a cone of constant solid angle (i.e., the factor r2 is considered), and (right) by linear projection (i.e., without the factor r2 as done in the original QBI).
In this paper, we re-derive the ODF expression for QBI via Fourier analysis, this time starting from the proper definition of the ODF in constant solid angle (CSA). We show that this results in an inherently normalized and dimensionless expression. In addition, we illustrate through our experiments that the new ODFs are naturally sharp and thus multiple fiber orientations are better resolved, potentially improving tractography. We also provide a general formulation for multiple q-shell QBI, and demonstrate the improvement achieved by considering the information from multiple q-shells and using richer multi-exponential models. Furthermore, by making use of the spherical harmonic basis, we demonstrate that the implementation of the new, mathematically correct expression is as straightforward as that of the original formula, or perhaps even simpler, considering that further sharpening (post-processing) is not necessary.
This paper extends our previous conference versions for single (22) and multiple q-shells (23). In particular, we provide more complete mathematical proofs, a regularization scheme, and additional validation and comparisons.1
METHODS
General ODF Definition
The PDF of the diffusion of water molecules, P(r⃗), gives the displacement probability P(r⃗)dv of a molecule, initially placed at the origin, to be in the infinitesimal volume dv located at r⃗ after a certain amount of time. We make the common assumption that this function is symmetric, i.e. P(−r⃗) = P(r⃗). The PDF can be presented in Cartesian coordinates with r⃗=(x, y, z)T and dv= dxdydz. However, for mapping the orientation architecture of the tissue, the representation which mostly interests us is in the standard spherical coordinates, parameterized by (r,θ,φ), where r⃗=rû with û(θ,φ)=(sin θ cosφ, sin θ sin φ, cos θ)T the unit direction vector. The volume element in this case is dv=r2drdΩ with dΩ= sinθdθdφ being the infinitesimal solid angle element.
We denote by ODF(û)dΩ the probability of diffusion in the direction û through the solid angle dΩ, which is computed by integrating the displacement probabilities, i.e. P(r⃗)dv= P(rû)r2drdΩ, for all magnitude r, while keeping û constant:
or simply:
| [1] |
The above definition, which is normalized and dimensionless, is the integral of the probability values in a cone of “very small” constant solid angle (Fig. 1, left). This correct definition was used for instance by the authors of (1) in DSI, where P(r⃗) was first computed from the diffusion data via Fourier inversion and then integrated to calculate the ODF, and also in (24)–(25) for diffusion tensor imaging (DTI), where the ODF was analytically computed. However, the original expression for ODF reconstruction in QBI (3), is different from Eq. [1], in the sense that the integral is not weighted by the important factor r2 (Fig. 1, right). To the best of our knowledge, the only paper which has so far considered this factor in (single shell) QBI, is a very recent parallel work (11) (published independently after a conference version of our paper (22) had just been accepted), where the ODF is approximated using Eq. [1]. (See the “Theoretical Comparison” section for details.)
Computing the ODF without the factor r2 would be equivalent to assuming the PDF to be P(r⃗)/|r⃗|2, as . This radial projection gives an artificial weight to P(r⃗) which is, respectively, too large and too small for points close to and far from the origin, and in fact, the computed quantity would be different just as the zeroth moment of a one-dimensional function, P̅(r):= P(rû) is different from its second moment. For instance, a consequence of not including r2 is that the computed ODF will not be necessarily normalized, and an artificial normalization factor will be required. Moreover, the ODF will not be dimensionless, since, given that P(r⃗) has the dimension of L−3 (L being the length), the dimensions of P(r⃗)r2dr and P(r⃗)dr are respectively 1 and L−2.
As an example intended for comparison, we compute the ODFs with r2 (which we shall call CSA ODF when comparing to the original method) and without r2 (original ODF) in the case of DTI (26), with the following standard Gaussian PDF:
| [2] |
where D is the covariance matrix (proportional to the diffusion tensor). The computed ODFs are:
| [3] |
| [4] |
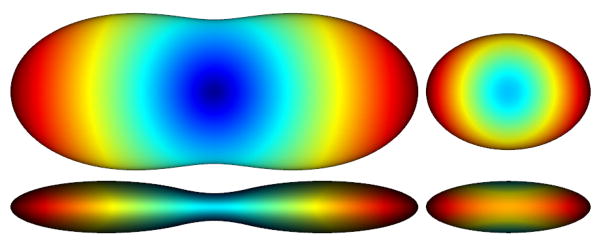
where Z is the normalization constant that subsequently needs to be computed and considered in the original ODF(û) (see (3)). An example of this pair of ODFs is illustrated in Fig. 2. (No min-max normalization is used in any of the figures.)
Fig. 2.
DTI example of ODF reconstruction (with {10, 5, 1} as the diagonal entries of the tensor), shown from two view angles, (left) considering the factor r2 (CSA) (right) without the factor r2 and after normalization. Note how less sharp the latter is and how incompletely it represents the true structure of the ODF.
Next, we derive a closed-form expression for the ODF in QBI using the correct r2 -weighted integral.
Q-ball Imaging ODF Reconstruction
Let E(q⃗) be the 3D Fourier transform of P(r⃗). We have the values of E(q⃗) measured on a q-ball, i.e., the frequencies with constant norm |q|= q0, as Ẽ(û):= E(q0û)= S(û)/S0, where S(û) is the HARDI signal and S0 is the non diffusion-weighted (or B0) image. In addition, since the diffusion signal at q⃗= 0 is S0, one can see that E(0)= 1. Alternatively, E(0) is the zero frequency of a PDF which is its integral over the entire space, yielding 1.
Our mathematical derivation is based on the following two fundamental facts from Fourier analysis:
The Fourier transform of P(r⃗)|r⃗|2 is − ∇2E(q⃗), where ∇2 is the Laplacian operator (proof presented in Appendix A).
For a symmetric function f: ℝ3 → ℝ with the 3D Fourier transform function f̂(q⃗), and for the arbitrary unit vector û, we have that , where û⊥ is the plane perpendicular to û (proof presented in Appendix B).
Combining these statements with Eq. [1] leads to
| [5] |
Now, without loss of generality, we choose our coordinates such that ẑ = û, thus making û⊥ the qx−qy plane. We then use the following expansion for the Laplacian in spherical coordinates (q,θ,φ):
| [6] |
where is the Laplace-Beltrami operator defined independently of the radial component q, as . The surface integral on the qx−qy plane is computed by fixing and using the expression d2q⃗= qdqdφ as the surface element (see also very recent work (10)), which yields
| [7] |
We can see that the integral of the first term is constant and independent of E(q⃗) and its derivatives:
| [8] |
where the subscript indicates the partial derivative. We made the standard assumptions that the diffusion signal and its radial derivative go to zero (sufficiently fast) as q → ∞, and also that the derivative is bounded at the origin. Therefore we have
| [9] |
while is kept constant in the integration.
To compute the integral of the second term, the values of E(q⃗) are required in the entire q-space (as the radial integral is from zero to infinity). The above equation could be used for example in DSI, where direct computation of the ODF from the diffusion images would eliminate the need for 3D Fourier inversion. In QBI, however, the values of E(q⃗) are available only on the q-ball, from which E(q⃗) needs to be approximated. In this work, we consider the following radial mono-exponential model:
| [10] |
where q0 is the radius of the q-ball. This type of interpolation has been presented and discussed in (27) as E(qû) ≅ e−τq2.ADC(û), where the Apparent Diffusion Coefficient (ADC) is assumed to be constant in each direction, and estimated as . An advantage of this model over the original QBI model, i.e. E(qû) ≅ Ẽ(û)δ(q − q0) (see (28),(10)), is the compatibility with E(0)=1.
After applying the mono-exponential assumption and a few more steps of calculations (see Appendix C for details), the following ODF expression is derived:
| [11] |
Finally, rewriting the expression independently of the choice of axes, the following analytical formula can be shown to hold for the ODF:
| [12] |
where FRT is the Funk-Radon transform (4), defined as
| [13] |
with δ(•) the Dirac delta function. Next, we compare our method from the theoretical aspect with some other approaches.
Theoretical Comparison
The CSA ODF expression derived in Eq. [12] is dimensionless and intrinsically normalized, since the integrals of the first and second terms over the sphere are respectively 1 and 0. This is in contrast to the ODF formulas used in the original QBI, i.e., , and also in (11), where an artificial normalization factor Z is needed.
Additional fundamental differences can be observed in the approach presented here, compared to (11). As we demonstrated above, integration of the radial part of the Laplacian on the plane always results in a constant (1/4π in Eq. [9]) without assuming any model for the diffusion signal. Yet, (11) uses the Bessel approximation of the Dirac delta function which yields a variable (sometimes negative) term. As for the integral of the tangential term of the Laplacian, we use the exponential model that is in particular consistent with E(0)=1, in contrast to (11) that assumes the tangential term of the Laplacian to be zero everywhere except on the q-ball (Bessel approximation again), leading to an expression rather similar to Laplace-Beltrami sharpening (LBS) (29). A major disadvantage of approximating the Dirac delta with a Bessel function while considering the factor r2 is that, unlike for P(r⃗) which is typically concentrated near the origin, the projection of P(r⃗)|r⃗|2 may have its highest values at a certain positive radius coinciding with the side lobes of the Bessel function, reducing the accuracy of the approximation.
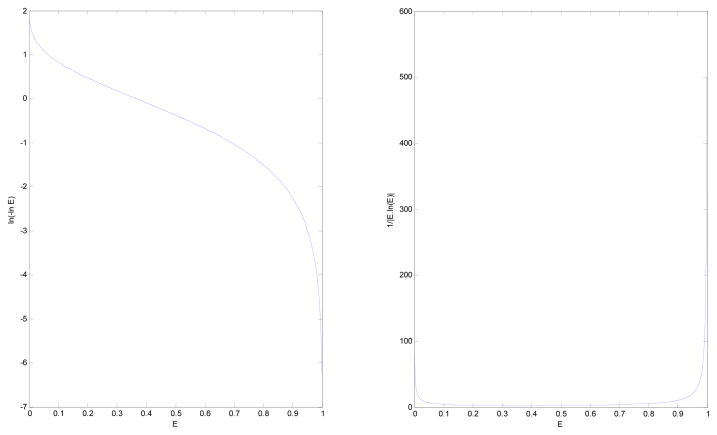
From Eq. [12], it can be seen that the essential quantity used in computing the ODF from the raw data is L(Ẽ):=1n (−1nẼ), plotted along with the absolute value of its derivative in Fig. 3. Given that the second derivative of this function is zero at the inflection point e−1 ≈ 0.368, L(Ẽ) is almost linear for the values of the signal close to that point. Therefore, from Eq. [12] it can be observed that the ODFs reconstructed from signals with values close to e−1 will be similar to those obtained by the original QBI (3) with LBS (note that FRT commutes with ). This resemblance ends as the range of the signal values approaches 0 or 1 (for example when the diffusion is respectively higher or lower, or the data is acquired at respectively higher or lower b-values), in which case L(Ẽ) becomes quite nonlinear, amplifying the measured signal. This nonlinearity can be concluded to be the main source of improvement seen in the experimental results obtained using Eq. [12] (predominantly seen in resolving the fiber crossings, see the “Results and Discussions” section).
Fig. 3.
Behavior of (left) ln(−ln E) and (right) the absolute value of its derivative with respect to E. Note how unstable they are for E close to 0 or 1.
DOT (19) is a useful method for fiber orientation mapping that computes the PDF of the diffusion of water P(r0û) at a fixed distance r0 from the origin, and is therefore a different quantity from ODF. DOT provides essential information about the fiber microstructure, yet, at the cost of an additional parameter, r0, which is not always trivial to determine. The optimum r0 depends on the fiber microstructure and may vary in different regions of the volume. In contrast, ODF sums up the orientation information for all radii. In fact, since CSA ODF and DOT both use the exponential model for the diffusion signal, we see from Eq. [1] that,
| [14] |
Implementation
Our implementation of the ODF reconstruction makes use of the spherical harmonic (SH) basis, , which is common for the analysis of HARDI data. The steps taken here to numerically compute Eq. [12] are similar to those described in (6). Particularly, we use the real and symmetric modified SH basis in (6), where SH functions are indexed by a single parameter j= k(k+1)/2+m+1, with corresponding kj and mj, as follows:
| [15] |
We adopt a minimum square error scheme to compute the modified SH coefficients cj of the double logarithm of the signal, such that
| [16] |
where R=(l+1)(l+2)/2, with l being the order of the SH basis. Next, since the SH elements are eigenfunctions of the Laplace-Beltrami operator, we compute by multiplying the coefficients cj by their corresponding eigenvalues, −kj(kj+1). Then, as suggested in (6), the Funk-Radon transform is computed by multiplying the coefficients by 2πPkj(0), where Pk(•) is the Legendre polynomial of degree k, with for even k. Finally, given that , the SH coefficients of the ODF are derived as
| [17] |
By taking advantage of the SH framework, this implementation of the proposed technique is as straightforward as the one introduced in (6) for the original QBI ODF formula. Additionally, neither normalization, nor sharpening is required.
Regularization
As mentioned before, the essential quantity used in computing the ODF from the raw data is L(Ẽ):=1n (−1nẼ), plotted in Fig. 3. Hence, if there is a relatively constant error ΔẼ in the diffusion data, the error introduced in the computed ODF will be proportional to the derivative of L(Ẽ):
| [18] |
As Fig. 3 suggests, this quantity becomes unstable for values of Ẽ very close to 0 and 1, and subsequently amplifies the error in the diffusion data.
To overcome this problem, besides the approach introduced in (30) to impose positivity constraint and spatial regularity, the more robust L1 error norm may be used to compute the SH coefficients from Eq. [16]. Using a robust error norm, the noise will not contribute to the error function for high values of L(Ẽ) (when Ẽ is very close to 0 or 1) as much as when the L2 error norm is minimized, therefore the ODF will remain more robust to noise.
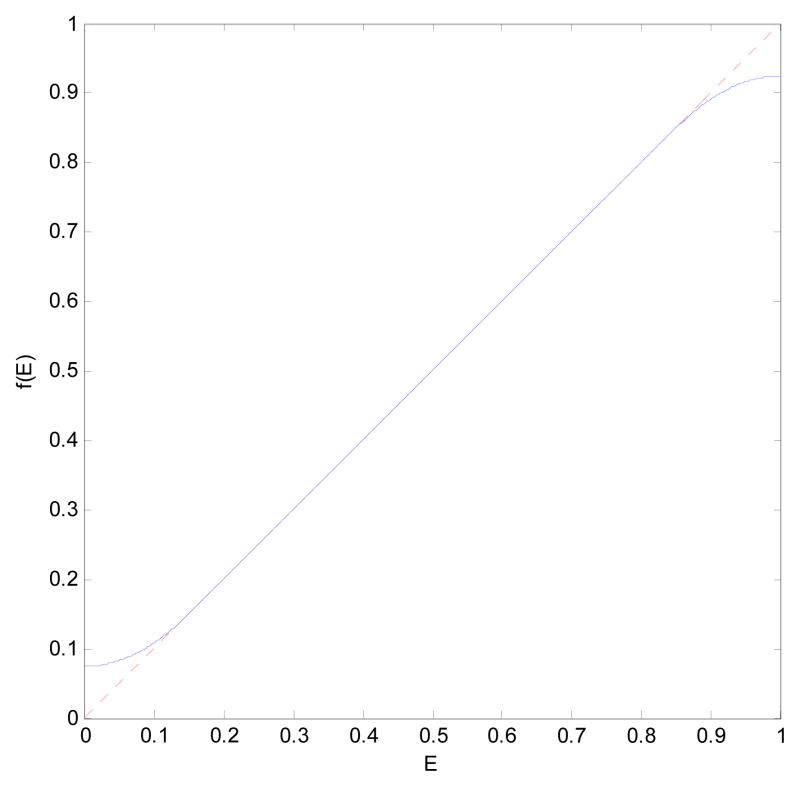
We also propose the use of a flexible threshold on the diffusion data to keep their values away from the unstable regions of [0,δ1] and [1 −δ2, 1], where the thresholds δ1 and δ2 are manually defined. To perform this operation, we use the following function f(Ẽ):
| [19] |
which is plotted in Fig. 4 for δ1=δ2= 0.15. In practice, however, δ1 and δ2 do not need to be greater than 0.001 and therefore the distorting effect on the signal is minimal.
Fig. 4.
The regularization function used for the diffusion signal to avoid the unstable regions (blue curve). The truncating margins are exaggerated for better visualization.
Conversely, the ODF is most stable to noise when ΔL(Ẽ) is minimum, which is achieved for Ẽ= e−1 ≈ 0.368. This gives us a clue on how to choose an optimum b-value in data acquisition. Particularly, in the mono-exponential model, since Ẽ= e−b.ADC where the ADC is assumed independent of the b-value, the optimum b-value is obtained as
| [20] |
where 〈ADC〉 is the mean ADC in the region of interest. Note that this result holds only in the simple model which assumes both ADC and ΔẼ to be independent of the b-value. For further discussion about the optimal b-value in different techniques, see (21) and (31).
Extension to Multiple q-Shells
Multi-Exponential Model
We have so far employed the proposed technique to compute the ODF from a single q-shell. However, if diffusion data are available on multiple q-shells, this technique can be applied to reconstruct the ODF while exploiting the information from all the q-shells. With more available data, richer models become practical and appealing. Here we consider the following radial multi-exponential model (see (19),(32)),
| [21] |
with the constraints
| [22] |
where Eq. [22] comes from E(0)=1. Once the values of λk and αk are estimated (see the “Parameter Estimation” subsection), they can be used in the following more general ODF expression, which we have derived in details in (33):
| [23] |
This can be implemented quite similarly to what we explained in the “Implementation” section, with Eq. [16] being the only difference, as it now writes
| [24] |
In addition, the methods suggested in the “Regularization” section can be applied to αks, to reduce the effect of noise.
Parameter Estimation
To approximate the diffusion signal in a direction û by a weighted sum of N exponentials, we need to estimate the 2N parameters λk(û) and αk(û), for k=1,…, N. Therefore, at least 2N−1 independent equations – besides Eq. [22] – are required, which can be obtained from the HARDI signals measured on M q-balls, for M ≥ 2N−1, as follows:
| [25] |
where Ẽi(û):= E(qiû) and qi corresponds to the ith q-ball. Parameterizing the problem in terms of b-values, bi = τqi2, and choosing the physical units such that the diffusion time τ =1, we obtain
| [26] |
Numerical optimization approaches such as the trust region algorithm, (34), may be employed to solve this non-linear system in the most general case. Here, however, we discuss two special cases (one familiar and one new) with analytical solutions. We continue this subsection considering a fixed direction, and therefore drop the notation (û).
The mono-exponential assumption (N=1) requires measurement on at least M=1 q-ball. M=1 leads to λ1= 1 and α1=Ẽ11/b1. As we have shown in (33), α1γcan also be a solution with any constant γ. Therefore, choosing γ= b1 results in the solution α1= Ẽ1, which is consistent with what we already derived (Eq. [12]). Furthermore, if measured values are provided on more than one q-shell and the mono-exponential model is still desired, then the assumption in this model (ADC being independent of the b-value) suggests that the best exponential can be fitted by computing the average ADC across all the q-balls.
Another practical case of great interest arises when we consider the richer bi-exponential model (N=2, see for example (35)–(36)) to reconstruct the ODFs from (at least) M=3 q-shells. For M=3, the following system of equations holds for each direction:
| [27] |
In general, this set of equations can be solved numerically. Nevertheless, an analytical solution can be derived for the particular and reasonable case when the sequence 0,b1,b2,b3 is an arithmetic progress. (The sequence xi is an arithmetic progress if xi − xi−1 is constant). We describe this solution here, along with some regularization that guarantees the parameters to remain within the correct range.
Without loss of generality, let us assume α ≥ β, and also choose the physical units such that b1=1, b2=2, and b3= 3. Then,
| [28] |
We first define and calculate the following two quantities:
| [29] |
The parameters are afterward computed as:
| [30] |
However, we still need to ensure that they are real and in the correct ranges. One can verify that these conditions are satisfied by enforcing the following constraints:
| [31] |
Thus, we can obtain the optimal values of α, β, and λ, by initially projecting Ẽi s onto the subspace defined by the above inequalities, and then computing the parameters. Note that such projection is usually necessary, because the bi-exponential model may not be fully accurate and the data may be noisy. Furthermore, using a small separating margin of δ= 0.01 ~ 0.1 in the inequalities makes the ODFs more stable in practice.
RESULTS AND DISCUSSIONS
Results from Single q-Shell
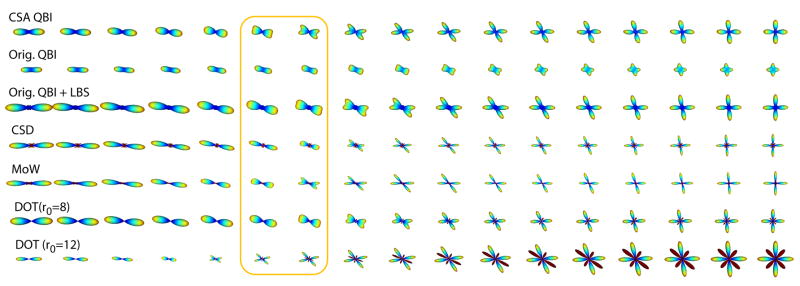
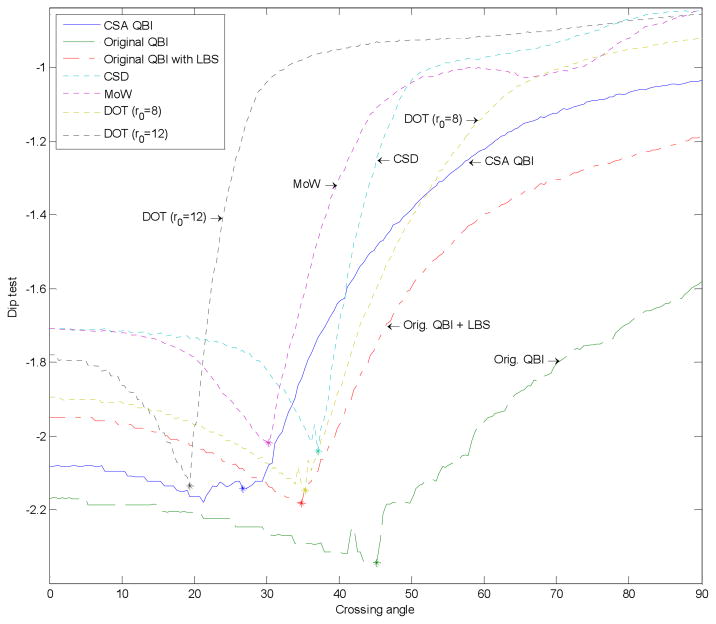
To validate our approach, we first show results using artificial data. We simulated fiber crossing by generating diffusion images from the sum of two exponentials, Ẽ(û)=(e−ûTD1û+ e−ûTD2û)/2, where D1 is a diagonal matrix with diagonal entries (9, 2, 2), and D2 is D1 rotated about the y-axis by a varying angle. Assuming an ADC of 0.7×10⁻³ mm2s−1 (the mean diffusivity in brain parenchyma), these diffusion values correspond to a b-value of 4800 s/mm2. We tested the following techniques to reconstruct their corresponding quantities from 76 diffusion directions uniformly sampled on the sphere, in the eighth order SH basis: ODF approaches such as CSA QBI (with no regularization), the original QBI, and the original QBI followed by LBS,( ), with λ=0.15 chosen to produce the optimal results; and also non-ODF approaches such as Constrained Spherical Deconvolution (CSD) (16), Mixture of Wisharts (MoW) (37) using nonnegative least squares (NNLS) with manually optimized parameters, and DOT (19) for two radii. The results are presented in Fig. 5. As can be seen, DOT with the larger radius, CSA QBI, and MoW (respectively) resolve the crossing with the smallest angles. We also verified this using the dip test (38) on sample points generated from the reconstructed distributions. The dip test measures multimodality in a sample by the maximum difference, over all sample points, between the empirical distribution function, and the unimodal distribution function that minimizes that maximum difference. As can be observed in Fig. 6, the two modes of the distributions are distinguished in the same order as mentioned above. It should however be noted that DOT and MoW require manual adjustment of parameters to produce the best results, a process that is not so convenient for unknown real data, in contrast to CSA QBI which is parameter free. In addition, the negative values seem to appear only in the four non-QBI methods in this particular experiment (although they can be corrected, they may indicate potential intrinsic problems with such computations). CSA QBI (with no regularization) and DOT (for higher radius), however, were less stable to noise compared to the rest of the methods when we repeated the simulation with Rician noise.
Fig. 5.
Experimental results on synthetic data with fiber crossing, using: Proposed CSA QBI, original QBI after normalization, original QBI with Laplace-Beltrami sharpening (LBS), Constrained Spherical Deconvolution (CSD), Mixture of Wisharts (MoW) with manually optimized parameters, and Diffusion Orientation Transform (DOT) for two radii. The two columns in the box correspond to the crossing angles of 28.1° and 33.8°. Dark red represents negative values.
Fig. 6.
Results of the dip test (a measure of multimodality) using the same distributions as shown in Fig. 5. The asterisk (*) on each curve indicates the minimum angle where the bimodality is detected. The y-axis is plotted on a logarithmic scale.
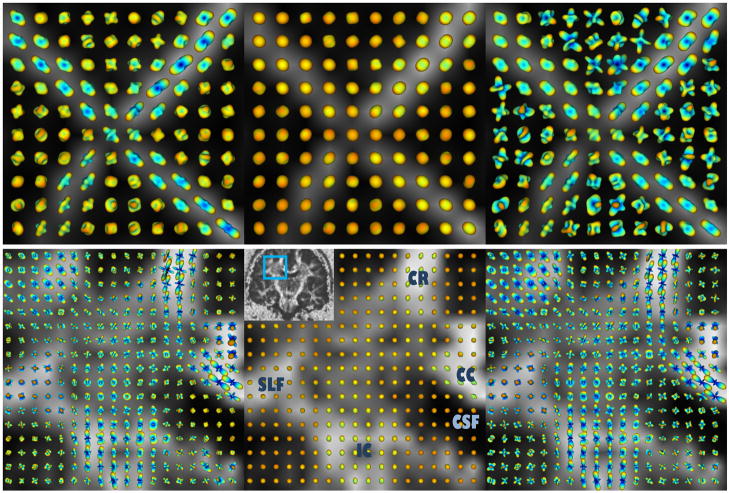
We also tested our method on four real HARDI datasets; first on the physical phantom in (39), which was constructed from excised rat spinal cords and designed to have crossing tracts (90 diffusion images at b=1300 s/mm2, no regularization), and then on a public human brain dataset (40) (200 diffusion images at b=3000 s/mm2, regularization parameters δ1=δ2= 0.001). The ODFs were reconstructed in the fourth order SH using three QBI approaches: our proposed method, the original QBI, and the original QBI followed by LBS with λ=0.5 for the rat data and λ=0.8 for the brain data. Results are superimposed on the fractional anisotropy (FA) map and presented in Fig. 7. (ODFs are shown as they are; no min-max normalization is used in any of the figures.) Our method (left) produces sharper and more accurate ODFs than the original QBI (middle). In addition, although sharpening (right) enhances the original QBI ODFs considerably in anisotropic tissue, it causes significant instability in isotropic regions (e.g. the background of the rat phantom and the cerebrospinal fluid (CSF) in the human brain data), in contrast to our technique which preserves isotropy fairly well. For the human brain dataset, we focus on the region of the centrum semiovale, where three major fiber bundles intersect: the internal capsule (IC)/corona radiata (CR), the radiations of the corpus callosum (CC), and the superior longitudinal fasciculus (SLF).
Fig. 7.
Reconstructed ODFs from (top) rat spinal cord phantom and (bottom) human brain, shown on the FA map, using: (left) CSA QBI, (middle) original QBI after normalization, and (right) original QBI with LBS.
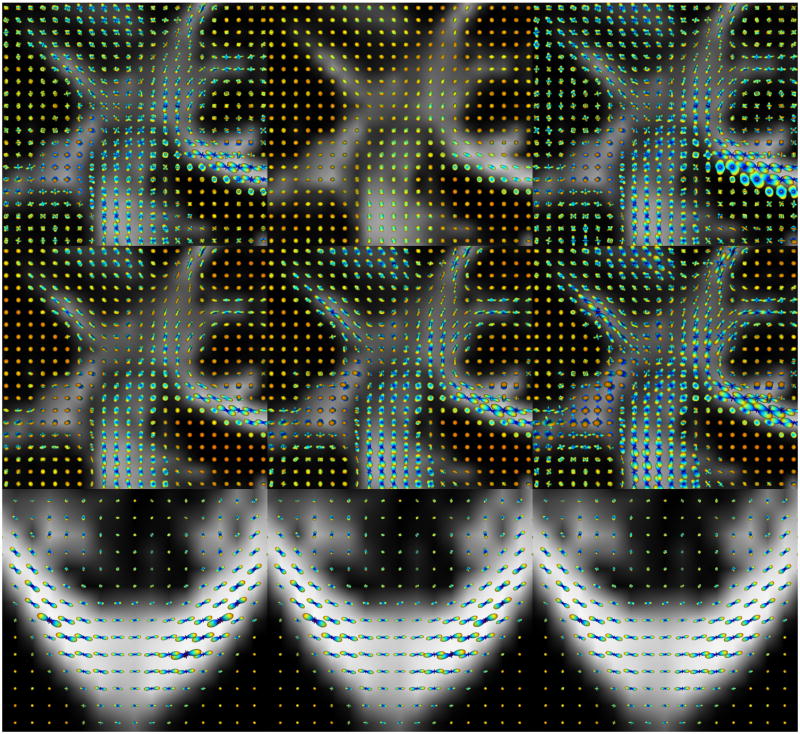
We performed additional experiments on a human brain HARDI dataset acquired at 7T with 256 diffusion directions. (For the fourth real dataset, see the “Results from Multiple q-Shells” section.) Similar results as mentioned above were obtained for b=3000 s/mm2 with no regularization (Fig. 8, top row). We then compared the results with those obtained from DOT for three different radii, which are depicted in Fig. 8 (middle row). As can be seen, for the smallest radius r0 (middle row, left), the fiber crossings are not well resolved. As the radius increases (center), the resolution of the crossings improves. Eventually for the largest r0 (middle row, right), regions with fiber crossings are very well reconstructed. However, negative values (shown in dark red) start to appear in anisotropic regions. (These values can be projected to zero, yet without affecting the eventual fiber orientations.) In all cases, DOT achieves quite isotropic PDFs in the CSF.
Fig. 8.
(Top row): Reconstructed ODFs from 7T human brain data shown on the FA map, using: (left) CSA QBI, (middle) original QBI after normalization, and (right) original QBI with LBS. (Middle row): Results of DOT for different radii, ascending from left to right. (Bottom row): ODFs reconstructed using regularization parameters of (left) 0.001, (middle) 0.01, and (right) without regularization using the L1 error norm. A singly refocused 2D single shot spin echo EPI sequence was used. Image parameters were: FOV: 192×192 mm2 (matrix: 196×96) to yield a spatial resolution of 2×2×2 mm3, TR/TE 4800/57 msec., acceleration factor (GRAPPA) of 2 and 6/8 partial Fourier were used along the phase encode direction. Diffusion-weighted images were acquired at three b-values of 1000, 2000 and 3000 s/mm2 with 256 directions, along with 31 baseline images. EPI echo spacing was 0.57 msec. with a bandwidth of 2895 Hz/Px.
Finally, we reconstructed the ODFs in a dataset acquired from the same subject at b=2000 s/mm2. In contrast to the previous dataset where no regularization was needed, the noise in this one made the use of regularization necessary, particularly in the highly anisotropic regions (see the “Regularization” section). Figure 8 (bottom row) shows the corpus callosum in an axial view, where ODFs are reconstructed with the regularization parameters of δ1=δ2= 0.001 (bottom, left), δ1=δ2= 0.01 (bottom, center), and once without any regularization but using the L1 error norm (bottom, right). As can be seen, increasing δ1 and δ2 more than 0.001 did not result in any significant improvement. However, using the L1 error norm to compute the SH coefficients considerably reduced the number of negative values.
Results from Multiple q-Shells
To demonstrate the advantages of exploiting multiple q-shells in QBI, we first show experimental results on a synthetic example which consists of large diffusion values in two orthogonal directions. We synthesized diffusion images by sampling the sum of two exponentials, , on seven q-shells (b=q2=1,2,., 7) and in 76 directions, uniformly distributed on the sphere. Figure 9 illustrates the ODFs reconstructed from single q-shells for different b-values, and from three q-shells with both mono-exponential and bi-exponential models. For the data acquired at low b-values (b=1,2,3), the proposed bi-exponential model using three q-shells is the only method correctly resolving the horizontal and vertical ODF peaks, corresponding to the strong ADC values in the directions φ= 0°,90°,180°,270°. It should be noted, however, that the drawback of such a more general model is its lesser robustness to noise (as low order models are often more robust).
Fig. 9.
Results of the ODF reconstruction on synthetic data. Note how the bi-exponential model correctly resolves the maxima of the ODF from low b-values. Dark red represents negative values. These values do not appear often in general, nonetheless, a possible formal approach to handle them can be found at (30).
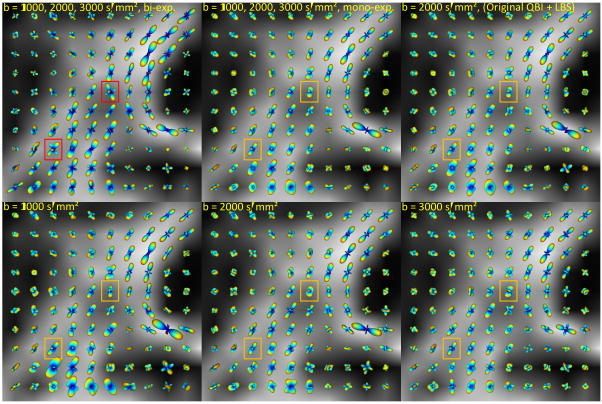
We also tested our method on a 7T monkey brain HARDI dataset introduced in (41). The proposed method was used to reconstruct the ODFs from the three b-values of 1000, 2000, and 3000 s/mm2, using both bi-exponential and mono-exponential methods and also from the single q-shells individually. Figure 10 depicts the results on a coronal slice through the centrum semiovale area, superimposed on the FA map. (For comparison, one of the sub-figures shows results by the original QBI.) Note how using the bi-exponential method allows for more clear recovery of certain fiber bundles, such as callosal radiations and corticospinal tract, and better resolution of crossing areas (see outlined regions in Fig. 10).
Fig. 10.
Reconstructed ODFs from the real brain data, shown on the FA map. The bi-exponential model ODFs (top, left) have been scaled down 1.5 times for better comparison. All the ODFs except those in (top, right) are CSA ODFs. Note how the bi-exponential model for diffusion improves the resolution of fiber crossings, compared to the mono-exponential (constant ADC) model. An anesthetized Macaca mulatta monkey was scanned using a 7T MR scanner (Siemens) equipped with a head gradient coil (80mT/m G-maximum, 200mT/m/ms) with a diffusion weighted spin-echo EPI sequence. Diffusion images were acquired (twice during the same session, and then averaged) over 100 directions uniformly distributed on the sphere. We used three b-values of 1000, 2000, and 3000 s/mm2, TR/TE of 4600/65 ms, and a voxel size of 1×1×1 mm3.
CONCLUSIONS
We have proposed a novel framework to correct a mathematical inaccuracy in the original q-ball imaging, and have demonstrated its improved performance through experiments on simulated and real HARDI data. We also extended our technique to the case with multiple q-shells, and observed enhancement in the results which were, however, achieved at the cost of additional (while still moderate) acquisition time. Whether using multiple q-shells and reducing the number of diffusion directions (to maintain the same acquisition time) would still be helpful, is a subject of current research.
Acknowledgments
This work was partly supported by NIH (P41 RR008079, P30 NS057091, R01 EB007813, R01 EB008432, R01 EB008645, CON000000004051 3014), NSF, the Keck Foundation, ONR, NGA, ARO, and DARPA. We would like to thank J. Campbell of McGill University, and the authors of (40) for providing us with real HARDI data. CSD (16), MoW (37) and the dip test were performed using respectively the MRtrix package by J. D. Tournier, the program “Multi-fiber Reconstruction from DW-MRI” by B. Jian, and a public code by F. Mechler.
APPENDIX A
Fourier Transform of P(r⃗)|r⃗|2
From the Fourier analysis, we know that if E(q⃗) is the Fourier transform function of P(r⃗), then:
| [32] |
where F{•} is the Fourier transform. By writing the second equation for y and z and summing them all, we will get:
| [33] |
This has also been exploited in a parallel work, (11).
APPENDIX B
Computing the Radial Projection of a Symmetric Function in the Fourier Domain
Let f: ℝ3 → ℝ be a symmetric function with the 3D Fourier transform function f̂(q⃗), and û be an arbitrary unit vector. We will show that , where û⊥ is the plane perpendicular to û.
Without loss of generality, we choose our coordinates such that ẑ = û, thus making û⊥ the qx−qy plane. We first rewrite the expression as a volume integral over the entire space, with the help of Dirac delta functions:
| [34] |
The factor ½ is required because we need the integral only on the positive half of the z-axis, and the function is symmetric. Let us define g(x, y, z):=δ(x)δ(y). For the two functions f, g: ℝ3 → ℝ with Fourier transform functions f̂(q⃗) and ĝ(q⃗), Parseval’s theorem states that
| [35] |
Computing ĝ(qx, qy, qz)= 2πδ(qz) and replacing it in the above equations, leads to
| [36] |
The integral is taken on the qx−qy plane, which is û⊥. This completes the proof.
APPENDIX C
Incorporating the Mono-Exponential Model in the ODF Formula
We will show that by assuming the mono-exponential model, , we have:
| [37] |
while is kept constant in the integration. We begin by proving a lemma:
Lemma
For a continuous and differentiable function f(θ, φ): S2 → ℝ with S2 being the unit sphere, we have:
| [38] |
where the subscript indicates the partial derivative.
Proof
We use the following expansion for Laplace-Beltrami:
| [39] |
Integral of the second term is zero, because of the periodicity of fφ:
| [40] |
Thus, the only remaining term in the integral is fθθ, which completes the proof of the lemma.
We now change the order of the integrals twice, while using the lemma in between:
| [41] |
Next, we compute the radial integral:
| [42] |
Given that 0< Ẽ(û)<1 → ln Ẽ(û)<0, the above expression vanishes as q → ∞. Also, since for a negative function f(θ) we have , the above integral simplifies as:
| [43] |
Substituting in Eq. [41]:
| [44] |
We completed the proof by reusing the lemma in the last step.
Footnotes
After our conference paper was accepted and its extension to multiple shells was submitted, a parallel and independent work was published (11), where the proper definition of the ODF was considered in single q-shell QBI. However, in addition to not considering multiple shells and the richer models as done here, the authors of (11) take the integral of the diffusion signal on a circle and not on the entire plane, and that results in a different formula which is not necessarily normalized and leads to other potential inaccuracies. (See the “Theoretical Comparison” section for further details.)
References
- 1.Wedeen VJ, Hagmann P, Tseng WI, Reese TG, Weisskoff RM. Mapping complex tissue architecture with diffusion spectrum magnetic resonance imaging. Magnetic Resonance in Medicine. 2005;54(6):1377–1386. doi: 10.1002/mrm.20642. [DOI] [PubMed] [Google Scholar]
- 2.Tuch DS, Reese TG, Wiegell MR, Makris N, Belliveau JW, Wedeen VJ. High angular resolution diffusion imaging reveals intravoxel white matter fiber heterogeneity. Magnetic Resonance in Medicine. 2002;48(4):577–582. doi: 10.1002/mrm.10268. [DOI] [PubMed] [Google Scholar]
- 3.Tuch DS. Q-ball imaging. Magnetic Resonance in Medicine. 2004;52(6):1358–1372. doi: 10.1002/mrm.20279. [DOI] [PubMed] [Google Scholar]
- 4.Funk P. Über eine geometrische Anwendung der Abelschen Integralgleichung. Mathematische Annalen. 1916;77:129–135. [Google Scholar]
- 5.Anderson AW. Measurement of fiber orientation distributions using high angular resolution diffusion imaging. Magnetic Resonance in Medicine. 2005;54(5):1194–1206. doi: 10.1002/mrm.20667. [DOI] [PubMed] [Google Scholar]
- 6.Descoteaux M, Angelino E, Fitzgibbons S, Deriche R. Regularized, fast, and robust analytical q-ball imaging. Magnetic Resonance in Medicine. 2007;58(2):497–510. doi: 10.1002/mrm.21277. [DOI] [PubMed] [Google Scholar]
- 7.Hess CP, Mukherjee P, Han ET, Xu D, Vigneron DB. Q-ball reconstruction of multimodal fiber orientations using the spherical harmonic basis. Magnetic Resonance in Medicine. 2006;56(1):104–117. doi: 10.1002/mrm.20931. [DOI] [PubMed] [Google Scholar]
- 8.Michailovich OV, Rathi Y. On approximation of orientation distributions by means of spherical ridgelets. Proc. of 5th IEEE ISBI; 2008; Paris. [DOI] [PMC free article] [PubMed] [Google Scholar]
- 9.Rathi Y, Michailovich O, Shenton ME, Bouix S. Directional functions for orientation distribution estimation. Med Image Anal. 2009;13(3):432–444. doi: 10.1016/j.media.2009.01.004. [DOI] [PMC free article] [PubMed] [Google Scholar]
- 10.Canales-Rodríguez EJ, Melie-García L, Iturria-Medina Y. Mathematical description of q-space in spherical coordinates: Exact q-ball imaging. Magnetic Resonance in Medicine. 2009;61(6):1350–1367. doi: 10.1002/mrm.21917. [DOI] [PubMed] [Google Scholar]
- 11.Tristán-Vega A, Westin CF, Aja-Fernández S. Estimation of fiber orientation probability density functions in high angular resolution diffusion imaging. NeuroImage. 2009;47(2):638–650. doi: 10.1016/j.neuroimage.2009.04.049. [DOI] [PubMed] [Google Scholar]
- 12.Khachaturian MH, Wisco JJ, Tuch DS. Boosting the sampling efficiency of q-ball imaging using multiple wavevector fusion. Magnetic Resonance in Medicine. 2007;57(2):289–296. doi: 10.1002/mrm.21090. [DOI] [PubMed] [Google Scholar]
- 13.Wu YC, Field AS, Alexander AL. Computation of diffusion function measures in q-space using magnetic resonance hybrid diffusion imaging. IEEE Transactions on Medical Imaging. 2008;27(6):858–865. doi: 10.1109/TMI.2008.922696. [DOI] [PMC free article] [PubMed] [Google Scholar]
- 14.Descoteaux M, Deriche R, Le Bihan D, Mangin JF, Poupon C. Diffusion Propagator Imaging: Using Laplace’s equation and multiple shell acquisitions to reconstruct the diffusion propagator. Proc. of 21st Intl. Conf. on IPMI; 2009; Williamsburg. [DOI] [PubMed] [Google Scholar]
- 15.Tournier JD, Calamante F, Gadian DG, Connelly A. Direct estimation of the fiber orientation density function from diffusion-weighted MRI data using spherical deconvolution. NeuroImage. 2004;23(3):1176–1185. doi: 10.1016/j.neuroimage.2004.07.037. [DOI] [PubMed] [Google Scholar]
- 16.Tournier JD, Calamante F, Connelly A. Robust determination of the fibre orientation distribution in diffusion MRI: Non-negativity constrained super-resolved spherical deconvolution. NeuroImage. 2007;35(4):1459–1472. doi: 10.1016/j.neuroimage.2007.02.016. [DOI] [PubMed] [Google Scholar]
- 17.Jian B, Vemuri BC. A unified computational framework for deconvolution to reconstruct multiple fibers from diffusion weighted MRI. IEEE Trans Med Imaging. 2007;26(11):1464–71. doi: 10.1109/TMI.2007.907552. [DOI] [PMC free article] [PubMed] [Google Scholar]
- 18.Jansons KM, Alexander DC. Persistent angular structure: new insights from diffusion magnetic resonance imaging data. Inverse Problems. 2003;19:1031–1046. [Google Scholar]
- 19.Özarslan E, Shepherd TM, Vemuri BC, Blackband SJ, Mareci TH. Resolution of complex tissue microarchitecture using the diffusion orientation transform (DOT) NeuroImage. 2006;31:1086–1103. doi: 10.1016/j.neuroimage.2006.01.024. [DOI] [PubMed] [Google Scholar]
- 20.Lenglet C, Campbell JSW, Descoteaux M, Haro G, Savadjiev P, Wassermann D, Anwander A, Deriche R, Pike GB, Sapiro G, et al. Mathematical methods for diffusion MRI processing. NeuroImage. 2009;45(1):S111–S122. doi: 10.1016/j.neuroimage.2008.10.054. [DOI] [PMC free article] [PubMed] [Google Scholar]
- 21.Seunarine KK, Alexander DC. Multiple fibers: Beyond the diffusion tensor. In: Johansen-Berg H, Behrens TEJ, editors. Diffusion MRI: From quantitative measurement to in vivo neuroanatomy. 1. Academic Press; 2009. [Google Scholar]
- 22.Aganj I, Lenglet C, Sapiro G. ODF reconstruction in q-ball imaging with solid angle consideration. Proc. of 6th IEEE ISBI; 2009; Boston. Also: IMA Preprint Series #2233. January 2009. [DOI] [PMC free article] [PubMed] [Google Scholar]
- 23.Aganj I, Lenglet C, Sapiro G, Yacoub E, Ugurbil K, Harel N. Multiple q-shell ODF reconstruction in q-ball imaging. Proc. 12th Intl. Conf. MICCAI; 2009; London. [DOI] [PMC free article] [PubMed] [Google Scholar]
- 24.Robinson EC, Valstar M, Hammers A, Ericsson A, Edwards AD, Rueckert D. Multivariate statistical analysis of whole brain structural networks obtained using probabilistic tractography. Proc. 11th Intl. Conf. MICCAI; 2008; New York City. pp. 486–493. [DOI] [PubMed] [Google Scholar]
- 25.Aganj I, Lenglet C, Keriven R, Sapiro G, Harel N, Thompson PM. A Hough transform global approach to diffusion MRI tractography. Proc. of 17th Annual Meeting of ISMRM; 2009; Honolulu. [Google Scholar]
- 26.Basser PJ, Mattiello J, LeBihan D. Estimation of the effective self-diffusion tensor from the NMR spin echo. J Magn Reson B. 1994;103(3):247–254. doi: 10.1006/jmrb.1994.1037. [DOI] [PubMed] [Google Scholar]
- 27.Stejskal EO, Tanner JE. Spin diffusion measurements: spin echoes in the presence of a time-dependent field gradient. Journal of Chemical Physics. 1965;42(1):288–292. [Google Scholar]
- 28.Assemlal HE, Tschumperle D, Brun L. Efficient and robust computation of PDF features from diffusion MR signal. Medical Image Analysis. 2009;13(5):715–729. doi: 10.1016/j.media.2009.06.004. [DOI] [PubMed] [Google Scholar]
- 29.Descoteaux M, Angelino E, Fitzgibbons S, Deriche R. Research report 5768. INRIA. 2005. A linear and regularized ODF estimation algorithm to recover multiple fibers in q-ball imaging. [Google Scholar]
- 30.Goh A, Lenglet C, Thompson P, Vidal R. Estimating orientation distribution functions with probability density constraints and spatial regularity. Proc. 12th Intl. Conf. MICCAI; 2009; London. [DOI] [PubMed] [Google Scholar]
- 31.Jones DK. Gaussian modeling of the diffusion signal. In: Johansen-Berg H, Behrens TEJ, editors. Diffusion MRI: From quantitative measurement to in vivo neuroanatomy. 1. Academic Press; 2009. [Google Scholar]
- 32.Ronen I, Kim KH, Garwood M, Ugurbil K, Kim DS. Conventional DTI vs. slow and fast diffusion tensors in cat visual cortex. Magnetic Resonance in Medicine. 2003;49(5):785–790. doi: 10.1002/mrm.10431. [DOI] [PubMed] [Google Scholar]
- 33.Aganj I, Lenglet C, Sapiro G, Yacoub E, Ugurbil K, Harel N. IMA Preprint Series #2267. Institute for Mathematics and its Applications; 2009. Reconstruction of the orientation distribution function in single and multiple shell q-ball imaging within constant solid angle. http://www.ima.umn.edu/preprints/jul2009/2267.pdf. [DOI] [PMC free article] [PubMed] [Google Scholar]
- 34.Branch MA, Coleman TF, Li Y. A subspace, interior, and conjugate gradient method for large-scale bound-constrained minimization problems. SIAM Journal on Scientific Computing. 1999;21(1):1–23. [Google Scholar]
- 35.Niendorf T, Dijkhuizen RM, Norris DG, Campagne ML, Nicolay K. Biexponential diffusion attenuation in various states of brain tissue: Implications for diffusion-weighted imaging. Magnetic Resonance in Medicine. 1996;36(6):847–857. doi: 10.1002/mrm.1910360607. [DOI] [PubMed] [Google Scholar]
- 36.Yeh CH, Cho KH, Lin HC, Wang JJ, Lin CP. Reduced encoding diffusion spectrum imaging implemented with a bi-Gaussian model. IEEE Transactions on Medical Imaging. 2008;27(10):1415–1424. doi: 10.1109/TMI.2008.922189. [DOI] [PubMed] [Google Scholar]
- 37.Jian B, Vemuri BC, Özarslan E, Carney PR, Mareci TH. A novel tensor distribution model for the diffusion-weighted MR signal. NeuroImage. 2007;37(1):164–176. doi: 10.1016/j.neuroimage.2007.03.074. [DOI] [PMC free article] [PubMed] [Google Scholar]
- 38.Hartigan JA, Hartigan PM. The dip test of unimodality. The Annals of Statistics. 1985;13(1):70–84. [Google Scholar]
- 39.Campbell JSW, Siddiqi K, Rymar VV, Sadikot AF, Pike GB. Flow-based fiber tracking with diffusion tensor and q-ball data: Validation and comparison to principal diffusion direction techniques. NeuroImage. 2005;27(4):725–736. doi: 10.1016/j.neuroimage.2005.05.014. [DOI] [PubMed] [Google Scholar]
- 40.Poupon C, Poupon F, Allirol L, Mangin JF. A database dedicated to anatomo-functional study of human brain connectivity. Proc. of the 12th Annual Meeting of OHBM; 2006. [Google Scholar]
- 41.Lenglet C, Yacoub E, Ghose G, Adriany G, Kruger G, Sapiro G, Ugurbil K, Harel N. High resolution diffusion MRI on in-vivo monkey brains at 7T. Proc. 14th Annual Meeting of OHBM; 2009; San Francisco. [Google Scholar]


