

Abstract
Biological macromolecules evolved to perform their function in specific cellular environment (subcellular compartments or tissues); therefore, they should be adapted to the biophysical characteristics of the corresponding environment, one of them being the characteristic pH. Many macromolecular properties are pH dependent, such as activity and stability. However, only activity is biologically important, while stability may not be crucial for the corresponding reaction. Here we show that the pH-optimum of activity (the pH of maximal activity) is correlated with the pH-optimum of stability (the pH of maximal stability) on a set of 310 proteins with available experimental data. We speculate that such a correlation is needed to allow the corresponding macromolecules to tolerate small pH fluctuations that are inevitable with cellular function. Our findings rationalize the efforts of correlating the pH of maximal stability and the characteristic pH of subcellular compartments, since only pH of activity is subject of evolutionary pressure. In addition, our analysis confirmed the previous observation that pH-optimum of activity and stability are not correlated with the isoelectric point, pI, or with the optimal temperature.
Keywords: pH-optimum, activity, stability, subcellular compartments, pH-dependent effects, BRENDA database
Introduction
Virtually every biological process is pH dependent reflecting the importance of the local pH on all processes in the cell. Thus, many biologically relevant effects are greatly influenced by the pH of the water phase including subcellular translocation 1, functional pH-dependence 2 and structural conformations associated with the function 3,4. The role of the concentration of hydrogen ions on protein stability is demonstrated by acidic/basic unfolding 5–8 and protein pH-dependent stability 9–14. Changes in pH are shown to trigger formation of amyloid fibers and aggregation 15–19. Protein-protein 20–22, protein-ligand 21,23,24, protein-membrane 25–28 and peptide-membrane 29 associations are greatly affected by the pH as well. pH is a significant factor for DNA-nanoparticles 30, DNA-metal ions 31,32 and DNA binding 33 interactions. It also plays an important role in pH-dependent drug optimization 34,35 and pH-dependent drug molecules aggregation 36. These examples demonstrate the crucial role of the pH of the water phase on the biological processes involving macromolecules and their assemblages.
Among the pH-dependent properties of macromolecules, two are of particular interest, the activity and the stability, because they reflect different sides of the same coin. From biological and evolutional perspective, the activity is important, while the stability may not be. However, in order to carry out their function, macromolecules should be stable in most cases. Therefore the pH-dependence of stability may be indirectly related to the pH-dependence of activity since structural integrity should evolve with the function.
The pH-dependence of activity and stability is typically a bell-shaped curve with a single or several maxima and the maximum (maxima) is termed pH-optimum. The pH-optimum serves as a convenient metric for pH-dependent properties of macromolecules which can be used to characterize macromolecular adaptation to cellular and subcellular pH. In a recent review 37, Garcia-Moreno summarizes the progress made in this area and outlines basic phenomena associated with subcellular adaptation, in particular, the role of subcellular pH. Among the most successful works is the study of Warwicker and coworkers 38 that benchmarked the pH of maximal stability of monomeric proteins against characteristic pH of the organelles and a very good correlation was obtained. Our earlier studies 39 explored the idea of the similarity of pH-optimum of proteins known to bind to each other, since in order to interact, two proteins must co-occur spatially and thus tolerate the same microenvironment. This idea was recently used by other researchers to match entries in two databases: the protein-protein interactions and subcellular location, and a substantial overlap was reported 40. Recently another study of Warwicker and coworkers demonstrated that there is a constraint pH-dependence of stability which is related to the local pH where the proteins function. 41
The adaptation of biomolecules to the subcellular environment was also studied using bioinformatics approaches. Some methods used only sequence information to predict protein location by means of either entire amino sequence composition 42 or just the N-terminus 43. Other methods introduced the concept of pseudo-amino acid composition as it was done by Chou and co-workers 44. Bioinformatics approaches, utilizing machine learning, were also applied to predict subcellular location by Chou and co-workers 45 and Rost and co-workers 46,47. Text-based approaches either alone 48,49 or integrated with amino acid sequence information 50 were reported as well. Other researchers used Bayesian networks 51, integrated-algorithm predictor utilizing Minimum Redundancy Maximum Relevance 52, support vector machine 53, and optimally weighted fuzzy k-NN algorithm 54. The list of approaches can be extended to include many other methods 55–58, but the common feature among them is that they are machine learning or text matching algorithms.
Despite the reported successes to predict subcellular localization of macromolecules applying either biophysical or machine learning methods, it is still unclear why they are successful, since neither approach uses functional characteristics to make the predictions. The adaptation or the evolutionary pressure toward a particular subcellular environment should affect the function, not the stability or other structural or amino acid sequence features of the corresponding protein. With the present study we address this issue and demonstrate, using only experimental data, the pH-optimum of activity is correlated with pH-optimum of stability. Thus, the structural and amino acid sequence features evolve towards a particular subcellular environment by following the adaptation of functional properties of the corresponding protein.
Methods
Benchmarking set
The benchmarking set was created using the BRENDA database (http://www.brenda-enzymes.org/)59,60. The goal was to extract proteins which had their pH of maximal activity and stability experimentally measured and, if possible, their subcellular location, optimal temperature, and molecular weight. The initial selection was done using the advanced search option of BRENDA. Under the “Search in text fields” field, the input was Localization, exact, and “*” was entered into the search field so that no data with a specified localization would be left out. In the “Search in numeric fields” field, we selected two inputs: pH optimum of activity and pH optimum of stability. The qualifier was chosen to be between. For pH stability, the entire range of pH (0.0–14.0) was given in order to include all results with the pH of optimum stability reported. The numeric field for pH optimum of activity was varied in windows 0.5 pH units wide (i.e. 0–0.5; etc.). This resulted in 4242 hits over the entire pH interval (0.0–14.0).
To assure the correctness of collected data we manually reviewed several cases and unfortunately we found that frequently the pH of maximal stability is extracted from publications that report only either the upper or lower pH at which the corresponding protein is still stable. A typical example is extracting the pH of maximal stability of 8.0 from a paper that states that the “protein was stable up to pH 8.0”. Definitely, such a pH is not optimal. Another typical case was found when BRENDA reports the pH of maximal stability using pH of maximal activity. These and other similar observations forced us to perform manual purging of the initial benchmarking set. It was done applying the manual strategy of reviewing the associated publications. To make our work feasible, only entries extracting data from the same references for at least two search fields were retained. Thus if at least two of the fields had an entry with a consistent reference then the publication was scanned manually. More often than not, the links to publications led to dead end due to the fact that the article is not available over an electronic source or that it was not available over the PubMed server. For all cases where all available entries returned “PubMed abstract not available” the hit was discarded. If a reference was not linked to an accessible paper, the data from those entries was discarded as well. This criteria was implemented in order to produce a data set that we were confident had the correct values. If there was any doubt that the value reported on the BRENDA database was extracted incorrectly, it was discarded. In essence, the BRENDA database served as a sorting mechanism to find the data that fit rigorous criteria. All abstracts and available publications were scanned manually for the data reported by the database.
Frequently the database would report multiple entries with contradictory results or rather with non-specific results. For such cases this data was discarded. This data was discarded because there was no justification found within the publication nor was the data specific. In many cases the data reported sometimes just reflected at what pH the experiment was done at. This is obviously not reliable data, and all such cases were removed.
In many cases we collected data that was relevant over a range. Sometimes there was a pH of optimum activity that was reported as a narrow range or a pH of optimum stability that was reported over wide but specific ranges. In these cases the data was recorded as it was reported. Often times for the stability of a protein, there is a plateau at a range of pH. In these cases there is no clear optimum, so the middle of the distribution was taken to be the pH of optimum stability. Sometimes the publications reported a very large range but in the graphs demonstrating the stability over a range of pH there was a clear peak. In any such cases, the peak was reported here as the pH of optimum stability.
In other cases, there were multiple peaks reported for the pH of optimum activity. The presence of multiple peaks was due to the different substrates used and the different reaction pathways that were studied. In these cases, if there were different values of pH for the forward and reverse reaction pathways, the pH reported for the forward reaction pathway was reported here. In the cases where there were multiple substrates for the proteins to bind with, we took the average of the pH of optimum activity.
The purging resulted in a benchmarking data set of experimentally determined pH of maximal activity and stability made of 380 proteins some of them accompanied with isolectric point, optimal temperature and molecular weight. Due to the purging procedure some of the entries do not have all properties. The entries that have both pH of optimal activity and stability are 310. This data set is large enough to ensure the statistical significance of the results. The table is provided in the supplementary materials.
Benchmarking strategies
(a) Average pH-optimum
Frequently our search resulted in finding an experimental paper reporting a pH-interval (from pHlow limit to pHupper limit) within which either the activity or stability was measured to be maximal. Since there is no preference of any pH within a specific pH interval, the midpoint of the interval was considered to be pH-optimum, as:
| (1) |
(b) Best fit pH-optimum
Using the average pH-optimum for activity and stability could result in quite unfair comparison, because the reported intervals are frequently of different width. To avoid such artifacts, we also performed analysis using the following protocol to obtain a so called best fit pH-optimum: The average pH-optimum of activity was benchmarked against the corresponding pH interval (if any) of maximal stability and if it falls within the pH interval of maximal stability, the best fit pH-optimum of stability was taken to be equal to the average pH-optimum of activity. If not, the pH-optimum of stability was taken to be the closest endpoint to the pH-optimum of activity, either pHlow limit or pHupper limit:
where “X” and “Y” stand for activity and stability, respectively.
(c) Best fit between pH-optimum intervals
Perhaps the fairest comparison between pH-optimum intervals of activity and stability is to consider a match of all cases for which the corresponding intervals overlap and for all other cases to take the smallest difference between the end points. Then the difference between pH-optima will be calculated as:
where 1,2 stand to low and upper limits, respectively.
Results
The main goal of our analysis is to investigate the correlation between the pH-optimum of activity and stability using only the available experimental data. However, collecting experimental data that undoubtedly reports both the pH-optimum of activity and stability is not an easy task, simply because most of the experiments were aimed at addressing questions different from the question of this work. Frequently the pH of maximal activity was determined in a study that performed the experiments at room temperature while the corresponding pH-optimal for the stability was found at elevated temperatures. Many other examples can be given, indicating how complicated the data analysis is, simply because the quantities studied in this work are very sensitive to the environmental conditions. In addition, as mentioned in the method section, most of the experimental papers report not a single pH value for either maximal activity or stability, but pH interval. Bearing in mind these observations, we will begin our analysis using averaged pH-optima.
(a) Distribution of the average pH-optimum of activity and stability
The distributions of the average pH-optimum of activity and stability are provided in supplementary materials. There is a tendency that the distribution of the average pH-optimum of activity is broader compared with the distribution of the average pH-optimum of stability. This reflects our observation that in most of cases when pH-optimum of activity is within very low pH range; typically the averaged pH-optimum of stability is several units higher. In opposite, in vast majority of the cases when the pH-optima of activity and stability are not the same and the average pH-optimum of activity is shifted toward high pH, typically the corresponding average pH-optimum of activity is lower. However, such cases are very few in our dataset and we are hesitant to generalize what could be the reason for such behavior. Obviously, much more experimental data is needed to rigorously address such a tendency, if it exists.
Another major difference is that the distribution of the average pH-optimum of stability is almost Gaussian with a mean at about pH=7, while the distribution of the average pH-optimum of activity shows several peaks (compare Figs. 1S and 2S, in supplementary materials). Perhaps, such difference indicates that activity is more sensitive to pH changes, while structural integrity can better sustain pH fluctuations. However, this observation should be taken with caution, since most of the reported pH intervals of maximal activity are much smaller than the corresponding pH intervals of maximal stability. This could result in smoother distribution for average pH-optimum of stability that of activity, because the averaging for the first one is typically done over broader pH interval.
(b) Correlation between average pH-optima of activity and stability
The average pH-optimum of activity is plotted against the average pH-optimum of stability using all data points in Table 1S (supplementary materials) and the result is shown in Fig. 1a. The resulting correlation coefficient, R, is about 0.54, indicating some kind of correlation, but a weak one. The slope of the fitting line is less than one, confirming the observation made above that the average pH-optimum of activity tends to be more spread out than the corresponding average pH-optimum of stability. There are significant numbers of overlapping points in Fig. 1a, and to better assess the similarity/dissimilarity of average pH-optima, we present in Fig. 1b the distribution of the difference between the corresponding average pH-optimum of activity and stability. If all of the average pH-optima of activity and stability were identical, we should see a single-peak distribution centered at zero. Indeed, the distribution peaks at zero; however, there are many cases for which the average pH-optimum of activity and stability differ by several pH units. Based on these observations, we could only state that there is a tendency that average pH-optima of activity and stability are similar to each other.
Fig. 1.

The average (averaged over the experimentally reported pH interval) pH-optimum of activity and the average pH-optimum of stability over 310 proteins (see Table 1 for details):
(a) The pH-optimum of activity plotted against pH-optimum of stability. The correlation coefficient and the parameters of the fitting line are provided within the plot.
(b) The distribution of the differences between the corresponding average pH-optima.
(c) Correlation between average pH-optimum and best fit pH-optimum
The analysis made using the average pH-optima is very stringent and may obscure existing correlations between these two quantities simply because of the averaging over pH intervals. Since any of the pHs within the pH interval could be the pH-optimum or simply because the activity or stability does not change within the corresponding pH interval, this second type of analysis was done by benchmarking average pH-optimum versus any pH within the corresponding pH interval (see method section for details). The results are shown in Figs.2a,b for the average pH-optimum of activity and the best fit pH-optimum of stability. It can be seen that the correlation is now much better, resulting in correlation coefficient R=0.83 and a slope of the fitting line of 0.77. There are still data points offset the main diagonal, but they are minority. A significant level of correlation between average pH-optimum and best fit pH-optimum is confirmed in Fig. 2b, where the distribution of the difference of these two quantities is provided. The distribution is almost delta-function shaped, with a very prominent peak at zero and very few cases representing the wings of the distribution. The results obtained with average pH-optimum of stability and best fit pH-optimum of activity are less impressive (Fig. 2c,d), simply because the pH intervals of optimal activity are much smaller compared with the pH intervals of optimal stability and therefore allowing for much less adjustment. The correlation coefficient is slightly better than the correlation coefficient obtained with both average pH-optima, but the improvement is minimal. Slight improvement is also seen for the distribution of the difference (Fig. 2d) between the average pH-optimum of stability and the best fit pH-optimum of activity (as compared with Fig. 1b).
Fig. 2.
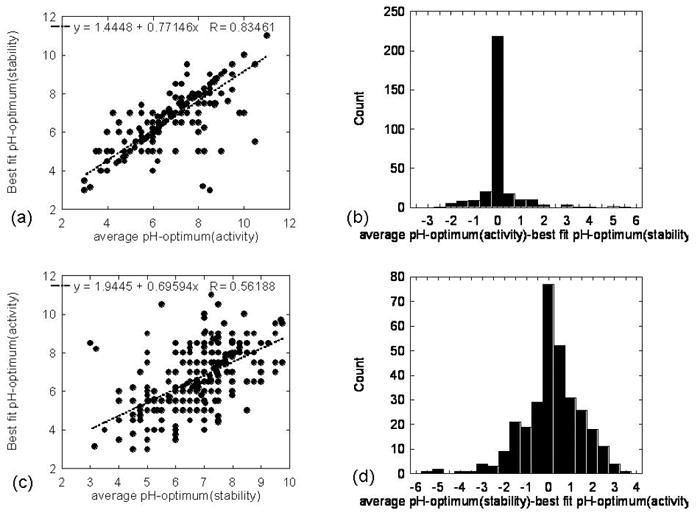
The average pH-optimum and the corresponding best fit pH-optimum.
(a) The best fit pH-optimum of stability plotted against the corresponding average pH-optimum of activity. Correlation coefficient and the parameters of the fitting line are provided within the graph.
(b) The distribution of the difference between the best fit pH-optimum of stability plotted against the corresponding average pH-optimum of activity.
(c) The best fit pH-optimum of activity plotted against the corresponding average pH-optimum of stability. Correlation coefficient and the parameters of the fitting line are provided within the graph.
(d) The distribution of the difference between the best fit pH-optimum of activity plotted against the corresponding average pH-optimum of stability.
(d) Correlation between intervals of pH-optimum of activity and stability
Perhaps the most reasonable analysis is to compare the reported experimental intervals of maximal activity and stability. For that purpose we adopted the procedure described in the method section, which however, does not result in specific pH-optimum value for neither activity not for stability. Because of this, it is impossible to obtain a graph with a correlation. However, the differences between the corresponding pH-optima intervals are obtainable and their distribution is shown in Fig. 3. The peak of the distribution is very prominent and centered at zero. The distribution is more like the delta-function as compared with Figs. 2b,2d and the wings of the distribution are smaller. Very few cases that correspond to dissimilar pH-optimum intervals of activity and stability were found (at cut-off of 1 pH, these cases are 9.3% of the entire set). The properties of the corresponding distribution are as follows: median=0.0, variance = 0.65, standard error = 0.05 calculated over 310 data points. There results strongly indicate that the pH-optimum of activity and stability are correlated.
Fig. 3.
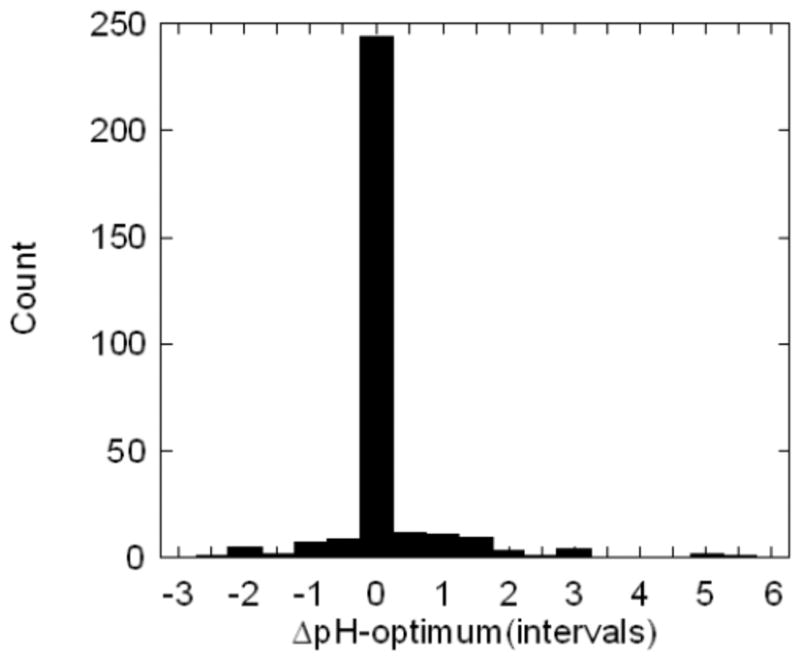
The distribution of ΔpH-optimum(intervals).
(e) Correlation between average pH-optima and other biophysical characteristics
In addition to the main goal of seeking for plausible correlation between pH-optimum of activity and stability, we also investigated for correlation between average pH-optima and isoelectric point (pI). However, no correlation between pH-optimum of activity or stability and the pI was found (see supplementary materials), confirming our previous observation 61. However, in this case, the observation is made using experimental data only, while in our previous work we based our conclusion on in silico modeling. Similarly, no correlation was found between pH-optimum of activity or stability and optimal temperature (see supplementary materials).
Our attempts to investigate the distribution of either pH-optima, of activity or stability, with respect to the subcellular localization failed. This is because the vast majority of the proteins in our dataset with available experimental data are extracellular proteins. Proteins from other cellular compartments are very scarce in our data set, and thus did not allow for the statistical study of the corresponding pH-optima, either as a distribution or to distinguish between cellular compartments.
Conclusion
The results clearly indicate that the pH-optimum of activity and stability are correlated. However, there will be cases, which we either failed to retrieve from BRENDA database or from the literature, which will suggest just the opposite. However, we infer that such cases will be minority and that there should be a particular reason, a specific requirement being regulatory or something else, that makes the pH-optima of activity and stability different.
Another important issue is to clarify that we are not inferring that proteins must be maximally stable to function. We are aware of many theoretical and experimental works redesigning proteins to enhance their stability. Our statement is that: given a protein with a natural (wild type) sequence and fold, the pH-optima of activity and stability most likely will be the same. This statement needs some clarification, although we were unable to perform detailed analysis, simply for the lack of experimental data. We expect this rule to hold in cases of natural conditions only. In other words, the pH-optimum of activity should be taken with respect to the natural substrate/ligand/reaction and the stability should be measured at natural conditions such as physiological salt concentration, temperature, and solvent. It can be expected that such a rule will be broken if the pH-dependence of the activity is measured against synthetic compounds, different from the natural substrate(s) or if the pH-dependence of the stability is measured under non-natural conditions such as very low/high temperatures or non aqueous solvent.
A plausible explanation of the observed tendency could stem from the necessity of biological macromolecules to carry out their function by tolerating small pH fluctuations. The subcellular pH is a result of many different reactions involving proton uptake/release, including proton pumps pumping protons across the corresponding membrane. The rest of the proteins in a particular subcellular compartment, not involved in proton transport, must be able to tolerate small or large pH fluctuations. In order to do so, their activity should be insensitive to pH fluctuations around the characteristic pH in this particular cellular compartment. Such a scenario could be achieved if the pH-optimum of activity is similar to the characteristic pH of the subcellular compartment, because the activity does not change much around pH-optimum, since the first derivative with respect to pH is zero. At the same time, keeping activity unchanged upon pH fluctuations will require the 3D structure of the corresponding protein to maintain its structural integrity. Perhaps, similar considerations as above, apply to the pH-dependence of stability and thus making pH-optima of activity and stability to correlate.
The findings reported in this work offer support for the efforts of correlating the pH-optimum of stability with the characteristic pH of subcellular compartments or tissues. Since the evolution is assumed to put pressure mostly on the function, the observation that the pH-optima of activity and stability are correlated paves the way for further investigations of the pH-dependent properties of proteins and the characteristic pH of the environment where they function.
Supplementary Material
Acknowledgments
The table with experimental data is available online from URL: www.ces.clemson.edu/compbio/pH-optimum.
References
- 1.Horiguchi M, Arita M, Kaempf-Rotzoll DE, Tsujimoto M, Inoue K, Arai H. pH-dependent translocation of alpha-tocopherol transfer protein (alpha-TTP) between hepatic cytosol and late endosomes. Genes Cells. 2003;8(10):789–800. doi: 10.1046/j.1365-2443.2003.00676.x. [DOI] [PubMed] [Google Scholar]
- 2.Srivastava J, Barreiro G, Groscurth S, Gingras AR, Goult BT, Critchley DR, Kelly MJ, Jacobson MP, Barber DL. Structural model and functional significance of pH-dependent talin-actin binding for focal adhesion remodeling. Proc Natl Acad Sci U S A. 2008;105(38):14436–14441. doi: 10.1073/pnas.0805163105. [DOI] [PMC free article] [PubMed] [Google Scholar]
- 3.Smedley JG, 3rd, Sharp JS, Kuhn JF, Tomer KB. Probing the pH-dependent prepore to pore transition of Bacillus anthracis protective antigen with differential oxidative protein footprinting. Biochemistry. 2008;47(40):10694–10704. doi: 10.1021/bi800533t. [DOI] [PMC free article] [PubMed] [Google Scholar]
- 4.Imamoto Y, Harigai M, Kataoka M. Direct observation of the pH-dependent equilibrium between L-like and M intermediates of photoactive yellow protein. FEBS Lett. 2004;577(1–2):75–80. doi: 10.1016/j.febslet.2004.09.065. [DOI] [PubMed] [Google Scholar]
- 5.Grey MJ, Tang Y, Alexov E, McKnight CJ, Raleigh DP, Palmer AG., 3rd Characterizing a partially folded intermediate of the villin headpiece domain under non-denaturing conditions: contribution of His41 to the pH-dependent stability of the N-terminal subdomain. J Mol Biol. 2006;355(5):1078–1094. doi: 10.1016/j.jmb.2005.11.001. [DOI] [PubMed] [Google Scholar]
- 6.Luisi DL, Snow CD, Lin JJ, Hendsch ZS, Tidor B, Raleigh DP. Surface salt bridges, double-mutant cycles, and protein stability: an experimental and computational analysis of the interaction of the Asp 23 side chain with the N-terminus of the N-terminal domain of the ribosomal protein l9. Biochemistry. 2003;42(23):7050–7060. doi: 10.1021/bi027202n. [DOI] [PubMed] [Google Scholar]
- 7.Mazzini A, Polverini E, Parisi M, Sorbi RT, Favilla R. Dissociation and unfolding of bovine odorant binding protein at acidic pH. J Struct Biol. 2007;159(1):82–91. doi: 10.1016/j.jsb.2007.02.007. [DOI] [PubMed] [Google Scholar]
- 8.Fuertes MA, Perez JM, Soto M, Menendez M, Alonso C. Thermodynamic stability of the C-terminal domain of the human inducible heat shock protein 70. Biochim Biophys Acta. 2004;1699(1–2):45–56. doi: 10.1016/j.bbapap.2003.12.007. [DOI] [PubMed] [Google Scholar]
- 9.Garcia-Mayoral MF, del Pozo AM, Campos-Olivas R, Gavilanes JG, Santoro J, Rico M, Laurents DV, Bruix M. pH-Dependent conformational stability of the ribotoxin alpha-sarcin and four active site charge substitution variants. Biochemistry. 2006;45(46):13705–13718. doi: 10.1021/bi061273v. [DOI] [PubMed] [Google Scholar]
- 10.Lindman S, Linse S, Mulder FA, Andre I. pK(a) values for side-chain carboxyl groups of a PGB1 variant explain salt and pH-dependent stability. Biophys J. 2007;92(1):257–266. doi: 10.1529/biophysj.106.088682. [DOI] [PMC free article] [PubMed] [Google Scholar]
- 11.Horng JC, Cho JH, Raleigh DP. Analysis of the pH-dependent folding and stability of histidine point mutants allows characterization of the denatured state and transition state for protein folding. J Mol Biol. 2005;345(1):163–173. doi: 10.1016/j.jmb.2004.10.023. [DOI] [PubMed] [Google Scholar]
- 12.Horng JC, Demarest SJ, Raleigh DP. pH-dependent stability of the human alpha-lactalbumin molten globule state: contrasting roles of the 6–120 disulfide and the beta-subdomain at low and neutral pH. Proteins. 2003;52(2):193–202. doi: 10.1002/prot.10406. [DOI] [PubMed] [Google Scholar]
- 13.Sato S, Raleigh DP. pH-dependent stability and folding kinetics of a protein with an unusual alpha-beta topology: the C-terminal domain of the ribosomal protein L9. J Mol Biol. 2002;318(2):571–582. doi: 10.1016/S0022-2836(02)00015-3. [DOI] [PubMed] [Google Scholar]
- 14.Luisi DL, Raleigh DP. pH-dependent interactions and the stability and folding kinetics of the N-terminal domain of L9. Electrostatic interactions are only weakly formed in the transition state for folding. J Mol Biol. 2000;299(4):1091–1100. doi: 10.1006/jmbi.2000.3752. [DOI] [PubMed] [Google Scholar]
- 15.Skoulakis S, Goodfellow JM. The pH-dependent stability of wild-type and mutant transthyretin oligomers. Biophys J. 2003;84(5):2795–2804. doi: 10.1016/S0006-3495(03)70009-5. [DOI] [PMC free article] [PubMed] [Google Scholar]
- 16.Perico N, Purtell J, Dillon TM, Ricci MS. Conformational implications of an inversed pH-dependent antibody aggregation. J Pharm Sci. 2008 doi: 10.1002/jps.21539. [DOI] [PubMed] [Google Scholar]
- 17.Pedersen S, Nesgaard L, Baptista RP, Melo EP, Kristensen SR, Otzen DE. pH-dependent aggregation of cutinase is efficiently suppressed by 1,8-ANS. Biopolymers. 2006;83(6):619–629. doi: 10.1002/bip.20598. [DOI] [PubMed] [Google Scholar]
- 18.Petkova AT, Buntkowsky G, Dyda F, Leapman RD, Yau WM, Tycko R. Solid state NMR reveals a pH-dependent antiparallel beta-sheet registry in fibrils formed by a beta-amyloid peptide. J Mol Biol. 2004;335(1):247–260. doi: 10.1016/j.jmb.2003.10.044. [DOI] [PubMed] [Google Scholar]
- 19.Srinivasan R, Jones EM, Liu K, Ghiso J, Marchant RE, Zagorski MG. pH-dependent amyloid and protofibril formation by the ABri peptide of familial British dementia. J Mol Biol. 2003;333(5):1003–1023. doi: 10.1016/j.jmb.2003.09.001. [DOI] [PubMed] [Google Scholar]
- 20.Schreiber G, Fersht AR. Interaction of barnase with its popypeptide inhibitor barstar studied by protein engineering. Biochemistry. 1993;32:5145–5150. doi: 10.1021/bi00070a025. [DOI] [PubMed] [Google Scholar]
- 21.Hom RA, Vora M, Regner M, Subach OM, Cho W, Verkhusha VV, Stahelin RV, Kutateladze TG. pH-dependent binding of the Epsin ENTH domain and the AP180 ANTH domain to PI(4,5)P2-containing bilayers. J Mol Biol. 2007;373(2):412–423. doi: 10.1016/j.jmb.2007.08.016. [DOI] [PMC free article] [PubMed] [Google Scholar]
- 22.Schreiber G, Fersht AR. Energetics of protein-protein interactions: analysis of the barnase-barstar interface by single mutations and double mutant cycles. J Mol Biol. 1995;248:478–486. doi: 10.1016/s0022-2836(95)80064-6. [DOI] [PubMed] [Google Scholar]
- 23.Olson LJ, Hindsgaul O, Dahms NM, Kim JJ. Structural insights into the mechanism of pH-dependent ligand binding and release by the cation-dependent mannose 6-phosphate receptor. J Biol Chem. 2008;283(15):10124–10134. doi: 10.1074/jbc.M708994200. [DOI] [PMC free article] [PubMed] [Google Scholar]
- 24.Chaves FA, Richards KA, Torelli A, Wedekind J, Sant AJ. Peptide-binding motifs for the I-Ad MHC class II molecule: alternate pH-dependent binding behavior. Biochemistry. 2006;45(20):6426–6433. doi: 10.1021/bi060194g. [DOI] [PubMed] [Google Scholar]
- 25.Re F, Sesana S, Barbiroli A, Bonomi F, Cazzaniga E, Lonati E, Bulbarelli A, Masserini M. Prion protein structure is affected by pH-dependent interaction with membranes: a study in a model system. FEBS Lett. 2008;582(2):215–220. doi: 10.1016/j.febslet.2007.12.003. [DOI] [PubMed] [Google Scholar]
- 26.Kawai C, Prado FM, Nunes GL, Di Mascio P, Carmona-Ribeiro AM, Nantes IL. pH-Dependent interaction of cytochrome c with mitochondrial mimetic membranes: the role of an array of positively charged amino acids. J Biol Chem. 2005;280(41):34709–34717. doi: 10.1074/jbc.M412532200. [DOI] [PubMed] [Google Scholar]
- 27.Yoo SH. pH-dependent interaction of chromogranin A with integral membrane proteins of secretory vesicle including 260-kDa protein reactive to inositol 1,4,5-triphosphate receptor antibody. J Biol Chem. 1994;269(16):12001–12006. [PubMed] [Google Scholar]
- 28.Muga A, Gonzalez-Manas JM, Lakey JH, Pattus F, Surewicz WK. pH-dependent stability and membrane interaction of the pore-forming domain of colicin A. J Biol Chem. 1993;268(3):1553–1557. [PubMed] [Google Scholar]
- 29.Kono K, Kimura S, Imanishi Y. pH-dependent interaction of amphiphilic polypeptide poly(Lys-Aib-Leu-Aib) with lipid bilayer membrane. Biochemistry. 1990;29(15):3631–3637. doi: 10.1021/bi00467a007. [DOI] [PubMed] [Google Scholar]
- 30.Seela F, Budow S. pH-dependent assembly of DNA-gold nanoparticles based on the i-motif. Nucleosides Nucleotides Nucleic Acids. 2007;26(6–7):755–759. doi: 10.1080/15257770701490803. [DOI] [PubMed] [Google Scholar]
- 31.Wood DO, Lee JS. Investigation of pH-dependent DNA-metal ion interactions by surface plasmon resonance. J Inorg Biochem. 2005;99(2):566–574. doi: 10.1016/j.jinorgbio.2004.11.003. [DOI] [PubMed] [Google Scholar]
- 32.Seela F, Chittepu P. Oligonucleotides containing 6-aza-2′-deoxyuridine: synthesis, nucleobase protection, pH-dependent duplex stability, and metal-DNA formation. J Org Chem. 2007;72(12):4358–4366. doi: 10.1021/jo0702903. [DOI] [PubMed] [Google Scholar]
- 33.Allemand JF, Bensimon D, Jullien L, Bensimon A, Croquette V. pH-dependent specific binding and combing of DNA. Biophys J. 1997;73(4):2064–2070. doi: 10.1016/S0006-3495(97)78236-5. [DOI] [PMC free article] [PubMed] [Google Scholar]
- 34.Cheng G, An F, Zou MJ, Sun J, Hao XH, He YX. Time- and pH-dependent colon-specific drug delivery for orally administered diclofenac sodium and 5-aminosalicylic acid. World J Gastroenterol. 2004;10(12):1769–1774. doi: 10.3748/wjg.v10.i12.1769. [DOI] [PMC free article] [PubMed] [Google Scholar]
- 35.Patel MM, Shah TJ, Amin AF, Shah NN. Design, Development and Optimization of a Novel Time and pH-Dependent Colon Targeted Drug Delivery System. Pharm Dev Technol. 2008:1–8. doi: 10.1080/10837450802409412. [DOI] [PubMed] [Google Scholar]
- 36.Frenkel YV, Clark AD, Jr, Das K, Wang YH, Lewi PJ, Janssen PA, Arnold E. Concentration and pH dependent aggregation of hydrophobic drug molecules and relevance to oral bioavailability. J Med Chem. 2005;48(6):1974–1983. doi: 10.1021/jm049439i. [DOI] [PubMed] [Google Scholar]
- 37.Garcia-Moreno B. Adaptations of proteins to cellular and subcellular pH. J Biol. 2009;8(11):98. doi: 10.1186/jbiol199. [DOI] [PMC free article] [PubMed] [Google Scholar]
- 38.Chan P, Lovric J, Warwicker J. Subcellular pH and predicted pH-dependent features of proteins. Proteomics. 2006;6(12):3494–3501. doi: 10.1002/pmic.200500534. [DOI] [PubMed] [Google Scholar]
- 39.Kundrotas PJ, Alexov E. Electrostatic properties of protein-protein complexes. Biophys J. 2006;91(5):1724–1736. doi: 10.1529/biophysj.106.086025. [DOI] [PMC free article] [PubMed] [Google Scholar]
- 40.Shin CJ, Wong S, Davis MJ, Ragan MA. Protein-protein interaction as a predictor of subcellular location. BMC Syst Biol. 2009;3:28. doi: 10.1186/1752-0509-3-28. [DOI] [PMC free article] [PubMed] [Google Scholar]
- 41.Chan P, Warwicker J. Evidence for the adaptation of protein pH-dependence to subcellular pH. BMC Biol. 2009;7:69. doi: 10.1186/1741-7007-7-69. [DOI] [PMC free article] [PubMed] [Google Scholar]
- 42.Cedano J, Aloy P, Perez-Pons J, Querol E. Relation Between Amino Acid Composition and Cellular Location of Proteins. J Mol Biol. 1997;266:594–600. doi: 10.1006/jmbi.1996.0804. [DOI] [PubMed] [Google Scholar]
- 43.Emanuelsson O, Nielsen H, Brunak S, Heijne G. Predicting Sucellular Localization of Proteins Based on their N-terminal Amino Acid Sequence. J Mol Biol. 2000;300:1005–1016. doi: 10.1006/jmbi.2000.3903. [DOI] [PubMed] [Google Scholar]
- 44.Chou KC. Prediction of protein cellular attributes using pseudo-amino acid composition. Proteins. 2001;43(3):246–255. doi: 10.1002/prot.1035. [DOI] [PubMed] [Google Scholar]
- 45.Chou KC. Using Functional Domain Composition and Support Vector Machines for Prediction of Protein Subcellular Location. J Biol Chem. 2002;277:45765–45769. doi: 10.1074/jbc.M204161200. [DOI] [PubMed] [Google Scholar]
- 46.Nair R, Rost B. LOCnet and LOCtarget: sub-cellular localization for structural genomics targets. Nucleic Acids Res. 2004;32(Web Server issue):W517–521. doi: 10.1093/nar/gkh441. [DOI] [PMC free article] [PubMed] [Google Scholar]
- 47.Nair R, Rost B. Mimicking cellular sorting improves prediction of subcellular localization. J Mol Biol. 2005;348(1):85–100. doi: 10.1016/j.jmb.2005.02.025. [DOI] [PubMed] [Google Scholar]
- 48.Brady S, Shatkay H. EpiLoc: a (working) text-based system for predicting protein subcellular location. Pac Symp Biocomput. 2008:604–615. [PubMed] [Google Scholar]
- 49.Stapley BJ, Kelley LA, Sternberg MJ. Predicting the sub-cellular location of proteins from text using support vector machines. Pac Symp Biocomput. 2002:374–385. doi: 10.1142/9789812799623_0035. [DOI] [PubMed] [Google Scholar]
- 50.Shatkay H, Hoglund A, Brady S, Blum T, Donnes P, Kohlbacher O. SherLoc: high-accuracy prediction of protein subcellular localization by integrating text and protein sequence data. Bioinformatics. 2007;23(11):1410–1417. doi: 10.1093/bioinformatics/btm115. [DOI] [PubMed] [Google Scholar]
- 51.Taylor PD, Attwood TK, Flower DR. Combining algorithms to predict bacterial protein sub-cellular location: Parallel versus concurrent implementations. Bioinformation. 2006;1(8):285–289. doi: 10.6026/97320630001285. [DOI] [PMC free article] [PubMed] [Google Scholar]
- 52.Cai YD, Lu L, Chen L, He JF. Predicting subcellular location of proteins using integrated-algorithm method. Mol Divers. 2009 doi: 10.1007/s11030-009-9182-4. [DOI] [PubMed] [Google Scholar]
- 53.Qiu JD, Luo SH, Huang JH, Sun XY, Liang RP. Predicting subcellular location of apoptosis proteins based on wavelet transform and support vector machine. Amino Acids. 2009 doi: 10.1007/s00726-009-0331-y. [DOI] [PubMed] [Google Scholar]
- 54.Nasibov E, Kandemir-Cavas C. Protein subcellular location prediction using optimally weighted fuzzy k-NN algorithm. Comput Biol Chem. 2008;32(6):448–451. doi: 10.1016/j.compbiolchem.2008.07.011. [DOI] [PubMed] [Google Scholar]
- 55.Kall L, Krogh A, Sonnhammer EL. Advantages of combined transmembrane topology and signal peptide prediction--the Phobius web server. Nucleic Acids Res. 2007;35(Web Server issue):W429–432. doi: 10.1093/nar/gkm256. [DOI] [PMC free article] [PubMed] [Google Scholar]
- 56.Chen Y, Yu P, Luo J, Jiang Y. Secreted protein prediction system combining CJ-SPHMM, TMHMM, and PSORT. Mamm Genome. 2003;14(12):859–865. doi: 10.1007/s00335-003-2296-6. [DOI] [PubMed] [Google Scholar]
- 57.Zhou M, Boekhorst J, Francke C, Siezen RJ. LocateP: genome-scale subcellular-location predictor for bacterial proteins. BMC Bioinformatics. 2008;9:173. doi: 10.1186/1471-2105-9-173. [DOI] [PMC free article] [PubMed] [Google Scholar]
- 58.Khan A, Majid A, Choi TS. Predicting protein subcellular location: exploiting amino acid based sequence of feature spaces and fusion of diverse classifiers. Amino Acids. 2009 doi: 10.1007/s00726-009-0238-7. [DOI] [PubMed] [Google Scholar]
- 59.Chang A, Scheer M, Grote A, Schomburg I, Schomburg D. BRENDA, AMENDA and FRENDA the enzyme information system: new content and tools in 2009. Nucleic Acids Res. 2009;37(Database issue):D588–592. doi: 10.1093/nar/gkn820. [DOI] [PMC free article] [PubMed] [Google Scholar]
- 60.Barthelmes J, Ebeling C, Chang A, Schomburg I, Schomburg D. BRENDA, AMENDA and FRENDA: the enzyme information system in 2007. Nucleic Acids Res. 2007;35(Database issue):D511–514. doi: 10.1093/nar/gkl972. [DOI] [PMC free article] [PubMed] [Google Scholar]
- 61.Alexov E. Numerical calculations of the pH of maximal protein stability. The effect of the sequence composition and 3D structure. Eur J Biochem. 2004;271:173–185. doi: 10.1046/j.1432-1033.2003.03917.x. [DOI] [PubMed] [Google Scholar]
Associated Data
This section collects any data citations, data availability statements, or supplementary materials included in this article.