Abstract
Obesity is one of several factors implicated in the genesis of diabetic nephropathy (DN). Obese, hypertensive, type 2 diabetic rats SHR/NDmcr-cp were given, for 12 weeks, either a normal, middle-carbohydrate/middle-fat diet (MC/MF group) or a high-carbohydrate/low-fat diet (HC/LF group). Daily caloric intake was the same in both groups. Nevertheless, the HC/LF group gained less weight. Despite equivalent degrees of hypertension, hyperglycemia, hyperlipidemia, hyperinsulinemia, and even a poorer glycemic control, the HC/LF group had less severe renal histological abnormalities and a reduced intrarenal advanced glycation and oxidative stress. Mediators of the renoprotection, specifically linked to obesity and body weight control, include a reduced renal inflammation and TGF-beta expression, together with an enhanced level of adiponectin. Altogether, these data identify a specific role of body weight control by a high-carbohydrate/low-fat diet in the progression of DN. Body weight control thus impacts on local intrarenal advanced glycation and oxidative stress through inflammation and adiponectin levels.
1. Introduction
The genesis of diabetic nephropathy (DN) in type 2 diabetes mellitus is clearly multifactorial, involving hypertension, hyperglycemia, hyperinsulinemia, and hyperlipidemia [1–6]. Recent studies have further highlighted the role of obesity in the renal damage observed not only in patients with obesity-related glomerulopathy but also in overweight subjects with type 2 diabetes [6–10].
In several previous studies, we have explored a diabetic rat model, that is, the spontaneously hypertensive/NIH-corpulent rat (SHR/NDmcr-cp), to unravel factors implicated in DN. This rat strain has the same hypertensive background as SHR but also a genetic mutation in the leptin receptor gene, which leads to hyperphagia with an attendant wide range of metabolic abnormalities, that is, high body weight, hyperglycemia, hyperlipidemia, and hyperinsulinemia. It develops proteinuria, and glomerular and tubulointerstitial damages, mimicking human diabetic nephropathy, for example, focal and segmental glomerular sclerosis, mesangial expansion, and tubulointerstitial fibrosis [11, 12].
Previously, we demonstrated that a low caloric diet reduced both metabolic and renal alterations independently of blood pressure, lipid, glucose, and insulin levels. The observation that a high-carbohydrate/low-fat diet reduces effectively body weight without calorie restriction [13, 14] led us to use a similar isocaloric diet in our rat model to better identify factors mediating the weight-related factors involved in the genesis of DN.
SHR/NDmcr-cp rats given a normal middle-carbohydrate/middle-fat diet (MC/MF group) were thus compared with similar rats fed a high-carbohydrate/low-fat diet (HC/LF group). To our expectation, the latter diet induced significant less weight gain without calorie restriction. Despite the equivalent degrees of hypertension, hyperglycemia, hyperlipidemia, hyperinsulinemia, and even a poorer glycemic control, the HC/LF group had a significantly lower proteinuria and less severe renal histological abnormalities. The mediators of the specific weight effect on the kidney appear to be an obesity-related inflammation, aggravated by a lowered anti-inflammatory adiponectin level, an increased oxidative stress and advanced glycation, and an enhanced TGF-beta expression, all of which might constitute promising therapeutic targets.
2. Materials and Methods
2.1. Animals
Animal experiments were performed in accordance with the guidelines of the Committee on Ethical Animal Care and Use of Tokai University.
Male spontaneously hypertensive/NIH-corpulent rats (SHR/NDmcr-cp) and male Wistar-Kyoto rats (WKY) were purchased from SLC (Shizuoka, Japan). They were housed in individual cages, in a temperature- and light-controlled environment in an accredited animal care. SHR/NDmcr-cp rats, aged 5 weeks, were randomly divided into two groups and given for 12 weeks either a normal diet (CE-2, CLEA Japan Inc., Tokyo, Japan) with tap water (MC/MF group, 10 rats), or a high carbohydrate/low fat diet (CE-2 with tap water containing 30% sucrose) (HC/LF group, 10 rats). Five WKY rats on a normal diet (CE-2) served as a control group (WKY group, 5 rats). All rats were allowed unlimited access to diet and water, and each rat's daily dietary intake was determined thrice weekly from the amount of actually consumed food and fluid. They were sacrificed at the age of 17 weeks.
2.2. Blood Pressure and Blood and Urine Biochemistry
Systolic blood pressure was determined in conscious rats by the tail-cuff method at the beginning of the study, 2 wk, 4 wk, and every 4 wk subsequently until euthanasia. Rats were housed in metabolic cages for overnight collection of urine, and blood samples were obtained at the same time intervals. Plasma triglycerides and urinary protein concentration were determined with an automatic analyzer (Hitachi Automatic Clinical Analyzer 7170, Hitachi Science Systems, Ibaraki, Japan). The following methods were used: plasma insulin by a commercially available kit (Morinaga Biochemistry Lab, Tokyo, Japan), HbA1c by the DCA2000 (Bayer Diagnostics, Pittsburgh, PA), plasma adiponectin by a commercially available ELISA kit (AdipoGen Inc., Seoul, Korea).
2.3. Semiquantitative Evaluation of Glomerulosclerosis and Interstitial fibrosis
The methods were previously described [11, 12]. Briefly, glomerulosclerosis was assessed in 4-μm thick sections fixed in methyl-Carnoy's solution and stained with PAS. Morphometry was performed in 50 glomeruli selected at random in each animal. Glomerular sclerosis was graded according to the damaged area expressed as a percentage of total glomerular area: (0, no lesions; 1+, 1% to 25%; 2+, 25% to 50%; 3+, 50% to 75%; 4+, 75% to 100%). Tubulointerstitial fibrosis was evaluated in 4-μm thick sections fixed in 10% neutral buffered formaldehyde and stained with Masson's trichrome. Interstitial trichrome-positive areas were counted using the capacity of software Image-Pro Plus (Planetron, Inc., Tokyo, Japan) in ten randomly obtained digital images of the renal cortex. Trichrome positive areas on glomeruli, Bowman's capsules or vessels were excluded.
2.4. Semiquantitative Analysis of Macrophage Infiltration
Mouse anti-rat macrophage/monocyte antibody (anti-ED-1, Serotec, Oxford, UK) was used to stain 4-μm thick renal sections fixed in 10% neutral buffered formaldehyde. ED -1-positive cells infiltrating the tubulointerstitium were counted in 10 randomly selected fields in the cortex (400× magnification).
2.5. Gene Expression Analysis
Real-time PCR was performed by a previously described method [12] relying on One Step RT-PCR Kit (Takara Bio Inc., Shiga, Japan), SYBR Green I reagent (Cambrex Bio Science, Rockland, Maine), and iCycler PCR system (Bio-Rad Laboratories, Hercules, CA), to evaluate the mRNA expression of transforming growth factor (TGF)-beta, connective tissue growth factor (CTGF), plasminogen activator inhibitor (PAI)-1, Nox2, p47phox, tumor necrosis factor (TNF)-alpha, intercellular adhesion molecule (ICAM)-1, vascular cell adhesion molecule (VCAM)-1, and glyceraldehyde-3-phosphate dehydrogenase (GAPDH). Primer sequences are listed in Table 1. GAPDH mRNA expression was used for normalization of these genes expressions. Data are presented as relative values to the MC/MF group.
Table 1.
Primers for real-time PCR.
| Gene | Forward primer (5′ to 3′) | Reverse primer (5′ to 3′) |
|---|---|---|
| TGF-beta | TGCGCCTGCAGAGATTCAAG | AGGTAACGCCAGGAATTGTTGCTA |
| CTGF | CACCCGGGTTACCAATGACAA | AGCCCGGTAGGTCTTCACACTG |
| PAI-1 | GCCCAGCATTCAGCCTTTG | AAGACTTTGCTGAGTGAAGGCGTAG |
| Nox2 | CGGGACTTCGGACCCATATTC | ATTCCTGTGATGCCAGCCAAC |
| 47phox | CCACGGGTATTGCTAGGATGAGA | AGACTAAGGCAGCGGGTAATCAGA |
| TNF-alpha | AACTCGAGTGACAAGCCCGTAG | GTACCACCAGTTGGTTGTCTTTGA |
| ICAM-1 | ACAAGTGCCGTGCCTTTAGCTC | GATCACGAAGCCCGCAATG |
| VCAM-1 | GGATGCCGGAGTATACGAGTGTG | CAATGGCGGGTATTACCAAGGA |
| GAPDH | GACAACTTTGGCATCGTGGA | ATGCAGGGATGATGTTCTGG |
2.6. Cell Culture
IRPTC was kindly provided by Dr. Julie Ingelfinger. IRPTC is a cell line originating from proximal tubular cells of male Wistar rats, immortalized by transformation with origin-defective SV 40 DNA [15]. IRPTCs were cultured in Dulbecco's Modified Eagle's Medium (DMEM) (Invitrogen, Carlsbad, CA), supplemented with 10% FBS.
2.7. TNF-Alpha Stimulation Assay In Vitro
IRPTCs were cultured in 96-well plates and grown to confluence. They were subsequently washed and incubated with serum-starved DMEM containing 0.01, 0.1, 1 ng/ml human TNF-alpha (SIGMA-ALDRICH, Inc., St. Lois, MO) for 4 hours (n = 8). Total RNA was isolated from IRPTCs with RNeasy mini kit according to the manufacturer's instructions.
2.8. Renal Pentosidine Content
The method has been previously described [11]. Briefly, a 20-μL aliquot of a renal tissue acid hydrolysate diluted by PBS was injected into a reverse-phase HPLC system and separated on a C18 reverse-phase column (Waters, Tokyo, Japan). Pentosidine was measured in its effluent monitored with a fluorescence detector (RF-10A; Shimadzu, Kyoto, Japan) at an excitation-emission wavelength of 335/385 nm. Synthetic pentosidine was used as a standard.
2.9. Statistical Analysis
Data are reported as the mean ± SEM. Statistical analysis was performed with SPSS for Windows version 15.0 (SPSS, Chicago, IL). For multiple comparisons, one-way analysis of variance (ANOVA) and Dunnett t test were performed. Comparisons between two groups were performed using an unpaired t test. The spearman correlation test was used for correlative evaluation. P < .05 was considered significant.
3. Results
3.1. Body Weight
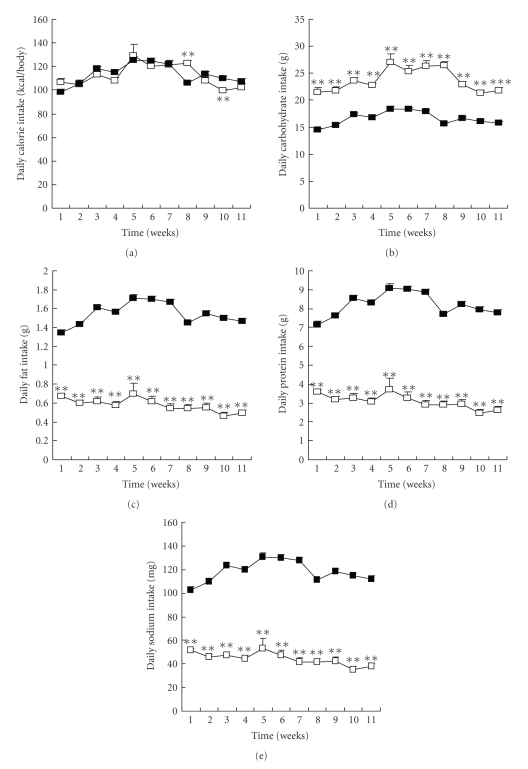
Daily caloric intake ranged from 100 to 120 kcal per animal and was virtually identical in both groups throughout the study (Figure 1(a)). Daily intake of carbohydrate, fat, protein, and sodium was around 16.7 g, 1.5 g, 7.0 g, and 100 mg/day, respectively, in the MC/MF group and 22.6 g, 0.5 g, 4.0 g, and 35 mg/day, respectively, in the HC/LF group (Figures 1(b)–1(e), P < .001).
Figure 1.
Daily diet intake. (a) Daily calorie intake, (b) carbohydrate intake, (c) fat intake, (d) protein intake, and (e) sodium intake in MC/MF (closed square) and HC/LF (open square). **P < .01, ***P < .001 versus MC/MF.
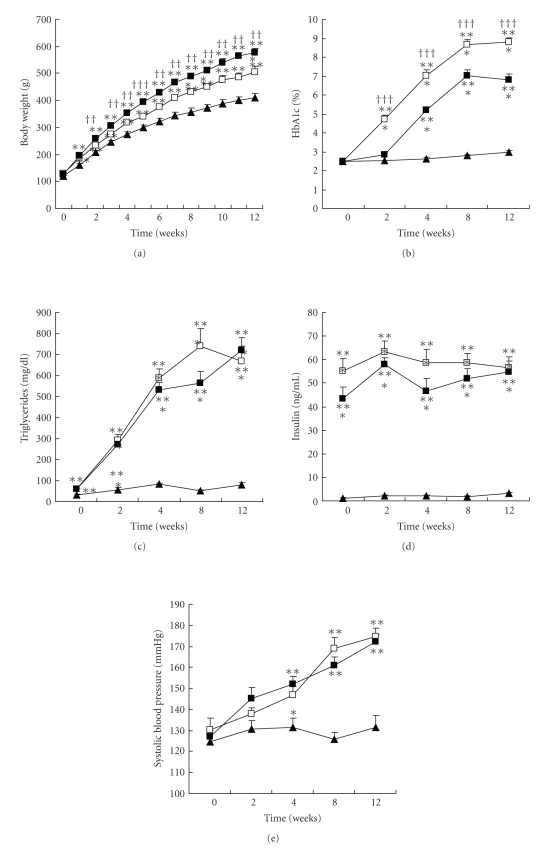
Despite a virtually identical caloric intake, the rats gained less weight in the HC/LF than in the MC/MF group (P < .01): 505 ± 21 versus 577 ± 16 g at the end of the study (Figure 2(a)).
Figure 2.
Metabolic abnormalities. (a) Body weight, (b) HbA1c, (c) triglycerides, (d) insulin, and (d) systolic blood pressure. WKY (closed triangle), MC/MF (closed square), and HC/LF (open square). *P < .05, **P < .01, ***P < .001 versus WKY; ††P < .01, †††P < .001 versus MC/MF.
3.2. Hypertension and Metabolic Abnormalities
Physical and biological data of experimental rats are summarized in Figure 2. Both groups of SHR/NDmcr-cp rats gradually developed a similar degree of hypertension, as a consequence of their SHR genetic background. Compared to control WKY rats, both the MC/MF and the HC/LF groups suffered a wide range of hyperphagia induced metabolic abnormalities, that is, high body weight, hyperglycemia (as evidenced by HbA1c levels), hyperinsulinemia, and hypertriglyceridemia.
Compared with the MC/MF group, the HC/LF group gained significantly less weight (P < .01), and had a significantly worse HbA1c level (P < .001). Other metabolic abnormalities, that is, hypertriglyceridemia and hyperinsulinemia, were equivalent between the two groups.
3.3. Renal Involvement
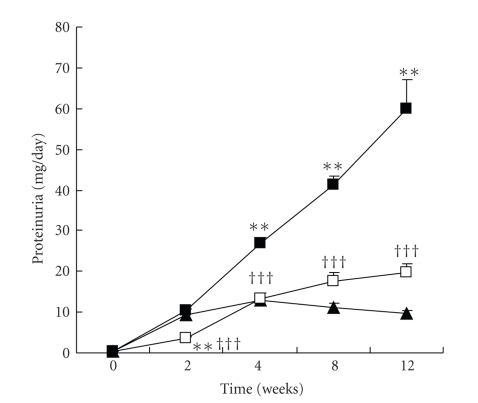
The progressive rise in proteinuria observed in the MC/MF group was markedly attenuated in the HC/LF group throughout the study (Figure 3). At the end of the study, proteinuria reached 59.8 ± 7.2 mg/day in the MC/MF group versus 19.6 ± 2.2 mg/day in the HC/LF group (P < .001), values to be compared to 9.8 ± 0.6 mg/day in the WKY rats (P < .001).
Figure 3.
Changes of proteinuria. WKY (closed triangle), MC/MF (closed square), and HC/LF (open square). **P < .01, ***P < .001 versus WKY; †††P < .001 versus MC/MF.
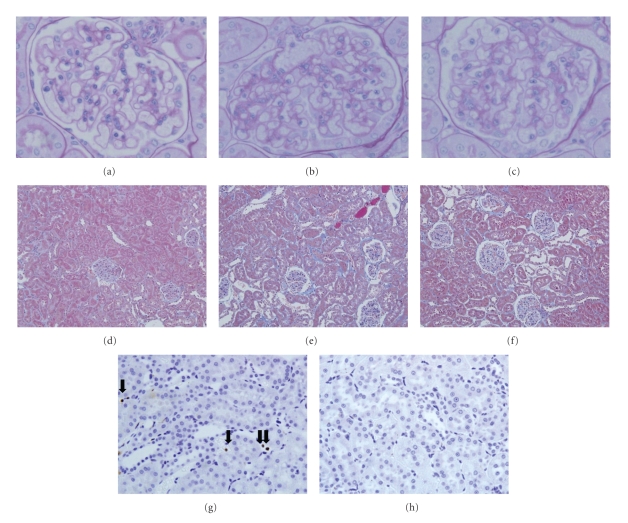
Representative periodic acid-Schiff- (PAS-) or Masson's trichrome-(MT-) stained renal pictures obtained at the end of the study in each animal group are shown in Figure 4. Glomerular sclerosis (Figures 4(a)–4(c)) and tubulointerstitial fibrosis (Figures 4(d)–4(f)) were visible in both groups but less in the HC/LF group than in the MC/MF group.
Figure 4.
Glomerular sclerosis, tubulointerstitial fibrosis, and macrophage infiltration. PAS-stained (a)–(c), Masson trichrome-stained (d)–(f), or ED-1-immunostained (g) and (h) renal tissues. WKY rats (a), (d), MC/MF (c), (f), (h), and HC/LF (b), (e), (g) at the end of study. Arrows indicate ED-1 positive cells. Original magnification 400× ((a)–(c), (g), (h)) and 200× (d)–(f).
On semiquantitative analysis (Table 2), glomerulosclerosis and interstitial fibrosis were significantly more severe in both experimental groups than in the WKY group (P < .001 and P < .05, resp.) but were milder in the HC/LF group than in the MC/MF group (P < .001 and P < .05, resp.).
Table 2.
Morphologic evaluation of glomerular sclerosis and tubulointerstitial fibrosis at the end of study.
| WKY | MC/MF | HC/LF | |
|---|---|---|---|
| Glomerular sclerosis score | 0.13 ± 0.02 | 0.63 ± 0.03*** | 0.43 ± 0.02∗∗∗††† |
| Tubulointerstitial fibrosis (%) | 1.8 ± 0.1 | 4.6 ± 0.3*** | 3.3 ± 0.4∗† |
*P < .05, ***P < .001 versus WKY; †P < .05, †††P < .001 versus MC/MF.
3.4. Molecular Biochemical Analyses
Obesity-related cytokines (e.g., adiponectin and TNF-alpha) levels, inflammation, transforming growth factor (TGF)-beta, oxidative stress, and advanced glycation were assessed to ascertain the biological mechanisms involved in the better renal outcome in the HC/LF group.
3.5. Inflammation and Obesity-Related Cytokines
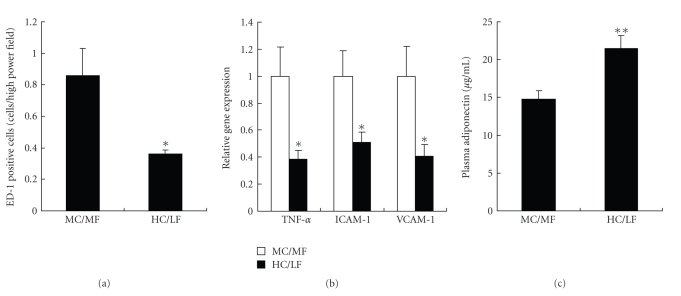
Inflammation has been associated with obesity [16]. Macrophage infiltration was milder in the HC/LF than in the MC/MF group (Figures 4(g) and 4(h)). On semiquantitative analysis, tubulointerstitial infiltration was significantly (P < .05) milder in the HC/LF group than in the MC/MF group (Figure 5(a)).
Figure 5.
Inflammation in renal tissues. (a) ED-1 positive cells in tubulointerstitial area, (b) gene expressions of TNF-alpha, ICAM-1, and VCAM-1, and (c) plasma adiponectin level in MC/MF (white bar) and HC/LF (black bar). *P < .05, **P < .01.
TNF-alpha mRNA expression in kidney tissues was significantly (P < .05) lower in the HC/LF than in the MC/LF group with a parallel decrease in the expression of intercellular adhesion molecule (ICAM)-1 and vascular cell adhesion molecule (VCAM)-1 (Figure 5(b)).
Adiponectin is an anti-inflammatory cytokine secreted by adipocytes [17, 18]. Its plasma level was significantly (P < .01) higher in the HC/LF than in the MC/MF group (Figure 5(c)). Interestingly, plasma adiponectin level, determined in all SHR/NDmcr-cp rats, was inversely correlated with body weight (r = 0.602, P < .01) and with proteinuria (r = 0.654, P < .01). Of note, body weight was also significantly correlated with proteinuria in all experimental rats (P < .001, r = 0.708).
3.6. TGF-Beta
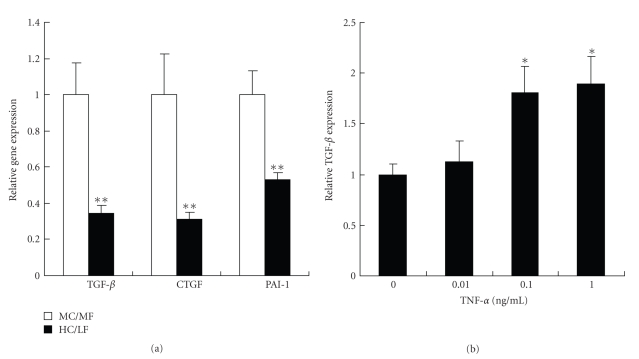
TGF-beta has been implicated in the development of diabetic renal injury [19, 20]. TGF-beta mRNA expression in kidney tissue was significantly (P < .01) lower in the HC/LF than in the MC/MF group, with a parallel decrease in the expression of TGF-beta-related genes, that is, connective tissue growth factor (CTGF) and plasminogen activator inhibitor (PAI)-1 (Figure 6(a)).
Figure 6.
TGF-beta in renal tissues and its induction in vitro by TNF-alpha. (a) Gene expressions of TGF-beta, CTGF, and PAI-1 in MC/MF (white bar) and HC/LF (black bar).*P < .05, **P < .01. (b) Effects of TNF-alpha on TGF-beta mRNA expressions in vitro in cultured rat proximal tubular cells (IRPTC). *P < .05, **P < .01.
The interrelation between TGF-beta and TNF-alpha expression was further tested in vitro in cultured rat proximal tubular cells (IRPTC) [15]. Incubation for 4 hours in a TNF-alpha fortified medium significantly (P < .05) increased mRNA expression of TGF-beta in a dose-dependent manner (Figure 6(b)). These data confirm previous conclusions [21, 22].
3.7. Advanced Glycation
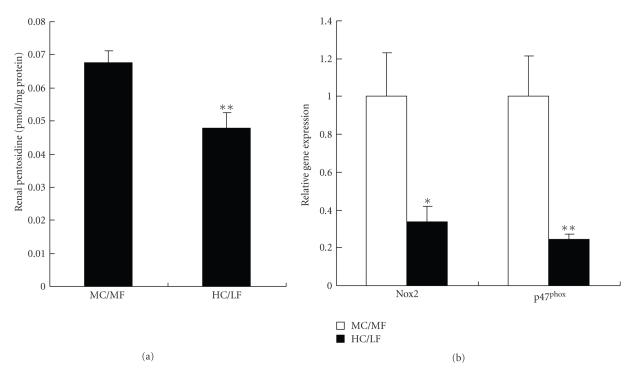
Advanced glycation and its protein modifications, that is, advanced glycation end products (AGEs), have been implicated in diabetic renal injury [23–25]. At the end of the study, renal pentosidine content, a surrogate marker of advanced glycation, was markedly (P < .01) lower in the LC/HF group than in the MC/MF group (Figure 7(a)).
Figure 7.
Advanced glycation and oxidative stress in renal tissues. (a) Renal pentosidine content, and (b) gene expressions of Nox2 and p47phox in MC/MF (white bar) and HC/LF (black bar).*P < .05, **P < .01.
3.8. Oxidative Stress
Oxidative stress, a mediator of diabetic renal injury, implicates NADPH oxidase, one of the major sources of cellular reactive oxygen species (ROS) [26]. The mRNA expressions of two subunits of NADPH oxidase, Nox2 and p47phox, measured in renal tissues, were significantly (P < .05, P < .01, resp.) lower in the HC/LF than in the MC/MF group (Figure 7(b)).
In all diabetic rats, renal Nox2 and 47phox mRNAs expression levels were significantly correlated with TNF-alpha (r = 0.450, P < .05; r = 0.727, P < .001, resp.), with TGF-beta (r = 0.764, P < .001; r = 0.699, P < .01, respectively), and with renal pentosidine content (r = 0.719, P < .001; r = 0.565, P < .01, resp.).
4. Discussion
The present study highlights body weight control as a marked contributor to the slowing of the progression of DN. It identifies inflammation, oxidative stress, advanced glycation, TGF-beta, and adiponectin as possible mediators of this effect.
Use of the same rat model in our several previous studies [11, 12, 27–29] has provided a detailed picture of the features involved in the renal disorder observed in SHR/NDmcr-cp given an ad libitum access to a standard diet. In the present study, the control group of rats on a middle-carbohydrate/middle-fat diet exhibits the same spectrum of abnormalities, that is, high body weight, hypertension, hyperglycemia with hyperinsulinemia, elevated lipids and TGF-beta expression together with proteinuria, glomerular and interstitial fibrosis with evidence of intrarenal advanced glycation and oxidative stress. Unraveling the sequence of events leading to DN in this model is of importance as it might offer a clue to a better prevention and treatment of the renal disease complicating the outcome of diabetic patients.
The present data demonstrate that body weight control by a high-carbohydrate/low-fat diet plays a role in the slowing of the development of DN, independently of calorie intake. In agreement with our findings, in human, a high-carbohydrate/low-fat diet reduces effectively body weight without calorie restriction [13, 14]. The mechanism for body weight control by a high-carbohydrate/low-fat diet still remains unknown. Its mitigation in the HC/LF group leads lower proteinuria and less severe renal lesions, despite an equivalent caloric intake and similar degrees of hypertension, hyperlipidemia, hyperinsulinemia, and an even poorer glycemic control. In a previous study, a similar effect of body weight control, achieved by a lower caloric intake in the same rat model, provided the same renoprotection, again independently of blood pressure, glucose, insulin and lipid levels [28]. The benefits of body weight control appear thus independent of the latter factors as well as of caloric intake. Of importance, renoprotection was achieved in both iso- and hypocaloric rat models together with a parallel reduction of intrarenal advanced glycation and oxidative stress, both of which clearly play a critical role in the development of DN.
The mediation of obesity's effects on DN remains to be identified. TGF-beta and its regulated products, CTGF and PAI-1, might be such agents as they have been previously implicated in DN [19, 20, 30–32]. In the same rat strain, we have previously adduced evidence that insulin raises TGF-beta expression and that this rise was associated with renal damage [12]. We now show that the lower body weight induced in the HC/LF group reduces TGF-beta expression, and attendant CTGF and PAI-1 expressions. Interestingly, TGF-beta expression fell despite unchanged insulin levels, suggesting that body weight control modified its expression independently of glucose and insulin levels.
Obesity triggers an inflammatory reaction which has been incriminated in the development of DN [16, 33–35]. Our data support this hypothesis. The kidneys of the MC/MF group reported in this as well as in previous studies [28] are infiltrated by macrophages. The lower body weight HC/LF rats are characterized by a decreased renal infiltration by macrophages and a parallel reduction in the mRNA expression of TNF-alpha and its related proteins, ICAM-1 and VCAM-1. Interestingly, we demonstrate, in cultured rat proximal tubular cells, that TNF-alpha and TGF-beta are interrelated: TNF-alpha per se upregulates TGF-beta mRNA, a previously reported observation [21, 22]. The correlation observed between both cytokine levels confirms this conclusion.
Adiponectin is an anti-inflammatory, anti-atherogenic, and anti-oxidative peptide downregulated in obese patients [18]. Its plasma level correlates inversely with proteinuria in diabetes [36, 37], a finding corroborated by the present study. Plasma adiponectin levels were higher in the HC/LF group which exhibited slower progression of DN, suggesting that body weight control augmented the adiponectin plasma level, its anti-inflammatory effect, and thus renoprotection. This hypothesis is supported by Ohashi et al.'s observation in adiponectin knockout mice with subtotal nephrectomy [38]: adiponectin deficiency exacerbated albuminuria and renal lesions together with an increased inflammation, TGF-beta levels, and oxidative stress.
The benefits of adiponectin in the prevention of DN are of major interest. We previously demonstrated in the same diabetic rat strain that pioglitazone, a class of thiazolidinediones (TZDs), protected the diabetic kidney by improving hyperinsulinemia and TGF-beta expression [12]. In this context, it is of note that TZDs upregulate plasma adiponectin level, raising the possibility of TZDs' renoprotection might be attributed, at least in part, to the specific induction of adiponectin [17, 37].
Both advanced glycation and oxidative stress are clearly implicated in DN [23–26]. Indeed several AGE inhibitors, for example, pyridoxamine, ALT-711, and LR-90, prevent the development of diabetic nephropathy [39–42], suggesting that accumulation of AGEs is an important risk factor for diabetic renal injury. Angiotensin II receptor blockers (ARBs) are also known to protect the diabetic kidney, at least in part, via inhibition of advanced glycation and oxidative stress, independently of body weight [11, 29]. The lowered renal pentosidine content observed in the HC/LF group confirms this contention. It is of special interest as it occurs despite higher plasma glucose levels than in the MC/MF control group and might thus reflect a lower oxidative stress. Advanced glycation and oxidative stress are indeed interrelated. Under diabetic conditions, AGEs, TGF-beta, and proinflammatory cytokines generate reactive oxygen species (ROS) via NADPH oxidase which, in turn, amplifies AGEs formation, TGF-beta expression, and inflammation [26, 43–45]. In the HC/LF group, both advanced glycation, assessed by the renal pentosidine content, and oxidative stress, evaluated by the renal mRNA expressions of two subunits of NADPH oxidase, Nox2 and p47phox, decreased significantly. In our model, in vivo changes in local oxidative stress and advanced glycation might eventually mediate the obesity-related effect on the diabetic kidney.
We cannot rule out that the underlying hypertension, diabetes, and obesity are not playing a role in this model. Furthermore, the intake of fat is implicated in the progression of renal damage via lipid accumulation, inflammation, and renal hemodynamics change [46, 47]. The beneficial changes observed in the HC/LF group could be attributed to the low fat content of diet, more than to changes in body weight. The sodium intake was also less in the HC/LF group. The local glomerular hemodynamics change might therefore occur, independently of systemic blood pressure [48]. Admittedly, the protein contents in diet also differ in our two experimental rat groups. Although this possibility cannot be formally ruled out, it appears unlikely as previous studies by others have shown in SHR rats that dietary protein content did not affect the development of proteinuria and renal lesions [49].
In conclusion, body weight control by a high-carbohydrate/low-fat diet slows the progression of diabetic nephropathy through the suppression of inflammation, sclerotic change, and oxidative stress. They identify adiponectin, TNF-alpha, TGF-beta, and AGEs as potential therapeutic targets for the prevention of the renal consequences of type 2 diabetes.
Conflict of Interest Statement
None declared.
Acknowledgment
This study was supported by a grant from the Program for Promotion of Fundamental Studies in Health Sciences of the Pharmaceuticals and Medical Devices Agency (PMDA) to TM.
References
- 1.Sarafidis PA, Ruilope LM. Insulin resistance, hyperinsulinemia, and renal injury: mechanisms and implications. American Journal of Nephrology. 2006;26(3):232–244. doi: 10.1159/000093632. [DOI] [PubMed] [Google Scholar]
- 2.Trovati M, Cavalot F. Optimization of hypolipidemic and antiplatelet treatment in the diabetic patient with renal diseas. Journal of the American Society of Nephrology. 2004;15(supplement 1):S12–S20. doi: 10.1097/01.asn.0000093238.09114.40. [DOI] [PubMed] [Google Scholar]
- 3.Sarafidis PA, Bakris GL. Protection of the kidney by thiazolidinediones: an assessment from bench to bedside. Kidney International. 2006;70(7):1223–1233. doi: 10.1038/sj.ki.5001620. [DOI] [PubMed] [Google Scholar]
- 4.Remuzzi G, Macia M, Ruggenenti P. Prevention and treatment of diabetic renal disease in type 2 diabetes: the BENEDICT study. Journal of the American Society of Nephrology. 2006;17(supplement 2):S90–S97. doi: 10.1681/ASN.2005121324. [DOI] [PubMed] [Google Scholar]
- 5.Fioretto P, Bruseghin M, Berto I, Gallina P, Manzato E, Mussap M. Renal protection in diabetes: role of glycemic control. Journal of the American Society of Nephrology. 2006;17(supplement 2):S86–S89. doi: 10.1681/ASN.2005121343. [DOI] [PubMed] [Google Scholar]
- 6.Locatelli F, Pozzoni P, Del Vecchio L. Renal manifestations in the metabolic syndrome. Journal of the American Society of Nephrology. 2006;17(supplement 2):S81–S85. doi: 10.1681/ASN.2005121332. [DOI] [PubMed] [Google Scholar]
- 7.Izzedine H, Coupaye M, Reach I, Deray G. Gastric bypass and resolution of proteinuria in an obese diabetic patient. Diabetic Medicine. 2005;22(12):1761–1762. doi: 10.1111/j.1464-5491.2005.01679.x. [DOI] [PubMed] [Google Scholar]
- 8.Saiki A, Nagayama D, Ohhira M, et al. Effect of weight loss using formula diet on renal function in obese patients with diabetic nephropathy. International Journal of Obesity. 2005;29(9):1115–1120. doi: 10.1038/sj.ijo.0803009. [DOI] [PubMed] [Google Scholar]
- 9.Morales E, Valero MA, León M, Hernández E, Praga M. Beneficial effects of weight loss in overweight patients with chronic proteinuric nephropathies. American Journal of Kidney Diseases. 2003;41(2):319–327. doi: 10.1053/ajkd.2003.50039. [DOI] [PubMed] [Google Scholar]
- 10.Praga M. Therapeutic measures in proteinuric nephropathy. Kidney International. Supplement. 2005;(99):S137–S141. doi: 10.1111/j.1523-1755.2005.09925.x. [DOI] [PubMed] [Google Scholar]
- 11.Nangaku M, Miyata T, Sada T, et al. Anti-hypertensive agents inhibit in vivo the formation of advanced glycation end products and improve renal damage in a type 2 diabetic nephropathy rat model. Journal of the American Society of Nephrology. 2003;14(5):1212–1222. doi: 10.1097/01.asn.0000062961.76776.c1. [DOI] [PubMed] [Google Scholar]
- 12.Ohtomo S, Izuhara Y, Takizawa S, et al. Thiazolidinediones provide better renoprotection than insulin in an obese, hypertensive type II diabetic rat model. Kidney International. 2007;72(12):1512–1519. doi: 10.1038/sj.ki.5002570. [DOI] [PubMed] [Google Scholar]
- 13.Poppitt SD, Keogh GF, Prentice AM, et al. Long-term effects of ad libitum low-fat, high-carbohydrate diets on body weight and serum lipids in overweight subjects with metabolic syndrome. American Journal of Clinical Nutrition. 2002;75(1):11–20. doi: 10.1093/ajcn/75.1.11. [DOI] [PubMed] [Google Scholar]
- 14.Bahadori B, Yazdani-Biuki B, Krippl P, Brath H, Uitz E, Wascher TC. Low-fat, high-carbohydrate (low-glycaemic index) diet induces weight loss and preserves lean body mass in obese healthy subjects: results of a 24-week study. Diabetes, Obesity and Metabolism. 2005;7(3):290–293. doi: 10.1111/j.1463-1326.2004.00445.x. [DOI] [PubMed] [Google Scholar]
- 15.Ingelfinger JR, Jung F, Diamant D, et al. Rat proximal tubule cell line transformed with origin-defective SV40 DNA: autocrine ANG II feedback. American Journal of Physiology. 1999;276(2):F218–F227. doi: 10.1152/ajprenal.1999.276.2.F218. [DOI] [PubMed] [Google Scholar]
- 16.Wisse BE. The inflammatory syndrome: the role of adipose tissue cytokines in metabolic disorders linked to obesity. Journal of the American Society of Nephrology. 2004;15(11):2792–2800. doi: 10.1097/01.ASN.0000141966.69934.21. [DOI] [PubMed] [Google Scholar]
- 17.Kadowaki T, Yamauchi T, Kubota N, Hara K, Ueki K, Tobe K. Adiponectin and adiponectin receptors in insulin resistance, diabetes, and the metabolic syndrome. Journal of Clinical Investigation. 2006;116(7):1784–1792. doi: 10.1172/JCI29126. [DOI] [PMC free article] [PubMed] [Google Scholar]
- 18.Wiecek A, Adamczak M, Chudek J. Adiponectin—an adipokine with unique metabolic properties. Nephrology Dialysis Transplantation. 2007;22(4):981–988. doi: 10.1093/ndt/gfl814. [DOI] [PubMed] [Google Scholar]
- 19.Schena FP, Gesualdo L. Pathogenetic mechanisms of diabetic nephropathy. Journal of the American Society of Nephrology. 2005;16(3, supplement 1):S30–S33. doi: 10.1681/asn.2004110970. [DOI] [PubMed] [Google Scholar]
- 20.Ziyadeh FN. Mediators of diabetic renal disease: the case for TGF-β as the major mediator. Journal of the American Society of Nephrology. 2004;15(supplement 1):S55–S57. doi: 10.1097/01.asn.0000093460.24823.5b. [DOI] [PubMed] [Google Scholar]
- 21.Pawluczyk IZA, Harris KPG. Cytokine interactions promote synergistic fibronectin accumulation by mesangial cells. Kidney International. 1998;54(1):62–70. doi: 10.1046/j.1523-1755.1998.00XXX.x. [DOI] [PubMed] [Google Scholar]
- 22.Phillips AO, Topley N, Steadman R, Morrisey K, Williams JD. Induction of TGF-β1 synthesis in D-glucose primed human proximal tubular cells by IL-1β and TNFα. Kidney International. 1996;50(5):1546–1554. doi: 10.1038/ki.1996.470. [DOI] [PubMed] [Google Scholar]
- 23.Horie K, Miyata T, Maeda K, et al. Immunohistochemical colocalization of glycoxidation products and lipid peroxidation products in diabetic renal glomerular lesions. Implication for glycoxidative stress in the pathogenesis of diabetic nephropathy. Journal of Clinical Investigation. 1997;100(12):2995–3004. doi: 10.1172/JCI119853. [DOI] [PMC free article] [PubMed] [Google Scholar]
- 24.Suzuki D, Miyata T, Saotome N, et al. Immunohistochemical evidence for an increased oxidative stress and carbonyl modification of proteins in diabetic glomerular lesions. Journal of the American Society of Nephrology. 1999;10(4):822–832. doi: 10.1681/ASN.V104822. [DOI] [PubMed] [Google Scholar]
- 25.Bohlender JM, Franke S, Stein G, Wolf G. Advanced glycation end products and the kidney. American Journal of Physiology. 2005;289(4):F645–F659. doi: 10.1152/ajprenal.00398.2004. [DOI] [PubMed] [Google Scholar]
- 26.Lee HB, Yu M-R, Yang Y, Jiang Z, Ha H. Reactive oxygen species-regulated signaling pathways in diabetic nephropathy. Journal of the American Society of Nephrology. 2003;14(supplement 3):S241–S245. doi: 10.1097/01.asn.0000077410.66390.0f. [DOI] [PubMed] [Google Scholar]
- 27.Ohtomo S, Nangaku M, Izuhara Y, Takizawa S, Strihou CVYD, Miyata T. Cobalt ameliorates renal injury in an obese, hypertensive type 2 diabetes rat model. Nephrology Dialysis Transplantation. 2008;23(4):1166–1172. doi: 10.1093/ndt/gfm715. [DOI] [PubMed] [Google Scholar]
- 28.Nangaku M, Izuhara Y, Usuda N, et al. In a type 2 diabetic nephropathy rat model, the improvement of obesity by a low calorie diet reduces oxidative/carbonyl stress and prevents diabetic nephropathy. Nephrology Dialysis Transplantation. 2005;20(12):2661–2669. doi: 10.1093/ndt/gfi096. [DOI] [PubMed] [Google Scholar]
- 29.Izuhara Y, Nangaku M, Inagi R, et al. Renoprotective properties of angiotensin receptor blockers beyond blood pressure lowering. Journal of the American Society of Nephrology. 2005;16(12):3631–3641. doi: 10.1681/ASN.2005050522. [DOI] [PubMed] [Google Scholar]
- 30.Yokoi H, Mukoyama M, Mori K, et al. Overexpression of connective tissue growth factor in podocytes worsens diabetic nephropathy in mice. Kidney International. 2008;73(4):446–455. doi: 10.1038/sj.ki.5002722. [DOI] [PubMed] [Google Scholar]
- 31.Guha M, Xu Z-G, Tung D, Lanting L, Natarajan R. Specific down-regulation of connective tissue growth factor attenuates progression of nephropathy in mouse models of type 1 and type 2 diabetes. The FASEB Journal. 2007;21(12):3355–3368. doi: 10.1096/fj.06-6713com. [DOI] [PubMed] [Google Scholar]
- 32.Lee HB, Ha H. Plasminogen activator inhibitor-1 and diabetic nephropathy. Nephrology. 2005;10(supplement 2):S11–S13. doi: 10.1111/j.1440-1797.2005.00449.x. [DOI] [PubMed] [Google Scholar]
- 33.Navarro JF, Milena FJ, Mora C, et al. Tumor necrosis factor-alpha gene expression in diabetic nephropathy: relationship with urinary albumin excretion and effect of angiotensin-converting enzyme inhibition. Kidney International. Supplement. 2005;(99):S98–S102. doi: 10.1111/j.1523-1755.2005.09918.x. [DOI] [PubMed] [Google Scholar]
- 34.Okada S, Shikata K, Matsuda M, et al. Intercellular adhesion molecule-1-deficient mice are resistant against renal injury after induction of diabetes. Diabetes. 2003;52(10):2586–2593. doi: 10.2337/diabetes.52.10.2586. [DOI] [PubMed] [Google Scholar]
- 35.Ina K, Kitamura H, Okeda T, et al. Vascular cell adhesion molecule-1 expression in the renal interstitium of diabetic KKAy mice. Diabetes Research and Clinical Practice. 1999;44(1):1–8. doi: 10.1016/s0168-8227(99)00011-x. [DOI] [PubMed] [Google Scholar]
- 36.Yenicesu M, Yilmaz MI, Caglar K, et al. Adiponectin level is reduced and inversely correlated with the degree of proteinuria in type 2 diabetic patients. Clinical Nephrology. 2005;64(1):12–19. doi: 10.5414/cnp64012. [DOI] [PubMed] [Google Scholar]
- 37.Yilmaz MI, Sonmez A, Caglar K, et al. Peroxisome proliferator-activated receptor γ (PPAR-γ) agonist increases plasma adiponectin levels in type 2 diabetic patients with proteinuria. Endocrine. 2004;25(3):207–214. doi: 10.1385/ENDO:25:3:207. [DOI] [PubMed] [Google Scholar]
- 38.Ohashi K, Iwatani H, Kihara S, et al. Exacerbation of albuminuria and renal fibrosis in subtotal renal ablation model of adiponectin-knockout mice. Arteriosclerosis, Thrombosis, and Vascular Biology. 2007;27(9):1910–1917. doi: 10.1161/ATVBAHA.107.147645. [DOI] [PubMed] [Google Scholar]
- 39.Figarola JL, Scott S, Loera S, et al. Lr-90 a new advanced glycation endproduct inhibitor prevents progression of diabetic nephropathy in streptozotocin-diabetic rats. Diabetologia. 2003;46(8):1140–1152. doi: 10.1007/s00125-003-1162-0. [DOI] [PubMed] [Google Scholar]
- 40.Degenhardt TP, Alderson NL, Arrington DD, et al. Pyridoxamine inhibits early renal disease and dyslipidemia in the streptozotocin-diabetic rat. Kidney International. 2002;61(3):939–950. doi: 10.1046/j.1523-1755.2002.00207.x. [DOI] [PubMed] [Google Scholar]
- 41.Thallas-Bonke V, Lindschau C, Rizkalla B, et al. Attenuation of extracellular matrix accumulation in diabetic nephropathy by the advanced glycation end product cross-link breaker ALT-711 via a protein kinase C-α—dependent pathway. Diabetes. 2004;53(11):2921–2930. doi: 10.2337/diabetes.53.11.2921. [DOI] [PubMed] [Google Scholar]
- 42.Kelly DJ, Gilbert RE, Cox AJ, Soulis T, Jerums G, Cooper ME. Aminoguanidine ameliorates overexpression of prosclerotic growth factors and collagen deposition in experimental diabetic nephropathy. Journal of the American Society of Nephrology. 2001;12(10):2098–2107. doi: 10.1681/ASN.V12102098. [DOI] [PubMed] [Google Scholar]
- 43.Ha H, Lee HB. Reactive oxygen species amplify glucose signalling in renal cells cultured under high glucose and in diabetic kidney. Nephrology. 2005;10(supplement 2):S7–S10. doi: 10.1111/j.1440-1797.2005.00448.x. [DOI] [PubMed] [Google Scholar]
- 44.Schleicher E, Friess U. Oxidative stress, AGE, and atherosclerosis. Kidney International. Supplement. 2007;(106):S17–26. doi: 10.1038/sj.ki.5002382. [DOI] [PubMed] [Google Scholar]
- 45.McCormick ML, Gavrila D, Weintraub NL. Role of oxidative stress in the pathogenesis of abdominal aortic aneurysms. Arteriosclerosis, Thrombosis, and Vascular Biology. 2007;27(3):461–469. doi: 10.1161/01.ATV.0000257552.94483.14. [DOI] [PubMed] [Google Scholar]
- 46.Jiang T, Wang XX, Scherzer P, et al. Farnesoid X receptor modulates renal lipid metabolism, fibrosis, and diabetic nephropathy. Diabetes. 2007;56(10):2485–2493. doi: 10.2337/db06-1642. [DOI] [PubMed] [Google Scholar]
- 47.Gröne H-J, Walli A, Gröne E, et al. Induction of glomerulosclerosis by dietary lipids. A functional and morphologic study in the rat. Laboratory Investigation. 1989;60(3):433–446. [PubMed] [Google Scholar]
- 48.Bosma RJ, Krikken JA, Homan van der Heide JJ, de Jong PE, Navis GJ. Obesity and renal hemodynamics. Contributions to Nephrology. 2006;151:184–202. doi: 10.1159/000095329. [DOI] [PubMed] [Google Scholar]
- 49.Feld LG, Noble B, Springate JE, Feldman MJ, Van Liew JB. Dietary protein restriction and renal injury in the spontaneously hypertensive rat. American Journal of Physiology. 1989;256(2):F224–F228. doi: 10.1152/ajprenal.1989.256.2.F224. [DOI] [PubMed] [Google Scholar]


