

Abstract
Purpose
To quantify the multi-institutional and multi-observer variability of target and organ-at-risk (OAR) delineation for breast-cancer radiotherapy (RT), and its dosimetric impacts, as the first step of a RTOG effort to establish a breast cancer atlas.
Methods and Materials
Nine radiation oncologists specializing in breast RT from eight institutions independently delineated targets (e.g., lumpectomy cavity, boost planning target volume, breast, supraclavicular, axillary and internal mammary nodes, and chest wall) and OARs (e.g., heart, lung) on the same CT images of three representative patients with breast cancer. Inter-observer differences in structure delineation were quantified with regard to volume, distance between centers of mass, percent overlap, and average surface distance. The mean, median and standard deviation for these quantities were calculated for all possible combinations. To asses the impact of these variations on treatment planning, representative dosimetric plans based on observer-specific contours were generated.
Results
The variability in contouring the targets and OARs between the institutions/observers was substantial. The structure overlaps were as low as 10% and the volume variations had standard deviations up to 60%. The large variability was related both to differences in opinion regarding target and OAR boundaries as well as approach to incorporation of setup uncertainty and dosimetric limitations in target delineation. These inter-observer differences result in substantial variations in dosimetric planning for breast RT.
Conclusions
The differences in target and OAR delineation for breast irradiation between institutions/observers appear to be clinically and dosimetrically significant. A systematic consensus is highly desirable, particularly in the era of IMRT/IGRT.
Keywords: breast radiotherapy, breast treatment planning, breast delineation, breast cancer
Introduction
Conservative surgery with radiation therapy (RT) has been established as an alternative to mastectomy for the management of early stage breast cancer. It is generally considered to be desirable to deliver a relatively uniform dose distribution inside the breast volume with minimal hot spot regions, as it has been shown that excessive hot spots in the patient results in poorer cosmetic outcome (1-5). A major challenge to improving dose uniformity is the irregular shape and size of the breast. In addition, it is necessary to adequately spare the organs at risk (OAR), e.g., lung and heart, in order to minimize risk of treatment related complications (6-8). In recent years, conformal RT, particularly, intensity modulated RT (IMRT), is becoming popular for breast irradiation as it offers reduced hot spots and/or increased normal tissue sparing (9-17). Moreover, recently available image-guided RT (IGRT) can significantly improve accuracy of conformal treatment delivery (18-20).
Accurate delineation of volumes of the targets and OARs is prerequisite and critical for conformal RT, as all subsequent decisions on treatment planning and delivery are based on these volumes. A few previous studies have reported that there are significant variations in defining target volumes for breast RT (21-27). For example, Hurkmans et al (22) observed, in a single institutional study, that the clinical target volume (the breast volume) delineated based on CT by multiple observers varied by 17.5%. In another single institutional study, Struikmans et al (26) showed that two volumes delineated by different observers overlapped on an average of 87% or 56% for breast or boost volumes, respectively. Recently, Landis et al (21) reported large variations in delineating the lumpectomy cavity among four academic radiation oncologists who specialize in breast RT. It has been shown in some of these studies that detailed delineation instruction and/or training can improve delineation consistency (22-24,26). Dijkema et al reported that the anatomically based guidelines they developed were useful for delineation of regional nodes for conformal local-regional irradiation of breast (28).
Inconsistencies in delineating target and OAR volumes, which have also been identified for several other tumor sites, e.g., prostate, lung, and brain (29-36), present a significant problem that can hinder the use of conformal RT and other advanced technology (e.g., IMRT, IGRT) to improve treatment outcomes. To reduce these inconsistencies, the Radiation Therapy Oncology Group (RTOG) is conducting an effort to establish a breast cancer atlas for RT. This work, as the first step of this RTOG effort, aims to systematically quantify the multi-institutional and multi-observer variability of target and OAR delineation for breast RT, and its dosimetric impact. The targets considered include lumpectomy cavity, breast, chest wall, and nodal regions, and the OARs include lung and heart.
Methods and Materials
Structure delineation
Nine radiation oncologists (Observers #1-9) specializing in breast RT from eight institutions independently delineated targets and OARs on the same CT images of the following three representative cases of breast cancer patients:
Case A
A patient with stage I (T1c, N0, M0), left breast cancer, who had undergone lumpectomy and sentinel node biopsy, now planned for breast irradiation. Six metal clips were placed at the lumpectomy site. Various radio-opaque external markers including 4 wire markers for the cephalad, caudad, medial, and lateral extent of anticipated tangent beams, a wire extending around inframammary fold, and a wire over lumpectomy scar, are evident from the CT images. The targets and OARs to be delineated include the lumpectomy cavity, the boost PTV (i.e., lumpectomy cavity plus margin), the breast volume, the heart, and the left lung.
Case B
A patient with stage IIIB (T-3, N-3, M-0), tumor size 7 cm, 11/15 nodes positive, left breast cancer who had undergone mastectomy and axillary node dissection, planned for chest wall and nodal irradiation. Various external markers, including wire markers for caudad, medial and lateral extent of anticipated tangent beams, a marker at anterior-posterior (AP) set-up point at anticipated matchline with the anticipated supraclavicular field, and a wire over the mastectomy scar, are shown on the CT images. The structures to be delineated are the supraclavicular, axillary and internal mammary nodes, the chest wall and the boost PTV (boost chest wall volume), the heart, and the left lung.
Case C
A patient with stage IIIA (T2, N2, M0), tumor size 3 cm, 4/18 nodes positive, right breast cancer who had undergone lumpectomy and axillary node dissection, planned for breast and nodal irradiation. Six clips were left at the lumpectomy site. CT images were acquired with various external markers including wire markers for caudad, medial and lateral extent of the anticipated tangential beams, a marker at AP set-up point at anticipated matchline with the anticipated supraclavicular field, a wire extending around inframammary fold, and a wire over lumpectomy scar. The structures to be delineated are the supraclavicular, axillary apex and internal mammary nodes, the lumpectomy cavity, boost PTV (i.e., lumpectomy cavity plus margin), the breast volume, and the right lung.
The participants were instructed to delineate the required structures using their own segmenting tools with a window/level setting of 600/40 for soft tissue during the contouring. Since the main purpose of this work, as the first step of generating an atlas for breast RT, is to quantify multi-institutional and multi-observer variability in routine clinical use, no specific instructions were provided to the investigators as to how to delineate the targets of interest and the OAR. The variability obtained would represent the worst case scenario, because the use of a delineation guideline would improve delineation consistency, as shown from previous studies (22-24,26). Except for the lung, all structures were delineated manually.
Quantification of variability
All delineated structures (a total of 144) were input into an image registration software tool (37) for analysis. The volume and the center of mass (COM) for each structure were computed using the software. To quantify the differences between the contours drawn by different observers, two additional quantities, percent overlap (PO), and average surface distance (ASD), were introduced. For two given contours V1 and V2, the percent overlap is defined as:
where V1 ∩ V2 is the volume of the intersection, and V1 ∪ V2 is the volume of the union. The average surface distance is calculated as:
where, A and B denote two sets of points of the surface of the two the contours (V1 and V2), d(a,b) is the Euclidean distance between two points.
To quantify the inter-observer variations in the delineation, volume difference, distance between COMs (DCOM), PO and ASD were calculated for two sets of contours for each possible combination of the nine sets of contours drawn by the nine observers for the same structure. The mean, median and standard deviation (SD) for these quantities calculated for all possible combinations for a given structure are reported.
Dosimetry planning
To assess the impact of the variation in delineation on dosimetric treatment planning, nine 3D dosimetric plans based on the nine sets of observer-specific contours for each case were generated using a commercial planning system (CMS, St. Louis, MO) by an experienced dosimetrist. The planning goals, aiming to cover the targets (e.g., the boost PTV, the breast, and nodal regions) as drawn, for the three representative cases were: (1) Case A: 45 Gy to 95% of breast volume, 60 Gy to 95% of the boost PTV with less than 5% of dose heterogeneity, 60 and 54 Gy to less than 30 and 50% of breast volume, respectively, 20 and 5 Gy to less than 10 and 20% of ipsilateral lung, respectively, and 22.5 Gy to less than 5% of heart, (2) Case B: 45 Gy to 95% of chest wall, 60 Gy to the boost PTV with less than 10% of dose heterogeneity, 48 Gy to 95% of supraclavicular nodal volume, 45 Gy to 95% of both axillary and internal mammary nodes, 20 Gy to less than 25% of ipsilateral lung, and 25 Gy to less than 9% of heart, and (3) Case C: 50 Gy to 95% of the breast volume with less than 5% of dose heterogeneity, 60 Gy to 95% of the boost PTV, 50 Gy to 95% of supraclavicular nodal volume, 45 Gy to 95% of both axillary and internal mammary nodes, and 20 and 5 Gy to less than 10 and 20% of ipsilateral lung, respectively. For each set of contours, the dosimetric plans were generated by properly adjusting the beam apertures, angles, weights, energies, and wedges, via forward planning, so that the planning goals on target coverage and OAR sparing can be reached as close as possible. Beam apertures were selected to fully cover the targets for each set of contours. Photon beams of 6 and/or 15 MV were used to irradiate breasts, chest wall and boost PTVs tangentially, supraclavicular and axillary nodes anteriorly and posteriorly. A combination of 6 MV photon and electron beams was used for internal mammary nodes.
Results
Variability
A comparison of contours drawn by different institutions/observers for selected targets and OARs are presented in Figures 1, 2 and 3 for Cases A, B and C, respectively. The contours of lumpectomy cavity, the boost PTV, the breast volume, and the heart for Case A projected in an axial and a coronal images are shown in Fig. 1. In Fig. 2, the contours of the internal mammary nodes, the chest wall, the boost PTV and the heart in an axial plane and the contours of the supraclavicular and axillary nodes, the chest wall and the boost PTV, and the heart in a coronal plane are presented for Case B. Fig. 3 shows the contours of the internal mammary nodes, the lumpectomy cavity, boost PTV, and the breast volume in an axial plane and those of the supraclavicular and axillary nodes, the lumpectomy cavity, boost PTV and the breast volume are shown in a coronal plane for Case C.
Figure 1.
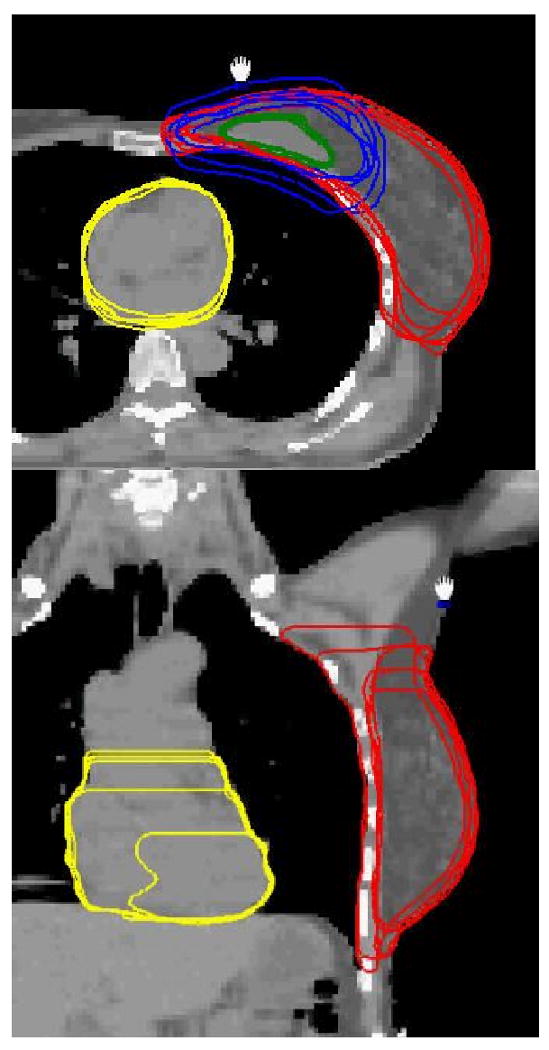
The projection contours of lumpectomy cavity, boost PTV, breast volume, and heart in an axial image (top) and those of breast and heart in a coronal plane (bottom) for Case A.
Figure 2.
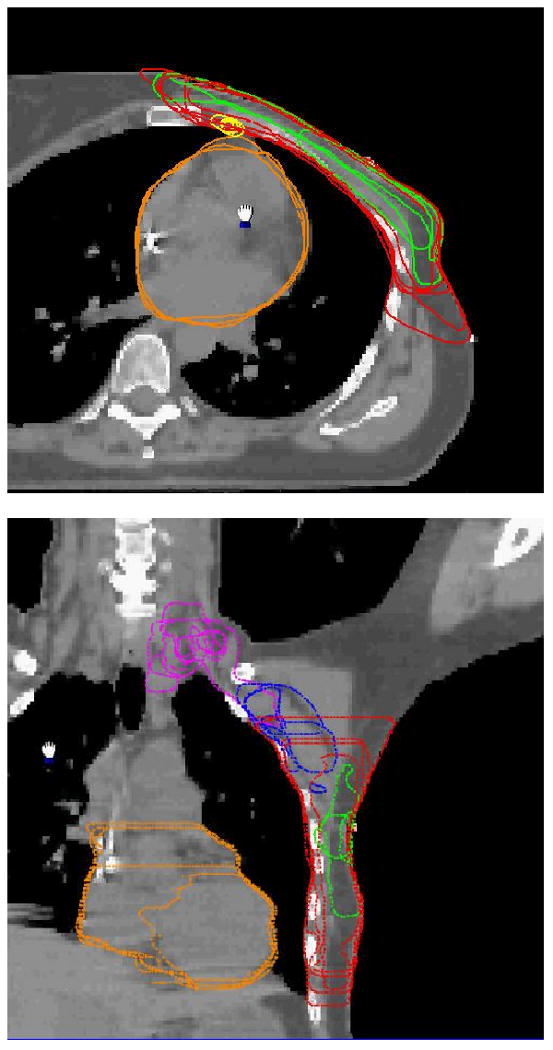
The contours of the internal mammary nodes, the chest wall, the boost PTV and the heart in an axial image (top) and the contours of the supraclavicular and axillary nodes, the chest wall and the boost PTV, and the heart in a coronal image (bottom) for Case B.
Figure 3.
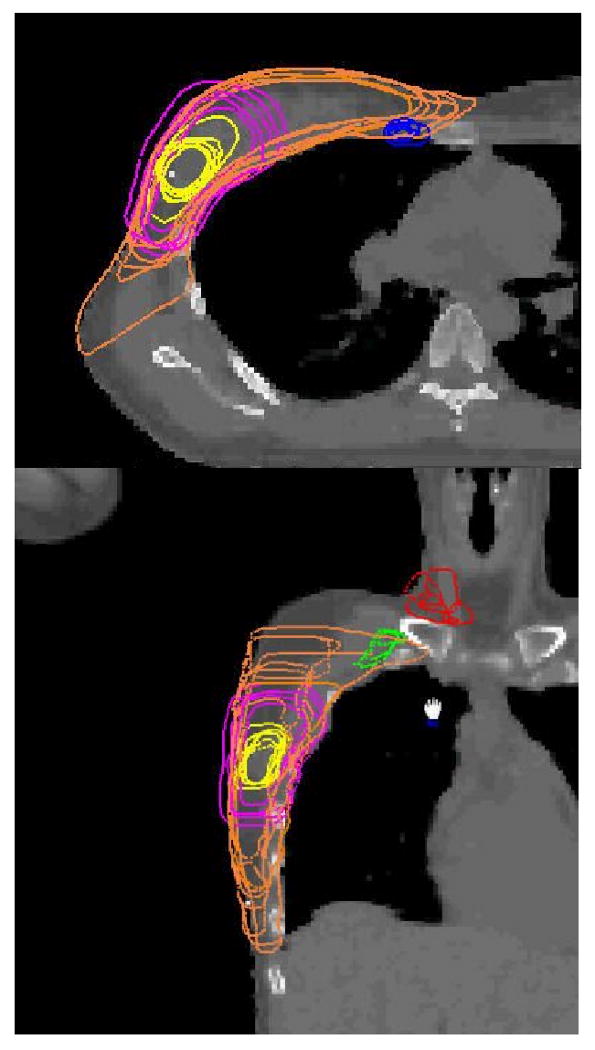
The contours of the internal mammary nodes, the lumpectomy cavity, boost PTV, and the breast volume in an axial plane (top) and those of the supraclavicular and axillary nodes, the lumpectomy cavity, boost PTV and the breast volume in a coronal plane (bottom) for Case C.
The variations between observers presented in Figs. 1-3 can be quantified using the quantities of volume, DCOM, PO and ASD. The minimum, maximum, median, mean and SD of these quantities for selected structures delineated are tabulated in Tables 1, 2 and 3 for Cases A, B and C, respectively. The variation for automatically delineated lung volumes was found to be negligible. Therefore, the data for the lung are not included in Figs. 1-3 and Tables 1-3.
Table 1.
Variations between the institutions/observers in delineating the targets and normal structures for Case A. The minimum, median, maximum, mean, the standard deviation (SD) and the SD divided by the mean for volume, distance of center of mass (DCOM), percent overlap (PO), and average surface distance (ASD) of each structure are presented.
| Targets or normal structures | quantity | Min | Median | Max | Mean | SD | SD/Mean |
|---|---|---|---|---|---|---|---|
| Lumpectomy cavity | volume (cm3) | 29.4 | 32.3 | 45.1 | 33.5 | 5.1 | 15.1% |
| DCOM (cm) | 0.03 | 0.14 | 0.39 | 0.16 | 0.1 | 53.5% | |
| PO (%) | 64.3 | 86.9 | 98.7 | 86.0 | 8.6 | 10.0% | |
| ASD (cm) | 0.09 | 0.13 | 0.26 | 0.14 | 0.04 | 30.5% | |
| Boost PTV | volume (cm3) | 102.8 | 155.0 | 354.2 | 198.2 | 94.9 | 47.9% |
| DCOM (cm) | 0.19 | 0.39 | 0.68 | 0.40 | 0.1 | 35.1% | |
| PO (%) | 29.0 | 83.1 | 100.0 | 75.4 | 22.3 | 29.6% | |
| ASD (cm) | 0.22 | 0.58 | 1.14 | 0.58 | 0.3 | 46.0% | |
| Breast | volume (cm3) | 642.4 | 831.4 | 1054.1 | 813.5 | 129.3 | 15.9% |
| DCOM (cm) | 0.14 | 0.62 | 1.36 | 0.66 | 0.34 | 52.0% | |
| PO (%) | 60.9 | 86.1 | 100.0 | 84.8 | 11.5 | 13.6% | |
| ASD (cm) | 0.12 | 0.35 | 0.82 | 0.39 | 0.17 | 44.2% | |
| Heart | volume (cm3) | 202.1 | 480.0 | 559.7 | 453.7 | 108.9 | 24.0% |
| DCOM (cm) | 0.07 | 0.47 | 2.43 | 0.80 | 0.8 | 96.5% | |
| PO (%) | 35.8 | 92.7 | 99.3 | 86.2 | 18.3 | 21.2% | |
| ASD (cm) | 0.07 | 0.20 | 1.82 | 0.38 | 0.4 | 111% |
Table 2.
Variations between the institutions/observers in delineating the targets and normal structures for Case B. The minimum, median, maximum, mean, the standard deviation (SD) and the SD divided by mean for the volume, distance of center of mass (DCOM), percent overlap (PO), and average surface distance (ASD) of each structure are presented.
| Targets or normal structures | quantity | Min | Median | Max | Mean | SD | SD/Mean |
|---|---|---|---|---|---|---|---|
| Chest wall | volume (cm3) | 361.5 | 476.3 | 949.9 | 543.5 | 207.1 | 38.1% |
| DCOM (cm) | 0.12 | 1.12 | 1.75 | 1.05 | 0.4 | 40.0% | |
| PO (%) | 37.3 | 67.7 | 99.6 | 71.9 | 18.0 | 25.1% | |
| ASD (cm) | 0.14 | 0.43 | 1.10 | 0.46 | 0.1 | 46.4% | |
| Internal mammary nodes | volume (cm3) | 3.2 | 6.1 | 7.8 | 5.8 | 1.7 | 30.0% |
| DCOM (cm) | 0.10 | 1.39 | 3.03 | 1.35 | 0.8 | 61.5% | |
| PO (%) | 24.4 | 50.7 | 91.8 | 53.0 | 17.7 | 33.5% | |
| ASD (cm) | 0.06 | 0.31 | 1.57 | 0.40 | 0.3 | 79.5% | |
| Axillary nodes | volume (cm3) | 51.6 | 61.3 | 132.8 | 69.7 | 16.2 | 40.8% |
| DCOM (cm) | 0.27 | 1.73 | 2.69 | 1.56 | 0.6 | 40.6% | |
| PO (%) | 14.8 | 44.9 | 99.4 | 51.1 | 22.2 | 43.5% | |
| ASD (cm) | 0.17 | 0.55 | 1.92 | 0.68 | 0.4 | 59.4% | |
| Supraclavical nodes | volume (cm3) | 10.04 | 25.04 | 56.74 | 24.90 | 15.1 | 60.5% |
| DCOM (cm) | 0.39 | 1.12 | 2.89 | 1.28 | 0.8 | 59.4% | |
| PO (%) | 14.2 | 59.9 | 97.1 | 55.1 | 21.5 | 39.1% | |
| ASD (cm) | 0.18 | 0.38 | 1.90 | 0.57 | 0.43 | 76.2% | |
| Heart | volume (cm3) | 299.6 | 614.1 | 655.7 | 563.5 | 122.3 | 21.7% |
| DCOM (cm) | 0.08 | 0.76 | 1.91 | 0.76 | 0.6 | 77.7% | |
| PO (%) | 45.1 | 94.6 | 99.6 | 86.8 | 16.1 | 18.6% | |
| ASD (cm) | 0.06 | 0.20 | 1.26 | 0.37 | 0.3 | 89.2% |
Table 3.
Variations between the institutions/observers in delineating the targets and normal structures for Case C. The minimum, median, maximum, mean, the standard deviation (SD) and the SD divided by mean for the volume, distance of center of mass (DCOM), percent overlap (PO), and average surface distance (ASD) of each structure are presented.
| Targets or normal structures | quantity | Min | Median | Max | Mean | SD | SD/Mean |
|---|---|---|---|---|---|---|---|
| Lumpectomy cavity | volume (cm3) | 11.7 | 13.1 | 35.2 | 17.2 | 8.4 | 49.1% |
| DCOM (cm) | 0.08 | 0.26 | 0.61 | 0.29 | 0.2 | 58.1% | |
| PO (%) | 28.5 | 77.4 | 99.9 | 73.0 | 19.1 | 26.1% | |
| ASD (cm) | 0.14 | 0.25 | 0.64 | 0.28 | 0.1 | 46.3% | |
| Boost PTV | volume (cm3) | 63.1 | 143.1 | 223.5 | 146.1 | 57.9 | 39.6% |
| DCOM (cm) | 0.15 | 0.45 | 0.79 | 0.47 | 0.2 | 46.9% | |
| PO (%) | 28.2 | 80.2 | 100.0 | 76.1 | 22.9 | 30.1% | |
| ASD (cm) | 0.28 | 0.51 | 1.04 | 0.53 | 0.2 | 42.5% | |
| Breast | volume (cm3) | 413.5 | 517.8 | 1070.6 | 599.9 | 208.8 | 34.8% |
| DCOM (cm) | 0.06 | 0.86 | 2.63 | 1.07 | 0.8 | 73.8% | |
| PO (%) | 38.6 | 80.4 | 100.0 | 77.7 | 16.4 | 21.2% | |
| ASD (cm) | 0.16 | 0.40 | 1.58 | 0.53 | 0.3 | 66.4% | |
| Internal mammary nodes | volume (cm3) | 3.2 | 5.7 | 15.1 | 6.6 | 3.6 | 54.5% |
| DCOM (cm) | 0.14 | 0.72 | 3.23 | 1.04 | 0.8 | 75.4% | |
| PO (%) | 10.1 | 51.3 | 97.5 | 53.2 | 19.5 | 36.6% | |
| ASD (cm) | 0.09 | 0.28 | 1.39 | 0.32 | 0.2 | 68.0% | |
| Axillary nodes | volume (cm3) | 5.5 | 9.6 | 21.9 | 11.8 | 6.6 | 55.9% |
| DCOM (cm) | 0.19 | 1.52 | 2.74 | 1.50 | 0.7 | 46.9% | |
| PO (%) | 14.7 | 34.5 | 90.0 | 38.8 | 21.4 | 55.2% | |
| ASD (cm) | 0.14 | 0.43 | 1.23 | 0.56 | 0.3 | 62.8% | |
| Supraclavical nodes | volume (cm3) | 6.4 | 23.3 | 47.8 | 22.7 | 13.7 | 60.5% |
| DCOM (cm) | 0.24 | 1.31 | 3.28 | 1.55 | 1.0 | 62.0% | |
| PO (%) | 14.3 | 46.9 | 84.7 | 44.5 | 22.3 | 47.8% | |
| ASD (cm) | 0.14 | 0.52 | 1.85 | 0.70 | 0.5 | 72.6% |
It is seen from Figs. 1-3 and Tables 1-3 that the variations between institutions/observers are generally substantial for all the structures delineated, except for lung. The least variability was observed for the lumpectomy cavity, where the SD for the volumes were 5.1 (15%) and 8.4 (49%) cm3, the mean DCOMs were 0.16 and 0.29 cm, the mean POs were 86 and 73%, and mean ASDs were 0.14 and 0.28 cm for Cases A and C, respectively. Note that the seroma and surgical clips were clearly visible for both cases. The most variability was observed for the nodal regions. For internal mammary nodes of case C, for example, the SD for the volumes was 3.6 cm3 (54%), and the PO between two observers was as low as 10%.
Dosimetric impacts
The significant variability observed in the target and OAR delineation between different institutions/observers will inevitably result in variations in dosimetric planning for breast RT. It was observed during the dosimetric planning that, because of the large variation in the target and OAR delineation, it was not possible to achieve the planning goals for all sets of contours. Dose volume histograms (DVH) obtained based on the contours delineated by different observers are compared in Figs. 4-6. To take into account the build-up region, the volumes used to generate DVHs were modified to within 5 mm below the skin if necessary. The DVHs for Case A for the breast volume and the lung delineated by the nine observers are shown in Fig. 4. It was found, although the coverage criteria for all the PTV contours is not varied dramatically (not shown), the variation in other target coverage (breast volume) and in dose of critical structures [the lung and the heart (not shown)] is substantial. For example, the breast volumes covered by the prescription dose (45 Gy) in the nine plans are in the range of 85 - 95%, the V20 (percentage volume receiving 20 Gy) for the lung varies between 5% and 25%, and the V20 and V10 for the heart change from 0 to 7% and from 2 to 20%, respectively.
Fig. 4.
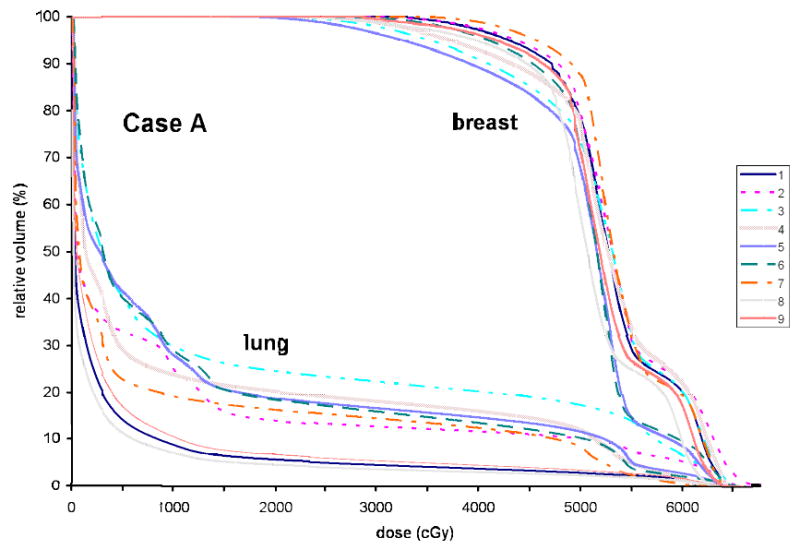
Dose volume histograms based on the plans generated for the breast volumes and the lungs delineated by nine observers for Case A.
Fig. 6.
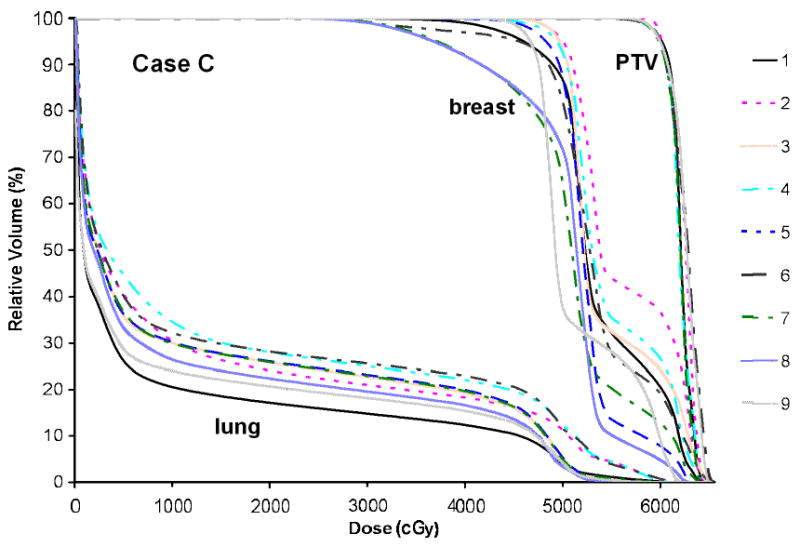
Dose volume histograms generated for Case C for the boost PTVs, the breast volumes and the lungs defined by nine observers.
For Case B, the DVHs based on the contours from all nine observers for (a) the chest wall and the heart and (b) supraclavicular nodes and the lung are presented in Fig. 5. It was found that the planning goal for the boost PTV was achieved for all PTV contours (not shown), while it was not possible to reach the planning goal for all contours of supraclavicular nodes. The V20 for the lung varies between 15 and 35%, and the V20 and V10 for the heart change from 15 to 35% and from 20 to 45%, respectively.
Fig. 5.
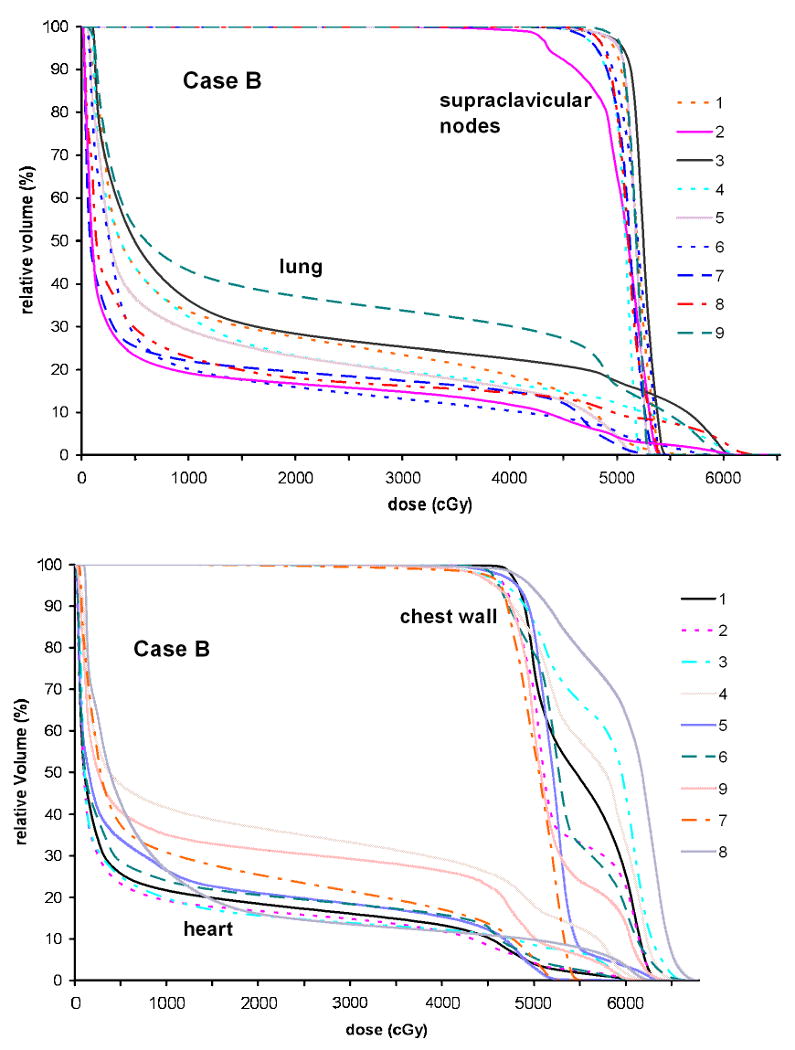
Dose volume histograms for Case B generated based on the contours from nine observers for the chest wall and the heart (top) and supraclavicular nodes and the lung (bottom).
Figure 6 presents the DVHs for the boost PTV, the breast volume and the lung for Case C. While the coverage for all boost PTVs is satisfactory and with small variation, the coverage for the breast volumes by the prescription dose varies between 70 and 95%. The V20 for the lung ranges from 15 to 30%.
Discussion
Despite the proliferation of advanced RT technology (e.g., IMRT, IGRT) for breast cancer, a consensus on both the target and OAR definition is lacking. Studies to systematically quantify the variability in structure delineation and its dosimetric impact for breast RT remain sparse. The inconsistencies in contouring can undermine the advantages of IMRT and IGRT and can compromise the validity of clinical trial results.
This study documents that the variations in delineating the targets and OARs for breast RT by well-experienced observers from different institutions are substantial for all relevant structures. The delineated structures overlapped as low as 10% and the volumes varied with SDs up to 60%. For the breast and chest wall, the most variations were observed in delineating their borders in medial-lateral and cranial-caudad directions. The variation in the delineation of regional nodes was generally higher than other structures.
This substantial variability can result in dramatic variations in dosimetric planning for breast RT. For example, the dose-volume relationship for critical structures delineated by different observers can be remarkably different, although the dosimetric coverage of primary targets may be consistent. In particular, the large variation for the breast and chest wall borders in the medial-lateral direction contributes most significantly to the variation in normal structure dose. As a consequence, this contour and dosimetric variability would contribute to the variation observed when comparing radiation related toxicity data from multi-institutions. Understanding these variations would certainly improve, for example, retrospective dose-response analyses based on multi-institutional clinical data.
It should be noted that, although, in the clinical practice, radiation oncologists may choose to modify their contours based upon the plan obtained during the planning process, the participating radiation oncologists were not involved in generating and in reviewing the dosimetric plans in this work. This consideration was because allowing the contour modification would add another variable and complication in objectively quantifying the inter-observer variation in delineation. From this sense, the dosimetric variability data generated in this work may represent the worst case scenario.
The variability observed in the delineation of targets and OARs may be related both to differences in opinion regarding clinical target and OAR boundaries as well as approaches to incorporation of treatment setup uncertainty and dosimetric limitations (e.g., beam penumbra) in target delineation. For example, because there was no obvious border to the breast superiorly or laterally, a large difference was seen in delineating the breast borders in these two directions. Even though the seroma and surgical clips were clearly visible for Case C, the delineated lumpectomy cavity volumes varied with a SD of 49%. To reduce/eliminate this variability, this author group is working to establish a systematic consensus as an extension to this work. This consensus including anatomic boundaries of targets and OARs will be reported in the near future and it would serve as part of the guidelines for future prospective studies of breast RT, particularly involving IMRT and IGRT. A breast RT atlas will be generated as a part of this effort and will be uploaded onto the RTOG website.
In conclusion, the differences in target and OAR delineation for breast irradiation between institutions/observers appear to be clinically and dosimetrically significant. A systematic consensus on the delineation needs to be established.
Acknowledgments
We wish to thank CMS Inc. for providing contouring tools, Siemens OCS, for making a segmentation software available to this work, Joann Herman, CMD, for helping on dosimetry planning, and Ran Tao and Edward Yang for helping on data collection. XAL and JW were partially supported by a grant from the Susan Komen Breast Cancer Foundation.
Footnotes
Presented as an oral talk at ASTRO annual meeting 2007
Conflict of Interest: There is no conflict of interest for all authors.
References
- 1.Buchholz TA, Gurgoze E, Bice WS, et al. Dosimetric analysis of intact breast irradiation in off-axis planes. Int J Radiat Oncol Biol Phys. 1997;39:261–267. doi: 10.1016/s0360-3016(97)00292-7. [DOI] [PubMed] [Google Scholar]
- 2.Gray JR, McCormick B, Cox L, et al. Primary breast irradiation in large-breasted or heavy women: Analysis of cosmetic outcome. Int J Radiat Oncol Biol Phys. 1991;21:347–354. doi: 10.1016/0360-3016(91)90781-x. [DOI] [PubMed] [Google Scholar]
- 3.Moody AM, Mayles WPM, Bliss JM, et al. The influence of breast size on late radiation effects and association with radiotherapy dose inhomogeneity. Radiother Oncol. 1994;33:106–112. doi: 10.1016/0167-8140(94)90063-9. [DOI] [PubMed] [Google Scholar]
- 4.Taylor ME, Perez CA, Halverson KJ, et al. Factors influencing cosmetic results after conservation therapy for breast cancer. Int J Radiat Oncol Biol Phys. 1995;31:753–764. doi: 10.1016/0360-3016(94)00480-3. [DOI] [PubMed] [Google Scholar]
- 5.Cheng CW, Das IJ, Baldassarre S. The effect of the number of computed tomographic slices on dose distributions and evaluation of treatment planning systems for radiation therapy of intact breast. Int J Radiat Oncol Biol Phys. 1994;30:183–195. doi: 10.1016/0360-3016(94)90534-7. [DOI] [PubMed] [Google Scholar]
- 6.Fisher B, Redmond C, Poisson R, et al. Eight-year results of a randomized clinical trial comparing total mastectomy, and lumpectomy with or without irradiation in the treatment of breast cancer. N Eng J Med. 1989;320:822–828. doi: 10.1056/NEJM198903303201302. [DOI] [PubMed] [Google Scholar]
- 7.Lingos TI, Recht A, Vicini FA, et al. Radiation pneumonitis in breast cancer patients treated with conservative surgery and radiation therapy. Int J Radiat Oncol Biol Phys. 1991;21:355–360. doi: 10.1016/0360-3016(91)90782-y. [DOI] [PubMed] [Google Scholar]
- 8.Wallgren A. Late effects of radiotherapy in the treatment of breast cancer. Acta Oncol. 1992;31:237–242. doi: 10.3109/02841869209088909. [DOI] [PubMed] [Google Scholar]
- 9.Mihai A, Rakovitch E, Sixel K, et al. Inverse vs. forward breast IMRT planning. Med Dosim. 2005;30:149–154. doi: 10.1016/j.meddos.2005.03.004. [DOI] [PubMed] [Google Scholar]
- 10.Hong L, Hunt M, Chui C, Spirou S, et al. Intensity-modulated tangential beam irradiation of the intact breast. Int J Radiat Oncol Biol Phys. 1999;44:1155–1164. doi: 10.1016/s0360-3016(99)00132-7. [DOI] [PubMed] [Google Scholar]
- 11.Teh BS, Lu HH, Sobremonte S, et al. The potential use of intensity modulated radiotherapy (IMRT) in women with pectus excavatum desiring breast-conserving therapy. Breast J. 2001;7:233–239. doi: 10.1046/j.1524-4741.2001.20036.x. [DOI] [PubMed] [Google Scholar]
- 12.Van Asselen B, Raaijmakers CP, Hofman P, et al. An improved breast irradiation technique using three-dimensional geometrical information and intensity modulation. Radiother Oncol. 2001;58:341–347. doi: 10.1016/s0167-8140(00)00278-4. [DOI] [PubMed] [Google Scholar]
- 13.Partridge M, Aldridge S, Donovan E, et al. An intercomparison of IMRT delivery techniques: a case study for breast treatment. Phys Med Biol. 2001;46:N175–185. doi: 10.1088/0031-9155/46/7/402. [DOI] [PubMed] [Google Scholar]
- 14.Hurkmans C, Cho J, Damen E, et al. Reduction of cardiac and lung complication probabilities after breast irradiation using conformal radiotherapy with or without intensity modulation. Radiother and Oncol. 2002;62:163–171. doi: 10.1016/s0167-8140(01)00473-x. [DOI] [PubMed] [Google Scholar]
- 15.Cho BC, Hurkmans CW, Damen EM, et al. Intensity modulated versus non-intensity modulated radiotherapy in the treatment of the left breast and upper internal mammary lymph node chain: a comparative planning study. Radiother Oncol. 2002;62:127–136. doi: 10.1016/s0167-8140(01)00472-8. [DOI] [PubMed] [Google Scholar]
- 16.Lo YC, Yasuda G, Fitzgerald TJ, et al. Intensity modulation for breast treatment using static multi-leaf collimators. Int J Radiat Oncol Biol Phys. 2000;46:187–194. doi: 10.1016/s0360-3016(99)00382-x. [DOI] [PubMed] [Google Scholar]
- 17.Vicini FA, Sharpe M, Kestin L, et al. Optimizing breast cancer treatment efficacy with intensity-modulated radiotherapy. Int J Radiat Oncol Biol Phys. 2002;54:1336–1344. doi: 10.1016/s0360-3016(02)03746-x. [DOI] [PubMed] [Google Scholar]
- 18.Jaffray DA. Image-guided radiation therapy: from concept to practice. Semin Radiat Oncol. 2007;17:243–4. doi: 10.1016/j.semradonc.2007.08.001. [DOI] [PubMed] [Google Scholar]
- 19.Morrow NV, Stepaniak C, White J, et al. Inter- and intra-fractional uncertainties for prone breast irradiation. Int J Radiat Oncol Biol Phys. 2007;69:910–917. doi: 10.1016/j.ijrobp.2007.06.056. [DOI] [PubMed] [Google Scholar]
- 20.Weed DW, Yan D, Martinez AA, et al. The validity of surgical clips as a radiographic surrogate for the lumpectomy cavity in image-guided accelerated partial breast irradiation. Int J Radiat Oncol Biol Phys. 2004;60:484–92. doi: 10.1016/j.ijrobp.2004.03.012. [DOI] [PubMed] [Google Scholar]
- 21.Landis DM, Luo W, Song J, et al. Variability among breast radiation oncologists in delineation of the postsurgical lumpectomy cavity. Int J Radiat Oncol Biol Phys. 2007;67:1299–308. doi: 10.1016/j.ijrobp.2006.11.026. [DOI] [PubMed] [Google Scholar]
- 22.Hurkmans CW, Borger JH, Pieters BR, et al. Variability in target volume delineation on CT scans of the breast. Int J Radiat Oncol Biol Phys. 2001;50:1366–72. doi: 10.1016/s0360-3016(01)01635-2. [DOI] [PubMed] [Google Scholar]
- 23.Wong EK, Truong PT, Kader HA, et al. Consistency in seroma contouring for partial breast radiotherapy: impact of guidelines. Int J Radiat Oncol Biol Phys. 2006;66:372–6. doi: 10.1016/j.ijrobp.2006.05.066. [DOI] [PubMed] [Google Scholar]
- 24.Pitkanen MA, Holli KA, Ojala AT, et al. Quality assurance in radiotherapy of breast cancer--variability in planning target volume delineation. Acta Oncol. 2001;40:50–5. doi: 10.1080/028418601750071055. [DOI] [PubMed] [Google Scholar]
- 25.Sanders KE, Komaki R, Buchholz TA. Target delineation and treatment planning in breast conserving therapy. Rays. 2003;28:237–45. [PubMed] [Google Scholar]
- 26.Struikmans H, Warlam-Rodenhuis C, Stam T, et al. Interobserver variability of clinical target volume delineation of glandular breast tissue and of boost volume in tangential breast irradiation. Radiother Oncol. 2005;76:293–9. doi: 10.1016/j.radonc.2005.03.029. [DOI] [PubMed] [Google Scholar]
- 27.Petersen RP, Truong PT, Kader HA, et al. Target volume delineation for partial breast radiotherapy planning: clinical characteristics associated with low interobserver concordance. Int J Radiat Oncol Biol Phys. 2007;69:41–8. doi: 10.1016/j.ijrobp.2007.01.070. [DOI] [PubMed] [Google Scholar]
- 28.Dijkema IM, Hofman P, Raaijmakers CP, et al. Loco-regional conformal radiotherapy of the breast: delineation of the regional lymph node clinical target volumes in treatment position. Radiother Oncol. 2004;71:287–95. doi: 10.1016/j.radonc.2004.02.017. [DOI] [PubMed] [Google Scholar]
- 29.Crook J, Milosevic M, Catton P, et al. Interobserver variation in postimplant computed tomography contouring affects quality assessment of prostate brachytherapy. Brachytherapy. 2002;1:66–73. doi: 10.1016/s1538-4721(02)00014-4. [DOI] [PubMed] [Google Scholar]
- 30.Xue J, Waterman F, Handler J, et al. The effect of interobserver variability on transrectal ultrasonography-based postimplant dosimetry. Brachytherapy. 2006;5:174–82. doi: 10.1016/j.brachy.2006.05.002. [DOI] [PubMed] [Google Scholar]
- 31.Rasch C, Barillot I, Remeijer P, et al. Definition of the prostate in CT and MRI: A multi-observer study. Int J Radiat Oncol Biol Phys. 1999;43:57–66. doi: 10.1016/s0360-3016(98)00351-4. [DOI] [PubMed] [Google Scholar]
- 32.Yamamoto M, Nagata Y, Okajima K, et al. Differences in target outline delineation from CT scans of brain tumours using different methods and different observers. Radiother Oncol. 1999;50:151–156. doi: 10.1016/s0167-8140(99)00015-8. [DOI] [PubMed] [Google Scholar]
- 33.Tai P, Van Dyk J, Yu E, et al. Variability of target volume delineation in cervical esophageal cancer. Int J Radiat Oncol Biol Phys. 1998;42:277–288. doi: 10.1016/s0360-3016(98)00216-8. [DOI] [PubMed] [Google Scholar]
- 34.Fiorino C, Reni M, Bolognesi A, et al. Intra- and inter-observer variability in contouring prostate and seminal vesicles: Implications for conformal treatment planning. Radiother Oncol. 1998;47:285–292. doi: 10.1016/s0167-8140(98)00021-8. [DOI] [PubMed] [Google Scholar]
- 35.Leunens G, Menten J, Weltens C, et al. Quality assessment of medical decision making in radiation oncology: Variability in target volume delineation for brain tumours. Radiother Oncol. 1993;29:169–175. doi: 10.1016/0167-8140(93)90243-2. [DOI] [PubMed] [Google Scholar]
- 36.Senan S, van Sörnsen de Koste J, Samson M, et al. Evaluation of a target contouring protocol for 3D conformal radiotherapy in non-small cell lung cancer. Radiother Oncol. 1999;53:247–255. doi: 10.1016/s0167-8140(99)00143-7. [DOI] [PubMed] [Google Scholar]
- 37.Bottger T, Grunewald K, Schobinger M, et al. Implementation and evaluation of a new workflow for registration and segmentation of pulmonary MRI data for regional lung perfusion assessment. Phys Med Biol. 2007;52:1261–75. doi: 10.1088/0031-9155/52/5/004. [DOI] [PubMed] [Google Scholar]