Abstract
Common methods of statistical analysis, e.g. Analysis of Variance and Discriminant Analysis, are not necessarily optimal in selecting therapy for an individual patient. These methods rely on group differences to identify markers for disease or successful interventions and ignore sub-group differences when the number of sub-groups is large. In these circumstances, they provide the same advice to an individual as the average patient. Personalized medicine needs new statistical methods that allow treatment efficacy to be tailored to a specific patient, based on a large number of patient characteristics. One such approach is the sequential k-nearest neighbor analysis (patients-like-me algorithm). In this approach, the k most similar patients are examined sequentially until a statistically significant conclusion about the efficacy of treatment for the patient-at-hand can be arrived at. For some patients, the algorithm stops before the entire set of data is examined and provides beneficial advice that may contradict recommendations made to the average patient. Many problems remain in creating statistical tools that can help individual patients but this is an important area in which progress in statistical thinking is helpful.
Keywords: K-nearest neighbor analysis, sequential analysis, personalized medicine, patients-like-me algorithm, statistical methods
NO ONE IS THE AVERAGE PATIENT
In personalized care, the genetic profile of the patient and other information, e.g. co-morbidity, concurrent medication, allergies, etc., are used to tailor the diagnosis and treatment to the patient’s unique characteristics [1–6]. In this paper, when we refer to translational research, we are referring to the use of genetic information in clinical practice, typically by those who are caring for patients and view themselves as practitioners rather than strictly as investigators. These clinicians want to use progress in the mapping of the human genome to help manage the patient at hand. The process is also sometimes referred to as individualized medicine. No matter what it is called, it almost always focuses on tailoring diagnoses and treatment to the benefit of an individual patient.
No patient is the average patient 7. Personalized medicine is expected to tailor findings from research studies to specific patients using their characteristics. One way to do so is to evaluate the statistical model developed for the general ment efficacy, then a patient’s specific age, e.g. 80 years old, is used to evaluate the implication of the general model for the patient at hand. This approach works; unless the patient belongs to a sub-group for which the general finding is not accurate.
In theory, statisticians can conduct sub-group analysis to tailor their findings to individual patients. Since patients have many characteristics, they belong to many sub-groups and while it is possible to do subgroup analysis, in practice it is not a viable option 8. Often there are too few data points to conduct a full subgroup analysis. Personalized medicine is built on the concept that what works well for a group of patients does not necessarily work for everyone in the group. We might find that a medication, harmful to most, helps some patients. Or, we might find that a medication helpful to the average patient is of no use to a particular patient 9. Personalized medicine needs tools and statistics that help clinicians advise one patient at a time, even if in contradiction to the results of group studies.
One approach is for statisticians to formalize the procedures that clinicians use to tailor their general knowledge to help one patient. When it comes to tailoring treatment to a patient’s characteristics, physicians engage in sequential repeated trials without a control group and with a stopping rule of aborting the experiment at the first sign of consistent success 10, 11. Obviously, this approach to data does not address why the patient has improved, which is what a scientist with population-wide statistical models cares about. The scientist might want to continue the intervention after an initial success; he/she may try other combinations of treatments to find an optimal set or to distinguish the main effects of a specific treatment from interaction effects. All of this seems reasonable to the investigator but illogical and maybe unethical from the perspective of the patient. Patients, and by extension their clinicians, care first and foremost that they are better and not why they are better.
The clinician’s thought process provides a prototype for how statistical models could be designed to serve one patient at a time. One such approach is presented in this paper. Like the clinician, the proposed approach sequentially examines the data until a stable non-random (statistically significant) change is observed.
ROOM FOR IMPROVEMENT
Scientists have found cures for many diseases without individualizing the treatment. In many circumstances, treatment is the same for everyone, but increasingly we face situations where some patients benefit from treatment and others do not. Take for example, the treatment of depression. Clinicians have to select among a large list of treatments (selective serotonin reuptake inhibitors, Bupropion, Buspirone, Lithium, tricyclic antidepressants, tetracyclic antidepressants, monoamine oxidase inhibitors, serotoninnorepinephrine reuptake inhibitors, Cognitive Therapy, Triiodothyronine, etc.). In the Sequenced Treatment Alternatives to Relieve Depression Study 12, patients were initially treated with Citalopram, an example of a selective serotonin reuptake inhibitor, or SSRI, the most widely prescribed type of antidepressant. Patients who did not respond to treatment went through additional trials, each with a different set of treatments. In total, four different attempts were made to reduce symptoms of depression, each lasting about 3 months.
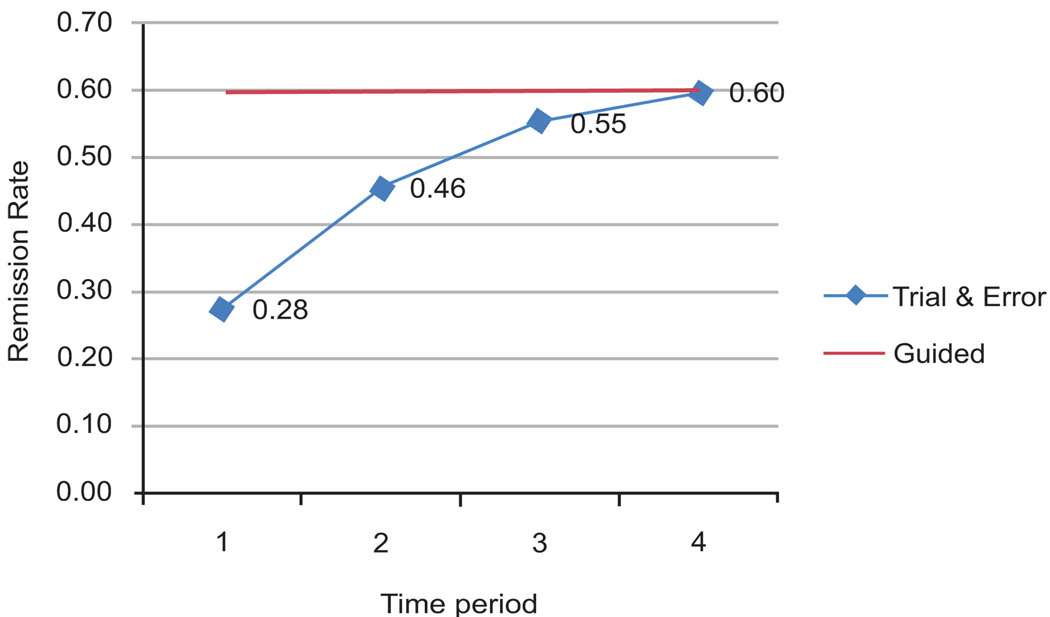
Fig. (1) shows treatment trials on the X-axis and percent in remission on the Y-axis. In the first trial, only 28% of the patients benefitted. Subsequent trials with different treatments raised this percentage to 60%. If somehow we knew ahead of time which treatment would work for which patient, then 60% of patients could benefit from the first treatment (the straight line in the graph). This is 32% above the current experience. Thus, almost one in three patients would have control of their depression sooner if we were able to guide the patient accurately at the start of their care. The difference between the two lines in Fig. (1) shows what can be achieved through guided selection of medications. It also shows the extent to which patients are subjected to ineffective trials.
Fig. (1).
Effectiveness of guided selection of antidepressants.
PATIENTS-LIKE-ME ALGORITHM
If the purpose is to help an individual patient, then a useful method is to find out what has worked for similar patients in the past. Similarity of two patients can be established in different ways. One common method is to calculate the Euclidian distance between the patient and the case in the database. Euclidian distance is the square root of the sum of squared differences in genetic and phenotypic features of the patient and the case. Another approach, which is supported by research on human psychology, is Tversky’s feature matching approach 13–15. In this approach, the similarity of the patient to the case is calculated by dividing the number of matched features with the sum of matched and unmatched features. Furthermore, the unmatched features are weighted differently whether the unmatched feature is in the patient or in the case in the database.
When cases in the database are rated based on their similarity to the patient, then it is possible to see what has worked for similar patients. Additional similar patients are examined until sufficient information exists to detect a statistically significant difference between treatment success and failure. The problem is akin to sequential analysis 16 of K-nearest neighbors 17, a procedure we call Sequential K-Nearest Neighbor Analysis (SKNN). In this approach, cases in the database are considered in decreasing order of their similarity to the patient until an inference threshold is met (see Appendix for details). Each case in the database adds more information about whether the treatment may work for the patient at hand. Early on, findings are not significant because the number of cases examined is small. As the number of cases increases, a statistically significant conclusion may be reached. If all cases are examined sequentially and no statistically significant differences are noted, then there is insufficient information to predict what might work for the patient at hand. In this case, the prediction that works for the average patient should be followed and no additional personalization is possible.
A HYPOTHETICAL EXAMPLE
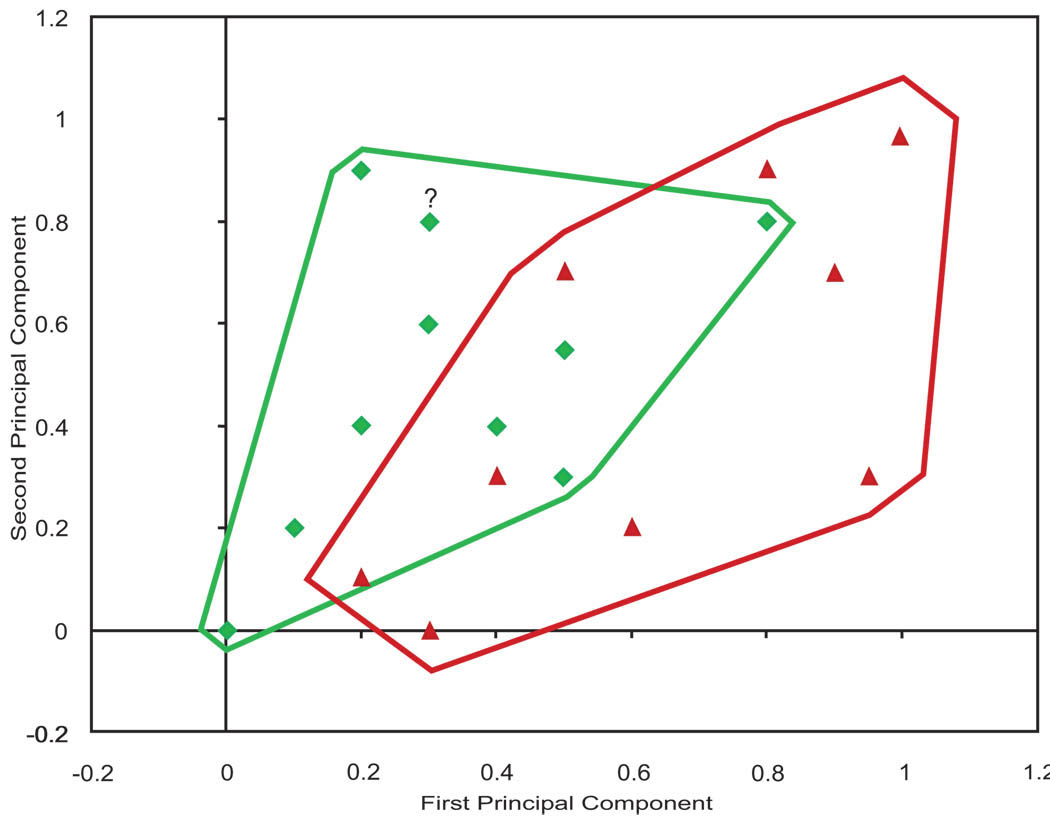
Fig. (2) shows a hypothetical example that can be used to illustrate how predictions are made using sequential K-nearest neighbor (SKNN) analysis.
Fig. (2). An example of treatment success in two dimensions.
(Triangles show failures. Diamonds show successes. The question mark shows the patient for whom we want to make a prediction).
In this figure, X and Y axis are two of the principal components of the genetic and phenotypic information available on the cases within the database. The triangles show cases for whom the treatment failed and the diamonds show cases where the treatment succeeded. The lines around the success and failure points show the structure of the data. There are regions in the periphery, where the prediction is simple and all cases are either success or failure. In the middle, prediction is more difficult, as in this region both success and failures co-occur. In our experience, many databases look like data plotted in Fig. (2), where in some regions predictions are harder than other regions. The question mark (at coordinates .30 and .84) shows the patient for whom we want to make a prediction.
For the case shown as a question mark, the nearest data point is a success. If we were predicting based on the most similar case, then we would predict that the treatment will succeed. If we were predicting based on 2 nearest neighbors, the same prediction would be made. At 2-nearest neighbors, 100% of cases predict success. As the number of similar patients considered increases, then the empirical probability of success changes. If the case is in a neighborhood where most cases succeed, the empirical probability of success increases as additional cases are added. Otherwise it decreases. When all patients are considered, the empirical probability of success drops from 100% to 47%, roughly a tossup. The key in making accurate predictions is to choose the right number of similar patients so that a statistical inference can be made with confidence.
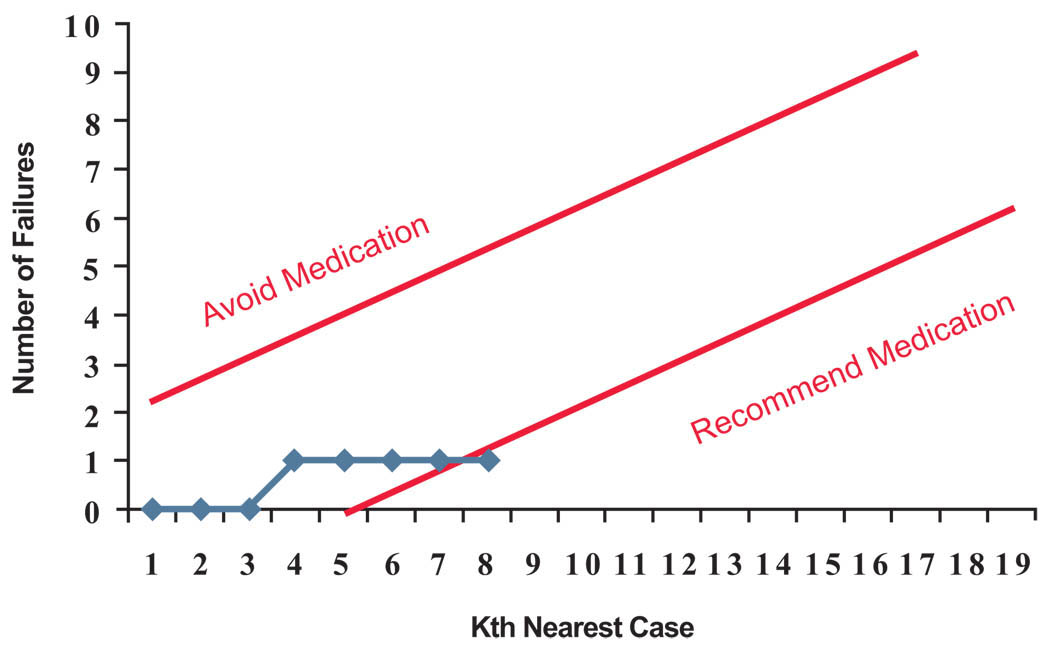
Fig. (3) shows a sequential analysis of the data for the patient marked with a question mark in Fig. (2). In this chart, we are plotting the number of failures. The two straight lines show the stopping rule (if the upper line is crossed then the medication is not recommended and if the lower line is crossed then the medication is recommended). In the first step, the most similar case is a success, but the stopping criterion is not met so we examine another case. The next case is also a success, but still the stopping criterion has not been met. If we examine the 3 most similar cases, 100% of cases have succeeded, but we have examined too few cases to have confidence in this inference. When we continue to examine more cases, the fourth case is a case in which the treatment failed. Now, the number of failures has increased to 1 but the stopping criterion is still not met. We can continue to expand the number of cases examined. When looking at the 8 most similar cases, the rate of success is 87.5% and the number of failures is still one. Now the stopping criterion is met, and we are ready to recommend to this patient to take the medication. Note that this recommendation is made despite the fact that for the average patient no such recommendation is warranted.
Fig. (3). Sequential analysis for this patient stops at 8th most similar case.
(Medication is avoided if the number of failures exceeds the upper control line. Medication is recommended if the number of failures is below lower control line. Otherwise next nearest data point is added to the analysis).
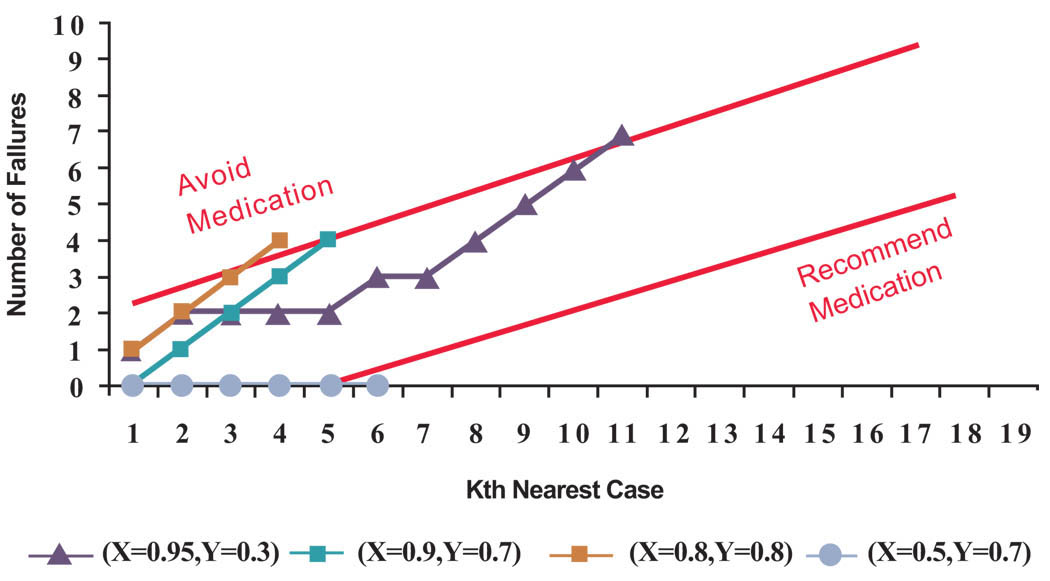
It is helpful to see the same analysis applied to all cases in Fig. (2). Suppose for each case in the database we use, in order of similarity, the remaining cases in the database to predict if the medication might work. Then for 15 patients (79% of cases) no recommendations will be made, for 3 patients (16% of cases) a recommendation is made not to take the medicine and for one patient (5% of cases) a recommendation is made to take the medication. See Fig. (4) for the sequential analysis of cases in which a recommendation was made. It is not surprising that for the majority of cases we make no recommendations; this is implied by the fact that when we consider all cases the chances for success is 47%, close to a tossup. What is more interesting is the fact that for a minority of cases (21% of cases) we make recommendations that are different from the advice given to the average patient. These are the patients that personalized medicine can help.
Fig. (4). Cases in which the algorithm makes a recommendation.
(The X and Y corrdinates in the legend correspond to principal components of cases depicted in Fig. (2). For each case, next nearest neighbor was added to the analysis until the number defective was outside the upper or lower control lines).
We can also evaluate the accuracy of our advice to the reported experience of cases in the database. When the algorithm makes no recommendation, it is illogical to assess the accuracy of its advice. Among the 4 cases in which the patients-like-me algorithm made a recommendation, it was correct in 75% of cases.
PUBLISHING DATABASES NOT PAPERS
Many investigators construct statistical models to predict treatment effectiveness or diagnostic efficacy. Often the models are used to test the hypothesis that a variable predicts treatment outcomes and hence can serve as a biomarker for future patients. These models provide a great deal of insight into the relationship among variables and are the building blocks for progress in science. But these models are not necessary to help individual patients. As part of personalizing the diagnosis and treatment of patients, it is possible to examine the data and see what works for the patient at hand, even though no markers may exist for the population as a whole.
If translational research needs to report what will work for an individual patient, then published literature, with its focus on the average for groups of patients, is of limited use. Instead, data need to be analyzed to identify similar patients. This requires that the clinician should have access to the intervention data collected by investigators. To accomplish this, investigators should be encouraged to publish their databases. The National Library of Medicine is making progress in publishing databases that will be useful for these purposes. The clinical world we envision is directly linked to the evidence and data generated from scientific studies. As scientists collect data, they would publish the data, and clinicians would directly use the data to assess what will work for their patients. In this scheme, the scientist’s key role is not to write papers but rather to gather and organize the relevant data.
CONCLUSIONS
There is a need to design statistical tools that fit the goals of personalized medicine or individualized medicine. Several approaches have been proposed 18–20. This paper proposes an approach of sequentially examining the most similar patients until a stopping criterion is met. This procedure allows statistical inferences to be made for one patient at a time. In contrast, traditional statistics focuses on likelihood of success for the average patient. For a minority of patients, this procedure may recommend actions which contradict the recommendation for the average patient. In this sense, the patients-like-me algorithm fits better with the spirit of personalized medicine because it allows detection of cases in which the average recommendation is no longer valid. It is important to explore the accuracy and consequences of the patients-like-me algorithm and other similar procedures that better fit the goals of individualized medicine.
A number of analytical problems remain, for which additional statistical innovations could be helpful. One question is how to limit features to be used in measuring similarity of two patients. One approach is to focus on features where the patient differs from the norm. Another approach is to include all possible features but weight the features proportional to their impact on outcomes e.g., the likelihood ratio associated with the feature. Still another approach is to rely on a composite linear combination of features that is most effective in separating the success and failure cases. All of these approaches require careful study and we recommend additional exploration of these methods.
For translational research to succeed, clinicians need to have tools that can inform them regarding the level of confidence in recommendations for a specific patient. This paper has demonstrated one such approach. Many more are possible. The challenge to statisticians is to design tools that can work well with the spirit of personalized medicine.
ACKNOWLEDGEMENT
George Mason University has applied for a patent for the algorithm described in this paper (US 2009/0132460A1). Commercial use of the algorithm described here requires written permission. All other uses (scientific studies, occasional evaluation) are allowed without written permission. During the preparation of this manuscript Dr. Alemi was supported by the National Institute of Heart Lung and Blood grant number RO1 HL 084767.
APPENDIX
Cases are considered in order of the gradually reduced similarity to the patient according to the following rules, first proposed by Wald 16:
In the above formulas, F indicates the number of treatment failures in the K most similar patients. If the true probability of medication failure is below p0, we consider not recommending the medication to the patient to be a type one error. If the true probability of medication failure is above p1, we consider recommending the medication to be a type two error. The constants α and β are the maximum allowable probabilities of making type one and type two errors. If all data are examined and the stopping rule (acceptance or rejection of the medication) is not met, then no recommendation can be made to the patient at hand. The stopping rule presented above allows one to stop the process in such a manner that the probabilities of making type one and type two errors do not exceed the desired levels.
In the example reported in the paper, we selected p0 = 0.3, p1 = 0.6. The limits for the probability of type one and type two errors were set at 10% and 5%. A smaller probability of a type two error was assumed in order to reduce chances of recommending a medication that can cause harm compared to avoiding a medication that can be helpful.
The parameters we selected seemed reasonable to us. These parameters are set across patients and are affected by the number of cases examined and the strength of recommendations desired. Many will agree that there should be a relatively high probability of success (in this case 70%) before an intervention is recommended. That seems intuitive to us, but if the disease is incurable and fatal and no other options are available, a treatment might be worth trying even if it has a small chance of success (e.g. 10%). In addition, the stopping rule presented above assumed that there was only one treatment. When there are multiple treatments available, the stopping rule is changed to recommending treatment that has a probability of failure that is significantly less than all the alternative treatments.
Footnotes
This is an open access article licensed under the terms of the Creative Commons Attribution Non-Commercial License (http://creativecommons.org/licenses/by-nc/3.0/) which permits unrestricted, non-commercial use, distribution and reproduction in any medium, provided the work is properly cited.
REFERENCES
- 1.Guidi GC, Will LG. “Personalized medicine” need personalized laboratory approach? Clin Chim Acta. 2009;400:25–29. doi: 10.1016/j.cca.2008.09.029. [DOI] [PubMed] [Google Scholar]
- 2.Heath JR, Davis ME, Hood L. Nanomedicine targets cancer. Sci Am. 2009;300:44–51. doi: 10.1038/scientificamerican0209-44. [DOI] [PMC free article] [PubMed] [Google Scholar]
- 3.Lin KM, Perlis RH, Wan YJ. Pharamcogenomic strategy for individualizing antidepressant therapy. Dialogues Clin Neurosci. 2008;10:401–408. doi: 10.31887/DCNS.2008.10.4/kmlin. [DOI] [PMC free article] [PubMed] [Google Scholar]
- 4.Pene F, Courtine E, Cariou A, Mira JP. Toward theragnostics. Crit Care Med. 2009;37:S50–S58. doi: 10.1097/CCM.0b013e3181921349. [DOI] [PubMed] [Google Scholar]
- 5.van’t Veer LJ, Bernards R. Enabling personalized cancer medicine through analysis of gene-expression patterns. Nature. 2008;452:564–570. doi: 10.1038/nature06915. [DOI] [PubMed] [Google Scholar]
- 6.Warrier MR, Hershey GK. Asthma genetics: personalizing medicine. J Asthma. 2008;45:257–264. doi: 10.1080/02770900801966180. [DOI] [PubMed] [Google Scholar]
- 7.Neuhauser D. Why design of experiments just may transform health care. Qual Manag Health Care. 2005;14:217–218. doi: 10.1097/00019514-200510000-00003. [DOI] [PubMed] [Google Scholar]
- 8.Sanders GD, Inoue L, Samsa G, Kulasingam S, Matchar D. Use of bayesian techniques in randomized clinical trials: a CMS case study. Technology Assessment Report, Project ID: STAB0508. Agency for Healthcare Research and Quality. 2009 [PubMed] [Google Scholar]
- 9.Dumas TE, Hawke RL, Lee CR. Warfarin dosing and the promise of pharmacogenomics. Curr Clin Pharmacol. 2007;2:11–21. doi: 10.2174/157488407779422276. [DOI] [PubMed] [Google Scholar]
- 10.Alemi R, Alemi F. A practical limit to trials needed in one-person randomized controlled experiments. Qual Manag Health Care. 2007;16(2):130–134. doi: 10.1097/01.QMH.0000267450.40252.93. [DOI] [PubMed] [Google Scholar]
- 11.Sinkule JA, Alemi F. Helping clients think through their causal models: application to counseling clients to exercise. Qual Manag Health Care. 2008;17:66–79. doi: 10.1097/01.QMH.0000308639.12474.c3. [DOI] [PubMed] [Google Scholar]
- 12.Alpert JE, Biggs MM, Davis L, et al. STAR*D Investigators. Enrolling research subjects from clinical practice: ethical and procedural issues in the Sequenced Treatment Alternatives to Relieve Depression (STAR*D) trial. Psychiatry Res. 2006;141:193–200. doi: 10.1016/j.psychres.2005.04.007. [DOI] [PubMed] [Google Scholar]
- 13.Tversky A. Features of similarity. Psychol Rev. 1977;84:327–352. [Google Scholar]
- 14.Ameel TE, Storms G. Measures of similarity in models of categorization. Mem Cognit. 2004;32:379–389. doi: 10.3758/bf03195832. [DOI] [PubMed] [Google Scholar]
- 15.Ritov I, Gati I, Tversky A. Differential weighting of common and distinctive components. J Exp Psychol Gen. 1990;119:30–41. doi: 10.1037/0096-3445.119.1.30. [DOI] [PubMed] [Google Scholar]
- 16.Wald A. “Sequential Tests of Statistical Hypotheses”. Ann Math Stat. 1945;16(2):117–186. [Google Scholar]
- 17.Hastie T, Tibshirani R, Friedman J. The elements of statistical learning. 2nd ed. New York, NY: Springer Science and Business Media; 2009. [Google Scholar]
- 18.Baek S, Moon H, Ahn H, Kodell RL, Lin CJ, Chen JJ. Identifying high-dimensional biomarkers for personalized medicine via variable importance ranking. Biopharm Stat. 2008;18:853–868. doi: 10.1080/10543400802278023. [DOI] [PubMed] [Google Scholar]
- 19.Zhang W, Ratain MJ, Dolan ME. The HapMap resource is providing new insights into ourselves and its application to pharmacogenomics. Bioinform Biol Insights. 2008;2:15–23. doi: 10.4137/bbi.s455. [DOI] [PMC free article] [PubMed] [Google Scholar]
- 20.Clarke J, West M. Bayesian Weibull tree models for survival analysis of clinico-genomic data. Stat Methodol. 2008;5:238–262. doi: 10.1016/j.stamet.2007.09.003. [DOI] [PMC free article] [PubMed] [Google Scholar]


