Abstract
Optical coherence tomography (OCT) is becoming one of the most important modalities for the noninvasive assessment of retinal eye diseases. As the number of acquired OCT volumes increases, automating the OCT image analysis is becoming increasingly relevant. In this paper, a method for automated characterization of the normal macular appearance in spectral domain OCT (SD-OCT) volumes is reported together with a general approach for local retinal abnormality detection. Ten intraretinal layers are first automatically segmented and the 3-D image dataset flattened to remove motion-based artifacts. From the flattened OCT data, 23 features are extracted in each layer locally to characterize texture and thickness properties across the macula. The normal ranges of layer-specific feature variations have been derived from 13 SD-OCT volumes depicting normal retinas. Abnormalities are then detected by classifying the local differences between the normal appearance and the retinal measures in question. This approach was applied to determine footprints of fluid-filled regions—SEADs (Symptomatic Exudate-Associated Derangements)—in 78 SD-OCT volumes from 23 repeatedly imaged patients with choroidal neovascularization (CNV), intra-, and sub-retinal fluid and pigment epithelial detachment. The automated SEAD footprint detection method was validated against an independent standard obtained using an interactive 3-D SEAD segmentation approach. An area under the receiver-operating characteristic curve of 0.961 ± 0.012 was obtained for the classification of vertical, cross-layer, macular columns. A study performed on 12 pairs of OCT volumes obtained from the same eye on the same day shows that the repeatability of the automated method is comparable to that of the human experts. This work demonstrates that useful 3-D textural information can be extracted from SD-OCT scans and—together with an anatomical atlas of normal retinas—can be used for clinically important applications.
Index Terms: Age-related macular degeneration (AMD), anatomical atlas, spectral domain optical coherence tomography (SD-OCT), three-dimensional (3-D) texture, macula, symptomatic exudate-associated derangements (SEADs)
I. Introduction
Optical coherence tomography (OCT) is an increasingly important modality for the noninvasive management of eye diseases, including age-related macular degeneration (AMD) [1]–[3], glaucoma [4], and diabetic macular edema [5]. An OCT image represents a cross-sectional, micron-scale depiction of the optical reflectance properties of the tissue. Spectral domain OCT (SD-OCT) [6] produces 3-D volumes, which have proven useful in clinical practice [7]. It is a powerful modality to qualitatively assess retinal features and pathologies or to make quantitative measurements of retinal morphology. As the number of acquired SD-OCT volumes and their resolutions increase, automating these assessments become increasingly desirable. We have previously reported methods for multilayer segmentation of retinal OCT images [8], [9], methods for optic nerve head analysis from SD-OCT [10], [11], and demonstrated the clinical potential of such quantitative approaches [11]–[13]. In this paper, we propose an automated method for the 3-D analysis of retina texture, and quantification of fluid-filled regions (either intra- or subretinal fluid, or pigment epithelial detachment) associated with neo-vascular (or exudative) AMD.
Neovascular AMD is an advanced form of AMD that causes vision loss due to the growth of an abnormal blood vessel membrane from the choroidal vasculature (choroidal neovascularization or CNV) outside of the choroid, ultimately leading to leakage of fluid into the macular retina. In the past, CNV treatment—mainly laser photocoagulation—was guided by the appearance of the membrane on a fluorescein angiogram, which is invasive [14], [15]. With the advent of the usually curative treatment of CNV using anti-angiogenic intravitreal injections, the presence and amount of intraretinal fluid has become the main criterion for guiding the frequency of these injections, typically by visual evaluation of one or a small number of SD-OCT slices [16], [1], [17], [18], [2], [19], [3]. The choice of which SD-OCT slices are reviewed and the visual judgment of the amount of fluid, are all subjective, and in all likelihood lead to considerable variability in treatment decisions [18], [20]. In the following of the text, we use the term symptomatic exudate associated derangement (SEAD) for intraretinal and subretinal fluid as well as pigment epithelial detachments in the macula. Until now, only semi-automated methods in 2-D OCT slices, such as Cabrera Fernández’ manually-initialized deformable model [21], have been proposed to help quantify the amount of SEADs. In this paper, we report a fully automated 3-D method to determine the SEAD footprint in SD-OCT images.
One of the enabling steps for many applications of automated retinal OCT analysis is automated intraretinal layer segmentation, performed both in macular scans [9] and in scans of the optic nerve head [10], [11]. These segmentations allow the analysis of each retinal layer individually. Consequently, it is possible to characterize normal appearance of retinal layers across the anatomical region under study. By measuring the differences between layer-based indices from a new scan to the normal appearance, it is possible to detect retinal abnormalities. In particular, it is possible to detect SEADs. Normal appearance of six layers across the macula has been described previously in terms of thickness [13]. Though thickness differences may characterize SEADs from normal regions, differences in texture are usually more remarkable, because of the different optical properties of “dry” and “fluid-filled” retinal tissue, and intraretinal layers can therefore be characterized in terms of 3-D textures. The suitability of texture to classify tissues in OCT images has been shown in previous studies [22]. In order to meaningfully characterize the texture of automatically segmented intraretinal layers in normal eyes, it is preferable that the texture property of these layers be homogeneous along the z-direction (the tissue depth). Here, we introduce a novel ten-layer automated segmentation that fulfills this requirement. Twenty-one textural features, originally defined to analyze 2-D images [23], [24] were implemented in 3-D, as described partly in this paper and in [25], and measured locally for each layer. The variations of texture and thickness across the macula in these ten layers, averaged over thirteen normal eyes, defined the normal appearance of maculae in SD-OCT scans. A machine learning approach that classifies the retinal pathology based on feature- and layer-specific properties in comparison with the normal appearance of maculae is reported.
The presented automated SEAD footprint finding method was compared to an expert-defined reference standard in 91 macula-centered 3-D OCT volumes obtained from 13 normal and 26 pathologic eyes. Finally, the repeatability of the reported approaches was assessed by comparing the segmentations obtained in consecutive scans from 12 eyes of patients acquired on the same day.
II. Automated Sead Footprint Detection
The principle of our automated SEAD footprint method is to measure the deviation of texture and layer thickness properties in a pathological macula from corresponding values of these properties in normal maculae. We describe in this section a procedure to characterize the normal appearance of maculae in OCT scans from a set of macula-centered 3-D OCT volumes acquired with technically similar devices (Fig. 1). In these volumetric images I(x, y, z) of fixed size X × Y × Z, the x-, y-, and z-directions correspond to the nasal-temporal direction, the superior-inferior direction, and the depth (direction perpendicular to the layers), respectively. We assume that all the foveae are approximately aligned in the center of the scans along the x-and y-directions, that all the left eyes have been flipped along the x-axis, and the rotation and scale variations across images can be neglected. It implies that only a registration along the z-direction is required to allow calculation of local features describing the normal appearance of maculae and the normal feature ranges. For each feature used in this study, a X × Y × L distribution map is built. Each cell (x, y, l) in these maps describes the distribution across normal maculae of the feature values in the neighborhood of the (x, y) line (i.e., a vertical column) within the lth layer, l = 1… L. The number of layers (L = 10), was selected in advance so that the texture property in each of these layers be homogeneous along the z-direction. The first step to characterize the normal appearance of maculae consists of segmenting the L = 10 intraretinal layers. Because of motion artifacts in OCT images, the layers are usually wavy along the y direction, which artificially affects their texture properties. As a consequence, to correctly measure the texture features within these layers, it is necessary to flatten them first.
Fig. 1.
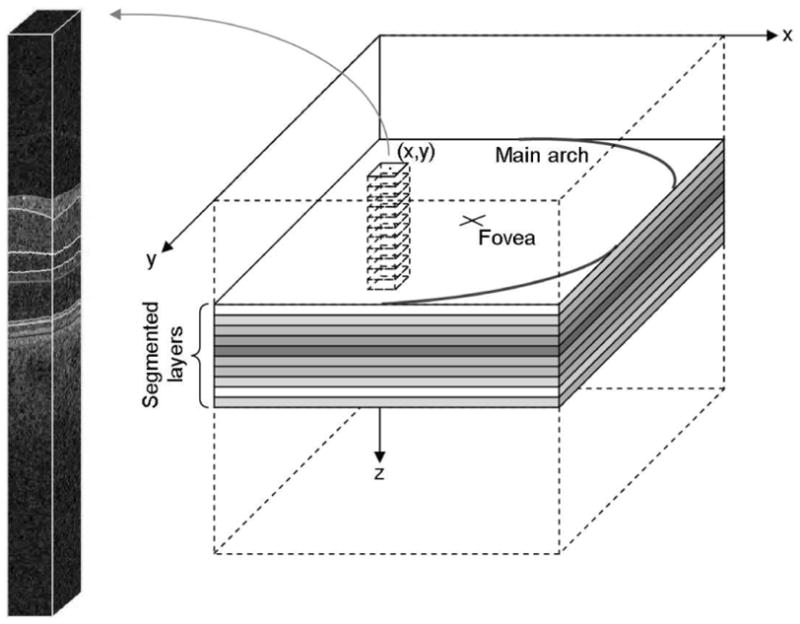
Geometry of the textural characterization of the macula. Local textural or thickness indices are extracted within the intersection of rectangular columns with each segmented intraretinal layer. The features computed in each of these intersections are used to define an abnormality index for the (x, y) line at the center of the column.
A. Intraretinal Layer Segmentation
Our research group previously presented a 3-D graph search-based approach for simultaneous detection of multiple interacting surfaces [27], with the incorporation of regional information and varying constraints to segment six intraretinal layers in spectral-domain macular OCT scans [9]. In addition, we had introduced a fast multiscale 3-D graph search method to detect three retinal surfaces from 3-D OCT scans centered at the optic nerve head [10]. In this study, we report an extended method for automated segmentation of 10 intraretinal layers identified in Fig. 2 from 3-D macular OCT scans using our multiscale 3-D graph search technique [28]. The basic concept of this approach is to detect the retinal surfaces in a subvolume constrained by the retinal surface segmented in a low-resolution image volume. The cost functions for the graph searches, capable of detecting the retinal surfaces having the minimum costs, are inverted gradient magnitudes of the dark-to-bright transition from top to bottom of the OCT volume for surfaces 1,3,5,7,9,10 and those of the bright-to-dark transition for surfaces 2, 4, 6, 8, 11 (see Fig. 2). The eleven surfaces are hierarchically detected starting from the most easily detectable, i.e., starting with the highest gradient magnitudes, and ending with the most subtle interfaces. Once detected, all segmented surfaces are smoothed using thin plate splines.
Fig. 2.
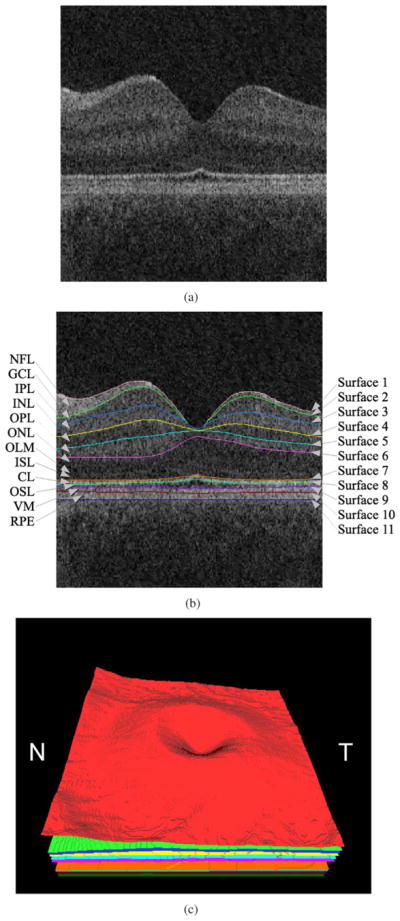
Segmentation results of 11 retinal surfaces (10 layers). (a) X-Z image of the OCT volume. (b) Segmentation results, nerve fiber layer (NFL), ganglion cell layer (GCL), inner plexiform layer (IPL), inner nuclear layer (INL), outer plexiform layer (OPL), outer nuclear layer (ONL), outer limiting membrane (OLM), inner segment layer (ISL), connecting cilia (CL), outer segment layer (OSL), Verhoeff’ s membrane (VM), and retinal pigment epithelium (RPE) [26]. The stated anatomical labeling is based on observed relationships with histology although no general agreement exists among experts about precise correspondence of some layers, especially the outermost layers. (c) 3-D rendering of the segmented surfaces (N: nasal, T: temporal).
Once all the surfaces are detected, the macula in the original SD-OCT volume is flattened using the last intraretinal surface (surface 11) as a reference plane. The retina in the original SD-OCT volume is flattened by adjusting scans up and down in the z-direction [9], [10].
B. 3-D Textural Feature Extraction
Once the layers are segmented and flattened, the properties of the macular tissues in each of these layers are extracted and analyzed. In addition to layer thickness and layer thickness variations, texture is well suited to characterize different tissues. Extracting 3-D textural features in layer subvolumes is clearly more relevant than extracting 2-D textural features in individual slices. Therefore, 21 3-D statistical texture features are computed in flattened layer subvolumes. Each of these subvolumes consists of the intersection of a vertical column, with a square base Sx × Sy centered on an (x, y) line, and of an intraretinal layer I. The textural features are the intensity level distribution measures, run length measures, co-occurrence matrix measures, and wavelet analysis measures [23], [24]. The intensity level distribution measures are: the mean, variance, skewness, kurtosis, and gray level (intensity) entropy. These measures are used to describe the occurrence frequency of all the intensity levels in a subvolume of interest. The run length measures include the short run emphasis, long run emphasis, gray level nonuniformity, run length nonuniformity, and run percentage. The run length features describe the heterogeneity and tonal distributions of the intensity levels in a subvolume of interest. The co-occurrence matrix measures are: the angular second moment, correlation, contrast, entropy, inertia, and inverse difference moment. The co-occurrence matrix measures describe the overall spatial relationships that the intensity tones have to one another, in a sub-volume of interest. Three-dimensional formulations of the intensity level distribution, run length, and co-occurrence matrix measures have been described previously [25]. Run length and co-occurrence analyses both require quantifying voxel intensities in the OCT images. That is obvious for run length measures because the concept of uniform intensity sequences is ill-defined without quantification in the presence of noise, in particular laser speckle. The gray-level intensities are quantified in equally-populated bins.
The wavelet transform has been widely used in OCT images for denoising and despeckling [29]–[31], where improvements of the signal-to-noise ratio of up to 14 dB have been observed [31]. The wavelet transform has also been applied to OCT images for texture analysis of tissues [32], where its effectiveness and its invariance to acquisition device have been shown. The fact that the wavelet transform is well suited to remove the speckle is a strong motivation to use it for tissue characterization [33]. To the best of our knowledge, all existing applications of wavelets to retinal OCT have so far been performed in two dimensions, probably for computational efficiency. We introduce the first 3-D wavelet analysis of OCT images; it is based on a computationally efficient yet flexible non-separable lifting scheme in arbitrary dimensions [34]. An adaptive implementation of this wavelet transform has previously been applied to 2-D texture retrieval by us [24]. Here, it is extended to 3-D as explained hereafter.
The lifting scheme (Fig. 3) relies on a filter bank that decomposes an input signal x into an approximation a and M − 1 signals x1 … xM−1 containing details of the input signal along specific directions. The filter bank consists of a set of linear filters Pi (prediction) and Ui (update), i = 1… M−1. It involves downsampling the signal by a dilation matrix D ∈  (ℤ) denoted ↓ D, such that M = |det(D)|, where
  (ℤ) denotes the set of 3×3 matrices. The input lattice ℤ3 is mapped to M sub-lattices
  = D ℤ3 + ti, ti ∈ ℤ3, t0 = 0, i = 0 … M−1. After the decomposition,
  contains the approximation a of the signal and
  ,
i = 1… M−1, contains its details di along direction ti. In order to analyze the signal at different scales, the approximation a of the signal is further decomposed by the same filter bank, and so on until the desired scale is reached. Note that the input signal can be reconstructed by reversing all the operations. Two decimation matrices D are commonly used in 3-D; the face-centered orthorhombic matrix (M = 2) and matrix D = 2.I (M = 23), generating the separable lattice. Because the lattices generated by the latter matrix are separable, the decomposition is more computationally efficient, so it was used in this study. The order of the prediction and update filters is set to 4. In texture images, the wavelet coefficients in each sub-lattice have a zero-mean generalized Gaussian distribution [35]. To characterize these distributions, and thus the texture properties, we extract their standard deviations and their kurtosis measures. For resolution purposes, the first two scales (i.e., the two highest frequency bands) are characterized. Another texture descriptor immediately derived from this wavelet analysis is the fractal dimension, which can be estimated by the logarithmic decay of the wavelet coefficient variances across scales [36].
Fig. 3.
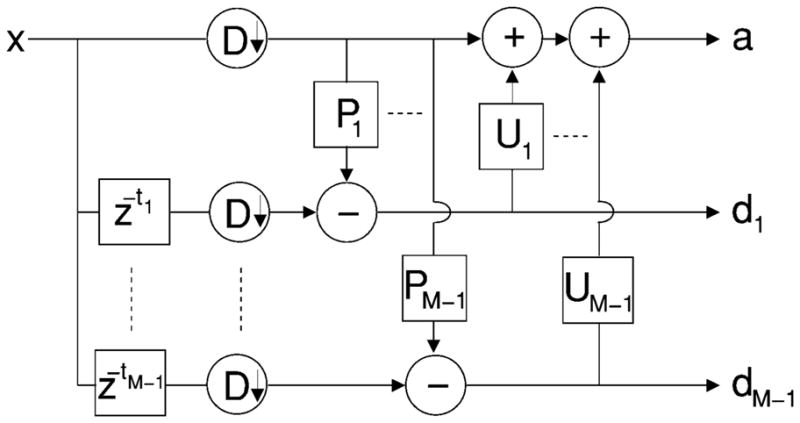
M-band lifting scheme filter bank.
For some of the textural features described above (from the run length, co-occurrence matrix and wavelet analyses), features are computed along all main directions. In order to reduce the cardinality of the textural characterization, these values are averaged to form 21 scalar features [23].
C. Normal Appearance of Maculae in SD-OCT Scans
We have presented how to compute 21 textural features in subvolumes of interest within ten segmented and flattened intraretinal layers. Two additional features, the average and standard deviation of the layer thickness, are also computed for each subvolume. Thus, a complete set of descriptors consists of 23 features. The normal appearance of maculae is derived from a set of N OCT volumes from normal eyes. The distribution of each feature/across these N volumes, in the neighborhood of an (x,y) line (i.e., a vertical column) within the lth layer, is defined by the average μf,x,y,l and the standard deviation σf,x,y,l of the N feature values (one feature value per OCT volume). This representation is convenient since the local deviation d(x, y,l) between the feature value f(x,y,l) computed for a new sample and the normality can be expressed in terms of z-score
| (1) |
Assuming a statistically slow variation of texture and thickness properties across each layer of the macula, it is not necessary to estimate the average and the standard deviation directly from the data for each location (x, y). The following fast approach is used instead.
The coronal plane is partitioned in patches of size Sx × Sy, for simplicity Sx = Sy = S.
The features are extracted in each layer within columns with a Sx × Sy rectangular base.
The average and the standard deviation at the center of these patches are estimated from the N feature values.
The entire average and standard deviational maps are obtained by bilinear interpolation.
Because the local distribution of a feature in one layer of the macula is defined by only two parameters (mean, standard deviation), the normal appearance of maculae can be derived from a small set of images. However, should a large set of images become available, a comprehensive atlas [38]–[42] consisting of feature histograms could be used instead, together with histogram-based statistical distances.
D. Classifying the Deviations From the Normal Appearance of Maculae
A straightforward solution to detect retinal image abnormalities consists of computing the local deviations from the normal appearance of maculae at each location (x,y) in each layer l and selecting the areas where the absolute deviation is greater than a predefined cutoff (e.g., d(x, y, l) ≥ 1.98 at the 95% confidence level) for at least one feature. More generally, in order to build an abnormality-specific detector, we propose to train a classifier whose inputs are the z-scores computed for relevant features. The comprehensive z-scores are used because an abnormality may affect several layers in the neighborhood of a given location (x,y). A training dataset is used to tune a classifier. First, normal and abnormal columns are sampled from this dataset. The label of each column is the percentage of the patch covered by the target abnormality. The relevant features are selected by F-fold cross-validation, using k-NN classifiers [43]. Finally, all the training samples are used to classify new columns using a k-NN classifier based on the selected features.
E. Training and Assessment of SEAD Footprint Detection
The proposed abnormality detection is employed for the determination of SEAD footprints. It was trained and independently validated, as described above, on a set of reference images, some of which were acquired from normal eyes and the others from pathological eyes with SEADs. Cross-validation was used to guarantee that the training and testing sets were completely disjoint during the multilevel training process.
An expert standard for SEAD footprints is obtained for the subset of pathological images by projecting the 3-D SEAD segmentations (obtained interactively by experts, Section III-C) onto the coronal plane. This way, a binary footprint is obtained that serves as ground truth for training and validation of our method.
The ten subretinal layers are segmented in each OCT volume from normal and pathological eyes as described in Section II-A. An additional artificial layer is added below the deepest intraretinal layer so that subretinal abnormalities can also be detected. The lowest surface is obtained by translating surface 11 along the z-direction by a predefined offset derived from observations of a typical depth of subretinal fluid regions (we used 40 voxels in this work).
The set of images is divided into K groups of equal size, with the same proportion of normal and pathological eyes. All images acquired from the same patient are assigned to the same group.
The performance is assessed by K-fold cross-validation: it is successively trained on K−1 groups and performance-tested on the remaining group.
The detail of the training procedure performed on K− 1 groups, during one step of the cross-validation, is as follows:
The most discriminative out of the 23 calculated features (Section II-B) are selected by an inner leave-one-eye-out cross-validation procedure.
The subset of normal images in the inner training set is used to characterize the normal appearance of maculae.
The performance of a (set of) feature(s) is assessed by calculating the area under the ROC curve, or AUC, of the SEAD classifier. The parameter of the ROC curve is the SEAD probability measured for OCT columns with a S × S square base from the inner validation set (per-patch AUC).
Using the identified set of best features evaluated in OCT columns with a S × S square base from the inner validation set (per-patch AUC), a forward feature selection procedure is performed, in which features are sequentially selected until the AUC stops increasing. At each step, the feature maximizing the AUC increase is selected.
All the feature vectors extracted from nonoverlapping S × S patches in the inner training set are used as reference samples by the k-NN classifier; their labels are derived from the expert standard. Overlapping S × S patches from the OCT volumes in the validation eye are then classified and the SEAD probability in each pixel (x, y) is defined as the average probability of all the patches containing (x, y) [44].
The detail of the testing procedure performed on one of the K groups, during one step of the outer cross-validation, is described as follows.
The subset of normal images in the outer training set is used to characterize the normal appearance of maculae.
All the feature vectors extracted from nonoverlapping S × S patches in the outer training set (the remaining K−1 groups) are used as reference samples by the k-NN classifier. The optimal features found on the outer training set are extracted in overlapping S × S patches from the OCT volumes in the outer testing set and classified. The SEAD probability in each pixel (x,y) of a testing image is defined from all the patches containing (x,y), as described above.
The average and the standard deviation of the area under the ROC curve across the K testing sets is reported. Note that in the inner cross-validation loops, the validation data is used to train the system, but in the outer loop, the validation data is completely independent of the training procedure, which ensures a complete separation of the training and testing data in the reported results.
This training/testing procedure is repeated for several patch sizes: S ∈ {10,15, 20}. The performance of the system is also assessed for a varying numbers of images in the training set. Two scenarios are considered: 1) either the features extracted from each macular column are classified directly to obtain a probability that a SEAD is present in this column, or 2) the deviations from the characterization of normal maculae are measured and classified, as described in Section II-D.
F. Obtaining a Binary SEAD Footprint
In order to obtain a binary footprint for SEADs in an image input to the system, a probability map is first obtained as described in the previous section. This probability map is then thresholded and the footprint of the SEADs in this image defined as the set of all the pixels with a probability greater than a threshold. The threshold that minimizes the L1 distance between the expert standard for SEAD footprints and the thresholded probability maps among all the images in the reference dataset is selected (see previous section).
III. Experimental Methods
A. Available Oct Images From Neovascular AMD Patients
In total, 91 macula-centered 3-D OCT volumes (200 × 200 × 1024 voxels, 6 × 6 × 2 mm3, voxel size 30 × 30 × 1.95 μm3) were obtained from 13 normal and 26 pathologic eyes using three technically identical Cirrus HD-OCT machines (Carl Zeiss Meditec, Inc., Dublin, CA). The 13 OCT volumes from 13 normal subjects were used to characterize the normal appearance of maculae, as described in Section II-C. The remaining 78 OCT volumes from 23 patients (26 eyes) were used to assess the performance of our SEAD footprint detection method. Among these 78 volumes, twelve pairs were obtained from the same eyes on the same days at close temporal intervals and were used for repeatability assessment. The study protocol was approved by the institutional review board of the University of Iowa. For cross-validation purposes, the dataset was divided in K = 6 groups of 13 images from pathological eyes plus 2 (or 3) images from normal eyes.
B. Assessment of Retinal Layer Segmentation Performance
The retinal layer segmentation was assessed on an independent set of OCT volumes from normal eyes, acquired by the Cirrus SD-OCT machines. An independent standard was obtained from two experts. The layer segmentation was compared to the average in the z-direction of the two manual tracings, following the layer segmentation performance assessment reported in [9]. The unsigned border positioning errors were calculated by measuring the Euclidean distance in the z-direction between the computer segmentation and the reference standard.
C. Independent Standard: Expert-Definition of Seads in 3-D
Consistently annotating the SEADs in 3-D OCT images manually is a difficult task even for expert observers. Therefore, we have developed a novel interactive computer-aided approach that consists of three main steps: 1) SEAD locations are interactively identified by defining an enclosing region of interest, in which a SEAD is located, followed by mouse-clicking inside of the SEAD region using a convenient 3-D OCT viewer software; 2) the candidate 3-D SEAD regions are detected by a region-growing approach that uses graph cuts for regional energy function minimization; 3) the graph cut approach yields 3-D binary regions, the surfaces of which are interactively edited by expert observers until full satisfaction. This approach is completely independent from the SEAD footprint detection method reported above and thus can be used to define an x, y projection independent standard for SEAD footprint validation.
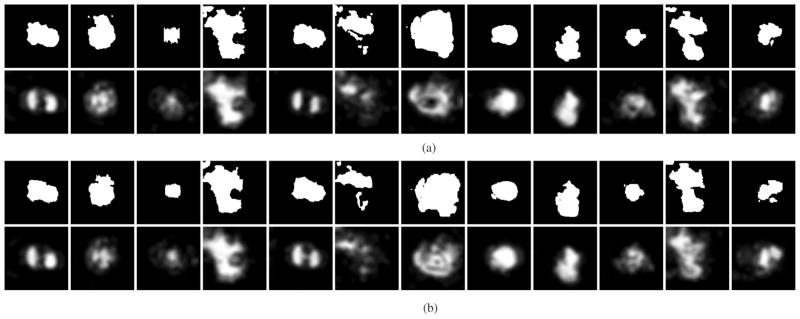
For a detailed description of the graph-cut approach used in the SEAD finding method (step (2) of the above description) we refer the reader to Boykov’s work [45]. After the SEAD regions are detected using the graph-cut approach and edited in 3-D by expert retinal specialists who were unaware of the results of the automated SEAD footprint detection, binary SEAD footprints are defined by x – y projecting the three-dimensional binary SEAD regions. These binary SEAD footprints [see upper rows of Fig. 8(a) and (b)] were used for validation of our automated method. To achieve the highest quality of the 3-D SEAD regions, extensive editing of the SEAD surface was performed in 3-D, requiring on average about 60 min of expert interaction per eye.
Fig. 8.
Repeatability study—Two scans from the same eye were acquired on the same day at close temporal intervals. For each panel (a), (b), the upper row shows the binary SEAD footprint representing the independent standard. The lower row shows the SEAD footprints obtained by our automated method, the gray levels represent the probability of the point belonging to the SEAD footprint; probability scale is provided in Fig. 4(c). These probabilities were thresholded to arrive at a binary segmentation, varying the threshold levels yielded the ROC curves given in Fig. 6.
The automatically detected footprints (Section II) are compared with the independent standard footprint by calculating pixelwise sensitivity and specificity. For different thresholds on the SEAD probability map, a foreground pixel is considered a match if and only if it is also a foreground pixel in the independent standard footprint. A receiver-operating characteristic curve is obtained as discussed earlier.
D. Repeatability Study
The repeatability of our automated SEAD segmentation and that of the interactive SEAD detection method (used to define SEAD independent standard), denoted respectively rauto and rsemi_auto, are evaluated separately on the set of 12 pairs obtained from the same eyes on the same days. While the 3-D images are expected to differ due to the nature of the image acquisition process, the SEAD coronal plane footprints are expected to be fairly repeatable. This invariance should hold even if the position of the patient eye moves slightly between the repeated scans. The repeatability of each of these methods is defined as the complement to 1 of the L1 distance between the probability maps obtained for the first series of scans and the one obtained for the second series of scans. Note that, for the (binary) semi-automated segmentations, rsemi_auto represents the detection accuracy. The confidence interval for rauto and rsemi_auto, obtained from the average and the standard error of these accuracies across image pairs, are compared. The comparison between the repeatability of both methods gives us insight into which proportion of the variability between scans is explained by the imaging protocol (and thus affects both methods) and which one is specific to each method. If the repeatability of the automated method were to be significantly lower than the repeatability of defining the reference standard, it would mean that the reported automated texture-based characterization is less reproducible than manual annotation.
IV. Results
The intraretinal layer segmentation method was compared to the reference standard defined by two experts. Mean unsigned surface positioning errors are reported in Table I. The overall mean unsigned surface positioning error for all 11 detected surfaces was slightly higher than that obtained in the previously published six-layer segmentation method [9]. The reason is that surface 3, that is obscured in some OCT scans and was not segmented in [9], is segmented with a higher error than the other surfaces. The layer segmentation processing time was approximately 70 s per eye [28] running on one core of a standard PC at 2.4 GHz; up to 800 MB of RAM was used.
TABLE I.
Summary of Mean Unsigned Surface Positioning Errors (Average ± Standard Deviation In Micrometers)
| surface | 6-layer segmentation [9] | current 11-layer segmentation |
|---|---|---|
| 1 | 2.85 ± 0.32 | 2.70 ± 0.35 |
| 2 | 4.98 ± 1.24 | 6.89 ± 2.23 |
| 3 | 13.59 ± 2.01 | |
| 4 | 7.25 ± 1.10 | 4.98 ± 0.73 |
| 5 | 7.79 ± 0.74 | 7.45 ± 1.19 |
| 6 | 5.18 ± 0.82 | 5.87 ± 1.22 |
| 7 | 3.30 ± 1.60 | 3.13 ± 1.46 |
| 8 | 2.59 ± 0.57 | |
| 9 | 8.47 ± 2.29 | 5.37 ± 1.37 |
| 10 | 6.60 ± 2.97 | |
| 11 | 4.07 ± 0.93 | |
| overall | 5.69 ± 2.41 | 5.75 ± 1.37 |
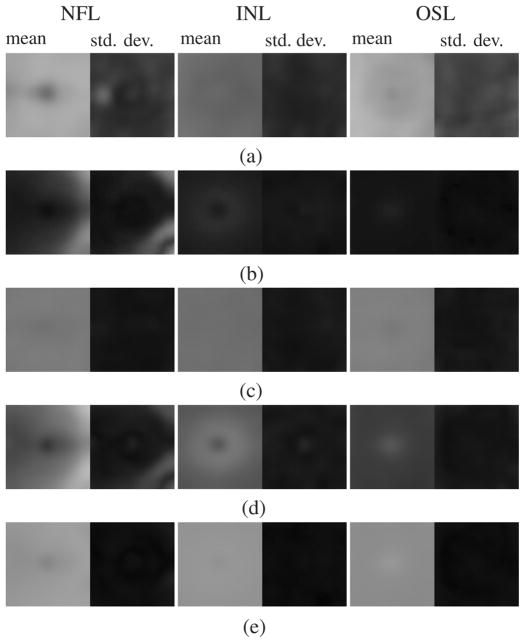
An example of a SEAD footprint detection is presented in Fig. 4. The performance of each computed feature for SEAD footprint detection is given in Table II. The performance of SEAD footprint detection, whether the features are directly classified or whether their deviations from the normal appearance of maculae are classified, is reported in Fig. 5 as a function of the training set size. The ROC of the five most frequently selected features is reported in Fig. 6. The normal appearance of maculae in the space of these features is illustrated in Fig. 7. The average total processing time to find the footprint of SEADs in an image, including the layer segmentation, is 83 s.
Fig. 4.
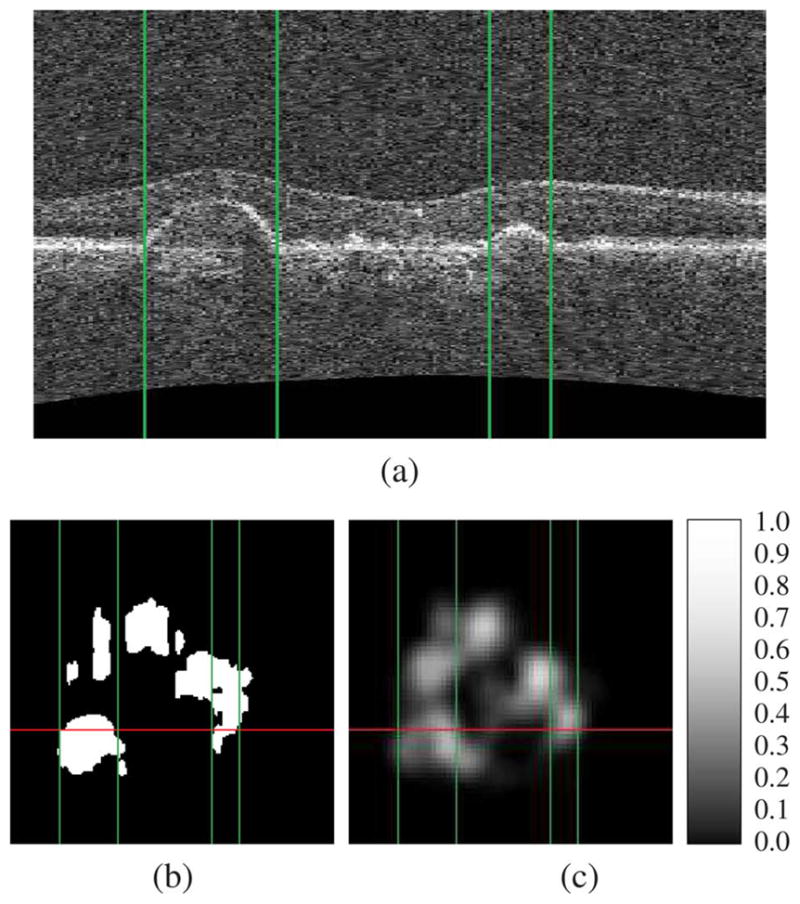
Example of SEAD footprint detection. Figure (a) presents an x — z slice running through SEADs in an SD-OCT volume. The expert standard for the footprint of these SEADs and the automatically generated SEAD footprint probability map, in the x — y plane, are presented in figures (b) and (c) respectively. Note the probability scale in panel (c). The projection of the x — z slice in the x — y plane is represented by a vertical line in figure (b) and (c). The location of the layer detachments observed in figure (a) are indicated by vertical lines in each panel.
TABLE II.
Performance of the Computed Features in Terms of Per-Patch Area Under the Receiver-Operating Characteristic Curve (Average ± Standard Deviation Across the Six Testing Sets)
| thickness | mean | 0.913±0.034 |
| standard deviation | 0.587±0.044 | |
| intensity | mean | 0.938±0.024 |
| variance | 0.908±0.024 | |
| skewness | 0.931±0.019 | |
| kurtosis | 0.880±0.037 | |
| entropy | 0.851±0.042 | |
| run length | short run emphasis | 0.821±0.042 |
| long run emphasis | 0.828±0.041 | |
| gray level non-uniformity | 0.906±0.038 | |
| run length non-uniformity | 0.918±0.032 | |
| run percentage | 0.831±0.033 | |
| co-occurrence matrix | angular second moment | 0.887±0.040 |
| correlation | 0.782±0.069 | |
| contrast | 0.901±0.024 | |
| entropy | 0.892±0.034 | |
| inertia | 0.935±0.024 | |
| inverse difference moment | 0.912±0.038 | |
| wavelet analysis | standard deviation (level 1) | 0.898±0.041 |
| standard deviation (level 2) | 0.867±0.044 | |
| kurtosis (level 1) | 0.836±0.032 | |
| kurtosis (level 2) | 0.724±0.036 | |
| fractal dimension | 0.729±0.058 |
Fig. 5.
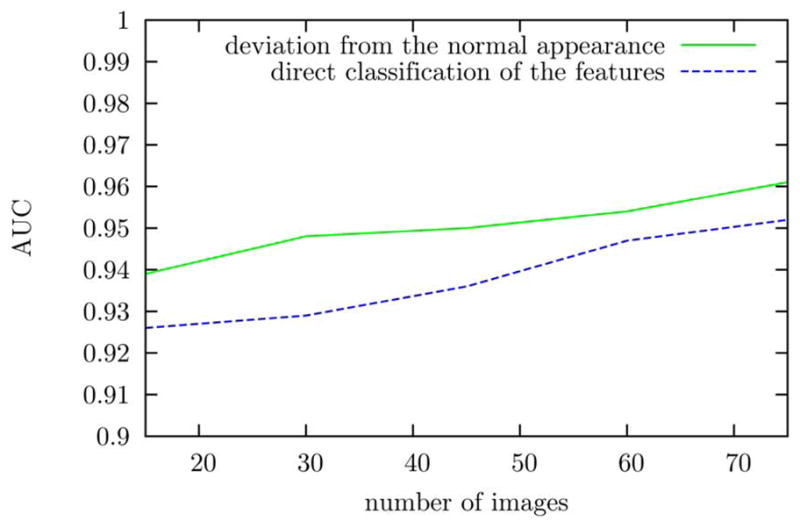
Performance of SEAD footprint detection using or not using the characterization of normal maculae as a function of the number of images in the training set.
Fig. 6.
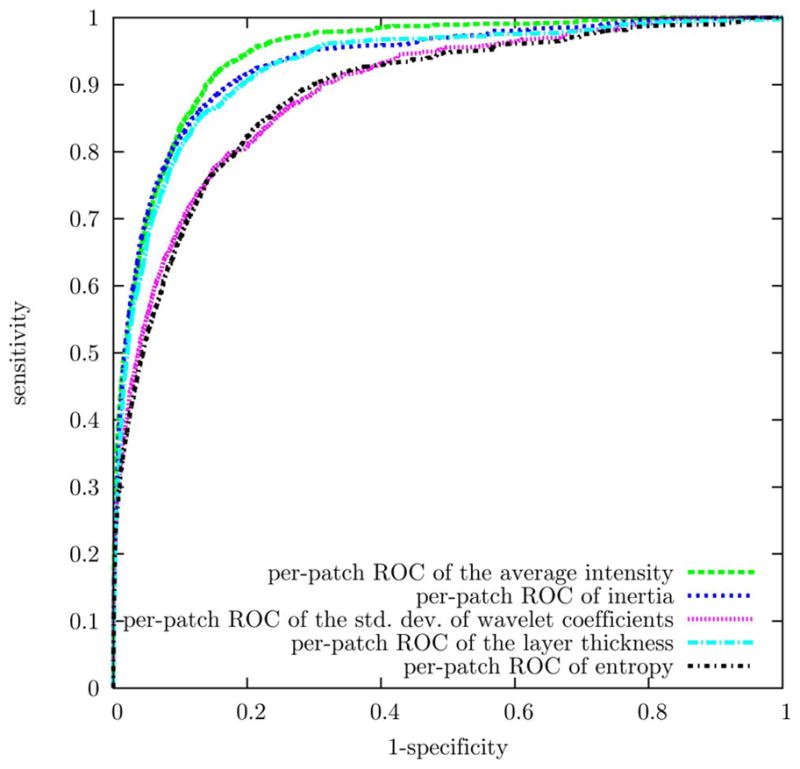
ROC of the most frequently selected features for SEAD footprint detection. These ROC curves were obtained by leave-one-eye-out cross validation.
Fig. 7.
Normal appearance of three intraretinal layers (NFL, INL, and OSL, see Fig. 2) in the feature space optimized for SEAD footprint detection. For each feature, a map of the average (standard deviation) of the feature values across the macula is displayed on the left (right). Inertia (b) is correlated with the thickness of the layer (d). The standard deviation of the wavelet coefficients (c) and entropy (e), on the other hand, are almost uniform across the macula in normal eyes.
The repeatability of the reported SEAD footprint detection approaches is illustrated in Fig. 8. The repeatability of our automated SEAD footprint detection is statistically the same (p = 0.401)as the repeatability of interactive expert-driven footprint definition by projecting the expert-defined 3-D SEAD regions [rauto = 0.963 (CI at the 95% confidence level [0.946;0.980]); rsemi_auto = 0.948 (CI = [0.921; 0.976])].
Finally, the influence of texture extraction resolution on the segmentation results (i.e., the influence of the size S of the patches, Section II-C) was evaluated and results are shown in Fig. 9. Note that changing the size of the patch changes the detector but it also changes the evaluation measure: consequently, even if the spatial pattern of the probabilities changes with resolution (as a result of changing the classifier), the per patch AUC does not necessarily change.
Fig. 9.
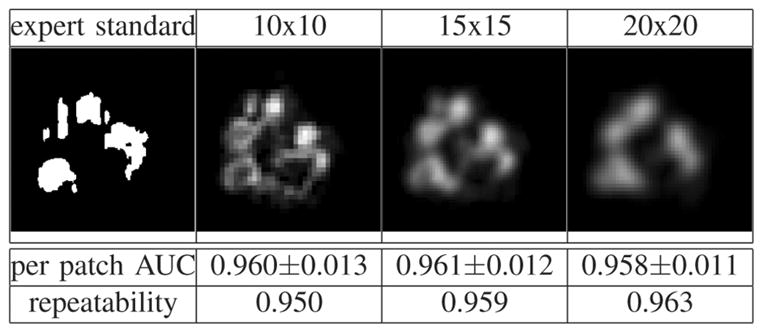
Influence of texture extraction resolution on the segmentation results [probability scale provided in Fig. 4(c)].
V. Discussion and Conclusion
We have presented in this paper a novel automated method for detection of the footprint of SEADs in SD-OCT scans from AMD patients. This method relies on the characterization of ten automatically segmented intraretinal layers by their thickness as well as by their 3-D textural features. The method utilizes a multiscale 3-D graph search approach to automatically segment 11 retinal surfaces defining 10 intraretinal layers from 3-D macula OCT scans. Since SEADs can appear anywhere within, between, or under these layers, their footprints were detected by classifying vertical, cross-layer, macular columns. A SEAD probability was measured for each macular column by assessing in each layer the local deviations from the normal appearance of maculae in the space of the most relevant features; the normal appearance of maculae was obtained from thirteen normal OCT scans. The reported approach was trained using a set of 78 SD-OCT volumes from 23 patients in a leave-one-eye-out fashion and evaluated against a human reference standard. To define the SEAD independent standard, the manual segmentation of the SEADs in the 3-D volumes was made possible by a novel semi-automated segmentation based on a graph-cut approach. While serving well for our purpose of independent standard definition, the interactive SEAD definition in 3-D remains tedious and time consuming, despite the semi-automated character of the process.
Good layer segmentation results were obtained and the performance of automated SEAD footprint detection based on 3-D texture and layer thickness is excellent. An area under the receiver-operating characteristic of 0.961±0.012 (average ± standard deviation across the six testing sets) was obtained for the classification of macular columns of using a 15 × 15 square base while varying a threshold of local SEAD probability. This performance is slightly higher than the classification of macular columns using a 10 × 10 or a 20 × 20 square base. The false positives observed on this dataset are caused by abnormal tissues other than SEADs such as vascular growths. In normal subjects, where there are no SEADs and thus no footprint, the highest SEAD probability is usually observed at the center of the macula. As can be seen in Fig. 2 representing a normal case, a low-probability SEAD-like region is usually detected between surfaces 8 and 9 at this location. However, the SEAD probability is lower than the probability threshold observed at the center of any SEAD in the dataset and no SEAD footprint is therefore detected. We can see from Fig. 5 that a higher detection performance can be achieved with a smaller number of training images if the SEAD probability in a macular column is derived from the local deviations of the relevant features against the normal appearance of maculae, instead of being derived from the relevant features themselves. This is to be expected because two columns from different areas of the macula can only be compared when compensating for the normal variations of their features across the macula. This implies that more training samples are required if the features are not normalized with respect to their deviations from the characterization of normal maculae.
A repeatability study conducted from a set of 12 pairs of scans obtained on the same day from the same eye reveals that the automated approach is at least as repeatable as the semi-automated definition of the human expert standard in 3-D followed by x – y projection (Fig. 8).
Further experiments suggested that the method is quite robust across OCT scanners from different manufacturers and certainly for the same model across OCT scanners from the same manufacturer (even across generations like 2-D time-domain OCT Stratus versus 3D spectral-domain OCT Zeiss Cirrus). As for the SEAD footprint finding method, should the proposed method be applied to another dataset obtained with a different OCT acquisition properties, it would be advisable to repeat the training process due to its reliance on k-NN, an example-based classifier.
Because SEADs are fluid-filled regions, two features were highly expected to be relevant: the thickness of the layers (due to the appearance of layer swelling) and the average intensity (the reflectance of fluids or fluid filled tissue being lower than “dry” macula tissues). This study reveals that several 3-D textural features compare favorably with these two features (Table II), for example the gray level nonuniformity and the run length nonuniformity, two run length analysis features, as well as the angular second moment, the contrast, the inertia or the inverse difference moment, and the four co-occurrence matrix analysis features. Combining the thickness of the layers and the average intensity with other features reduces the number of false positives, hence the increase of the per-column AUC after feature combination. The optimal set of features, that was identified by cross-validation, includes the best three features as measured independently: the average intensity, the average thickness of the layers and the inertia. It also includes two features with a lower performance: the standard deviation of high frequency wavelet coefficients and the entropy (co-occurrence matrix analysis). The reason why these features were most frequently selected instead of seemingly better features is that they are less correlated to the thickness of the layers, i.e., they bring more additional information to the combined set of features. This can be seen in Fig. 7. The normal distribution of the entropy and of the standard deviation of wavelet coefficients across the macula are much less correlated to the thickness of the layer than that of inertia. In fact, the normal distribution of these two features is almost invariant across the macula, which suggests that they better characterize the nature of the tissues, as opposed to inertia which better characterizes the shape and deformations. These properties are desirable to detect SEADs: 1) the appearance of a SEAD within a layer obviously modifies the tissue optical properties of the layer (the layer consists of normal tissues plus fluid) and 2) the surrounding tissues, which are included in the macular column vector that form the input for the classifier, are stretched.
One conclusion we can derive from this study is that although SD-OCT suffers from presence of noise—in particular laser speckle noise—it is still possible to extract useful 3-D textural information for clinical applications. It may even be possible to exploit the variance information to characterize tissues, as suggested by the inclusion of the standard deviation of high frequency wavelet coefficients in the optimal feature set.
The presented automated method may be applicable to clinical setting in its present state. The sum of the SEAD probabilities obtained for each macular column could be used as an estimate of SEAD volumes. Nevertheless, we plan to develop a method for determination of the true SEAD volume in future studies: the automatically detected SEAD footprints will be used to initialize the currently semi-automated SEAD segmentation method and the relevant 3-D textural indices identified in this study will be used to derive a fully automated 3-D SEAD segmentation method. Moreover, the methodology presented in this paper may be applied to the 3-D textural characterization of SD-OCT scans of the optic nerve head, for which automated layer segmentation methods were previously reported by our group, in order to improve the OCT-guided assessment of the optic nerve head.
Contributor Information
Gwénolé Quellec, Email: gwenole-quellec@uiowa.edu, Department of Ophthalmology and Visual Sciences and the Department of Biomedical Engineering, The University of Iowa, Iowa City, IA 52240 USA.
Kyungmoo Lee, Department of Electrical and Computer Engineering, The University of Iowa, Iowa City, IA 52242 USA.
Martin Dolejsi, Department of Electrical and Computer Engineering, The University of Iowa, Iowa City, IA 52242 USA.
Mona K. Garvin, Department of Electrical and Computer Engineering, The University of Iowa, Iowa City, IA 52242 USA.
Michael D. Abràmoff, Department of Ophthalmology and Visual Sciences and the Department of Electrical and Computer Engineering, The University of Iowa, Iowa City, IA 52240 USA.
Milan Sonka, Department of Electrical and Computer Engineering, the Department of Ophthalmology and Visual Sciences, and the Department of Radiation Oncology, The University of Iowa, Iowa City, IA 52240 USA.
References
- 1.Hee MR, Baumal CR, Puliafito CA, Duker JS, Reichel E, Wilkins JR, Coker JG, Schuman JS, Swanson EA, Fujimoto JG. Optical coherence tomography of age-related macular degeneration and choroidal neovascularization. Ophthalmology. 1996;103(8):1260–1270. doi: 10.1016/s0161-6420(96)30512-5. [DOI] [PubMed] [Google Scholar]
- 2.Ernst BJ, Barkmeier AJ, Akduman L. Optical coherence tomography-based intravitreal ranibizumab (lucentis) for neovascular age-related macular degeneration [in press] Int Ophthalmol. 2009 doi: 10.1007/s10792-009-9324-9. [DOI] [PubMed] [Google Scholar]
- 3.Keane PA, Chang KT, Liakopoulos S, Jivrajka RV, Walsh AC, Sadda SR. Effect of ranibizumab retreatment frequency on neurosensory retinal volume in neovascular AMD. Retina. 2009;29(5):592–600. doi: 10.1097/IAE.0b013e31819b17a5. [DOI] [PubMed] [Google Scholar]
- 4.Strouthidis NG, Yang H, Fortune B, Downs JC, Burgoyne CF. Detection of the optic nerve head neural canal opening within threedimensional histomorphometric and spectral domain optical coherence tomography data sets. Invest Ophthalmol Vis Sci. 2009;50:214–223. doi: 10.1167/iovs.08-2302. [DOI] [PMC free article] [PubMed] [Google Scholar]
- 5.Hee MR, Puliafito CA, Wong C, Duker JS, Reichel E, Rutledge B, Schuman JS, Swanson EA, Fujimoto JG. Quantitative assessment of macular edema with optical coherence tomography. Arch Ophthalmol. 1995;113(8):1019–1029. doi: 10.1001/archopht.1995.01100080071031. [DOI] [PubMed] [Google Scholar]
- 6.Drexler W, Fujimoto JG. State-of-the-art retinal optical coherence tomography. Progress Retinal Eye Res. 2008;27(1):45–88. doi: 10.1016/j.preteyeres.2007.07.005. [DOI] [PubMed] [Google Scholar]
- 7.Cukras C, Wang YD, Meyerle CB, Forooghian F, Chew EY, Wong WT. Optical coherence tomography-based decision making in exudative age-related macular degeneration: Comparison of time- vs spectral-domain devices. Eye. 2009 doi: 10.1038/eye.2009.211. [DOI] [PMC free article] [PubMed] [Google Scholar]
- 8.Garvin MK, Abràmoff MD, Kardon R, Russell SR, Xiaodong W, Sonka M. Intraretinal layer segmentation of macular optical coherence tomography images using optimal 3-d graph search. IEEE Trans Med Imag. 2008 Oct;27(10):1495–1505. doi: 10.1109/TMI.2008.923966. [DOI] [PMC free article] [PubMed] [Google Scholar]
- 9.Garvin MK, Abràmoff MD, Wu X, Russell SR, Burns TL, Sonka M. Automated 3-D intraretinal layer segmentation of macular spectral-domain optical coherence tomography images. IEEE Trans Med Imag. 2009 Sep;28(9):1436–1447. doi: 10.1109/TMI.2009.2016958. [DOI] [PMC free article] [PubMed] [Google Scholar]
- 10.Lee K, Niemeijer M, Garvin MK, Kwon YH, Sonka M, Abràmoff MD. Segmentation of the optic disc in 3D-OCT scans of the optic nerve head. IEEE Trans Med Imag. 2010 Jan;29(1):159–168. doi: 10.1109/TMI.2009.2031324. [DOI] [PMC free article] [PubMed] [Google Scholar]
- 11.Abràmoff MD, Lee K, Niemeijer M, Alward WL, Greenlee E, Garvin M, Sonka M, Kwon YH. Automated segmentation of the cup and rim from spectral domain OCT of the optic nerve head. Invest Ophthalmol Vis Sci. 2009 Dec;50(12):5778–5784. doi: 10.1167/iovs.09-3790. [DOI] [PMC free article] [PubMed] [Google Scholar]
- 12.van Dijk HW, Kok PH, Garvin M, Sonka M, Devries JH, Michels RP, van Velthoven ME, Schlingemann RO, Verbraak FD, Abràmoff MD. Selective loss of inner retinal layer thickness in type 1 diabetic patients with minimal diabetic retinopathy. Invest Ophthalmol Vis Sci. 2009;50(7):3404–3409. doi: 10.1167/iovs.08-3143. [DOI] [PMC free article] [PubMed] [Google Scholar]
- 13.Garvin MK, Sonka M, Kardon RH, Wu X, Kwon YH, Russell SR, Abràmoff MD. Three-dimensional analysis of SD OCT: Thickness assessment of six macular layers in normal subjects. Invest Ophthalmol Vis Sci. 2008 [Google Scholar]
- 14.Arch Ophthalmol. 9. Vol. 109. Macular Photocoagulation Study Group; 1991. Subfoveal neovascular lesions in age-related macular degeneration. guidelines for evaluation and treatment in the macular photocoagulation study; pp. 1242–1257. [PubMed] [Google Scholar]
- 15.Arch Ophthalmol. 7. Vol. 112. Macular Photocoagulation Study Group; 1994. Laser photocoagulation of subfoveal neovascular lesions of agerelated macular degeneration. Updated findings from two clinical trials; pp. 874–875. [DOI] [PubMed] [Google Scholar]
- 16.Lalwani GA, Rosenfeld PJ, Fung AE, Dubovy SR, Michels S, Feuer W, Davis JL, Flynn HW, Esquiabro M. A variable-dosing regimen with intravitreal ranibizumab for neovascular age-related macular degeneration: Year 2 of the PrONTO study. Am J Ophthalmol. 2009;148(1):1–3. doi: 10.1016/j.ajo.2009.01.024. [DOI] [PubMed] [Google Scholar]
- 17.Coscas F, Coscas G, Souied E, Tick S, Soubrane G. Optical coherence tomography identification of occult choroidal neovascularization in age-related macular degeneration. Am J Ophthalmol. 2007;(4):592–599. doi: 10.1016/j.ajo.2007.06.014. [DOI] [PubMed] [Google Scholar]
- 18.Fung AE, Lalwani GA, Rosenfeld PJ, Dubovy SR, Michels S, Feuer WJ, Puliafito CA, Davis JL, Flynn HW, Esquiabro M. An optical coherence tomography-guided, variable dosing regimen with intravitreal ranibizumab (Lucentis) for neovascular age-related macular degeneration. Am J Ophthalmol. 2007;143(4):566–583. doi: 10.1016/j.ajo.2007.01.028. [DOI] [PubMed] [Google Scholar]
- 19.Kashani AH, Keane PA, Dustin L, Walsh AC, Sadda SR. Quantitative subanalysis of cystoid spaces and outer nuclear layer using optical coherence tomography in age-related macular degeneration. Invest Ophthalmol Vis Sci. 2009;50(7):3366–3373. doi: 10.1167/iovs.08-2691. [DOI] [PMC free article] [PubMed] [Google Scholar]
- 20.Dadgostar H, Ventura AA, Chung JY, Sharma S, Kaiser PK. Evaluation of injection frequency and visual acuity outcomes for ranibizumab monotherapy in exudative age-related macular degeneration. Ophthalmology. 2009;116(9):1740–1747. doi: 10.1016/j.ophtha.2009.05.033. [DOI] [PubMed] [Google Scholar]
- 21.Fernández DC. Delineating fluid-filled region boundaries in optical coherence tomography images of the retina. IEEE Trans Med Imag. 2005 Aug;24(8):929–945. doi: 10.1109/TMI.2005.848655. [DOI] [PubMed] [Google Scholar]
- 22.Gossage KW, Tkaczyk TS, Rodriguez JJ, Barton JK. Texture analysis of optical coherence tomography images: Feasibility for tissue classification. J Biomed Opt. 2003 Jul;8(3):570–575. doi: 10.1117/1.1577575. [DOI] [PubMed] [Google Scholar]
- 23.Fleagle SR, Stanford W, Burns T, Skorton DJ. Feasibility of quantitative texture analysis of cardiac magnetic resonance imagery: Preliminary results. Proc SPIE Med Imag. 1994;2168:23–32. [Google Scholar]
- 24.Quellec G, Lamard M, Cazuguel G, Cochener B, Roux C. Adaptive non-separable wavelet transform via lifting and its application to content-based image retrieval. IEEE Trans Image Process. 2010 Jan;19(1):25–35. doi: 10.1109/TIP.2009.2030479. [DOI] [PubMed] [Google Scholar]
- 25.Xu Y, Sonka M, McLennan G, Guo J, Hoffman EA. MD-CTBased 3-D texture classification of emphysema and early smoking related lung pathologies. IEEE Trans Med Imag. 2006 Apr;25(4):464–475. doi: 10.1109/TMI.2006.870889. [DOI] [PubMed] [Google Scholar]
- 26.Gerth C, Zawadzki RJ, Werner JS, Héon E. Retinal microstructure in patients with efemp1 retinal dystrophy evaluated by Fourier domain OCT. Eye. 2009;23(2):480–483. doi: 10.1038/eye.2008.251. [DOI] [PMC free article] [PubMed] [Google Scholar]
- 27.Li K, Wu X, Chen DZ, Sonka M. Optimal surface segmentation in volumetric images—A graph-theoretic approach. IEEE Trans Pattern Anal Mach Intell. 2006 Jan;28(1):119–134. doi: 10.1109/TPAMI.2006.19. [DOI] [PMC free article] [PubMed] [Google Scholar]
- 28.Lee K. PhD dissertation. Univ. Iowa; Iowa City: 2009. Segmentations of the intraretinal surfaces, optic disc and retinal blood vessels in 3D-OCT scans. [Google Scholar]
- 29.Adler DC, Ko TH, Fujimoto JG. Speckle reduction in optical coherence tomography images by use of a spatially adaptive wavelet filter. Opt Lett. 2004;29(24):2878–2880. doi: 10.1364/ol.29.002878. [DOI] [PubMed] [Google Scholar]
- 30.Puvanathasan P, Bizheva K. Speckle noise reduction algorithm for optical coherence tomography based on interval type II fuzzy set. Opt Express. 2007;15(24):15 747–15 758. doi: 10.1364/oe.15.015747. [DOI] [PubMed] [Google Scholar]
- 31.Chitchian S, Fiddy MA, Fried NM. Denoising during optical coherence tomography of the prostate nerves via wavelet shrinkage using dual-tree complex wavelet transform. J Biomed Opt. 2009;14(1):014031. doi: 10.1117/1.3081543. [DOI] [PubMed] [Google Scholar]
- 32.Lingley-Papadopoulos CA, Loew MH, Zara JM. Wavelet analysis enables system-independent texture analysis of optical coherence tomography images. J Biomed Opt. 2009;14(4) doi: 10.1117/1.3171943. [DOI] [PubMed] [Google Scholar]
- 33.Gossage KW, Smith CM, Kanter EM, Hariri LP, Stone AL, Rodriguez JJ, Williams SK, Barton JK. Texture analysis of speckle in optical coherence tomography images of tissue phantoms. Phys Med Biol. 2006 Mar;51(6):1563–1575. doi: 10.1088/0031-9155/51/6/014. [DOI] [PubMed] [Google Scholar]
- 34.Kovacevic J, Sweldens W. Wavelet families of increasing order in arbitrary dimensions. IEEE Trans Image Process. 2000 Mar;9(3):480–496. doi: 10.1109/83.826784. [DOI] [PubMed] [Google Scholar]
- 35.Wouwer GV, Scheunders P, Dyck DV. Statistical texture characterization from discrete wavelet representations. IEEE Trans Image Process. 1999 Apr;8:592–598. doi: 10.1109/83.753747. [DOI] [PubMed] [Google Scholar]
- 36.Flandrin P. Wavelet analysis and synthesis of fractional Brownian motion. IEEE Trans Inf Theory. 1992 Mar;38(2):910–917. [Google Scholar]
- 37.Bajcsy R, Kovac`ic` S. Multiresolution elastic matching. Comput Vis, Graphics, Image Process. 1989;46(1):1–21. [Google Scholar]
- 38.Suzuki H, Yoshizaki K, Matsuo M, Kashio J. A supporting system for getting tomograms and screening with a computerized 3D brain atlas and a knowledge database. In: Ayache N, editor. Comput Vis, Virtual Reality Robotics Med. Berlin, Germany: Springer-Verlag; 1995. pp. 170–176. Lecture Notes in Computer Science. [Google Scholar]
- 39.Subsol G, Thirion JP, Ayache N. A general scheme for automatically building 3D morphometric anatomical atlases: Application to a skull atlas. Med Image Anal. 1995;2(1):37–60. doi: 10.1016/s1361-8415(01)80027-x. [DOI] [PubMed] [Google Scholar]
- 40.Zhang L, Hoffman EA, Reinhardt JM. Atlas-driven lung lobe segmentation in volumetric X-ray CT images. IEEE Trans Med Imag. 2006 Jan;25(1):1–16. doi: 10.1109/TMI.2005.859209. [DOI] [PubMed] [Google Scholar]
- 41.Isgum I, Staring M, Rutten A, Prokop M, Viergever MA, van Ginneken B. Multi-atlas-based segmentation with local decision fusion—Application to cardiac and aortic segmentation in CT scans. IEEE Trans Med Imag. 2009 Jul;28(7):1000–1010. doi: 10.1109/TMI.2008.2011480. [DOI] [PubMed] [Google Scholar]
- 42.Reinhardt JM, Lee S, Xu X, Abràmoff MD. Retina atlas mapping from color fundus images. presented at the ARVO 2009 Annu. Meeting; Ft. Lauderdale, FL. May 3–7, 2009; 2009. [Google Scholar]
- 43.Arya S, Mount DM. Approximate nearest neighbor queries in fixed dimensions. Proc ACM-SIAM Symp Discrete Algorithms. 1993:271–280. [Google Scholar]
- 44.Niemeijer M, van Ginneken B, Staal J, Suttorp-Schulten MSA, Abràmoff MD. Automatic detection of red lesions in digital color fundus photographs. IEEE Trans Med Imag. 2005 May;24(5):584–592. doi: 10.1109/TMI.2005.843738. [DOI] [PubMed] [Google Scholar]
- 45.Boykov Y, Jolly M-P. Interactive graph cuts for optimal boundary & region segmentation of objects in N-D images. Proc Int Conf Comput Vis (ICCV) 2001 Jul;1935–I:105–112. [Google Scholar]


