

Abstract
Differential response patterns to optimal antiviral therapy, peginterferon alpha plus ribavirin, are well documented in patients with chronic hepatitis C virus (HCV) infection. Among many factors that may affect therapeutic efficiency, HCV quasispecies (QS) characteristics have been a major focus of previous studies, yielding conflicting results. To obtain a comprehensive understanding of the role of HCV QS in antiviral therapy, we performed the largest-ever HCV QS analysis in 153 patients infected with HCV genotype 1 strains. A total of 4,314 viral clones spanning hypervarible region 1 were produced from these patients during the first 12 weeks of therapy, followed by detailed genetic analyses. Our data showed an exponential distribution pattern of intra-patient QS diversity in this study population in which most patients (63%) had small QS diversity with genetic distance (d) less than 0.2. The group of patients with genetic distance located in the decay region (d>0.53) had a significantly higher early virologic response (EVR) rate (89.5%), which contributed substantially to the overall association between EVR and increased baseline QS diversity. In addition, EVR was linked to a clustered evolutionary pattern in terms of QS dynamic changes.
Conclusion
EVR is associated with elevated HCV QS diversity and complexity, especially in patients with significantly higher HCV genetic heterogeneity.
Keywords: Hepatitis C virus, Quasispecies, Antiviral therapy
Introduction
Hepatitis C virus (HCV) infection is a major public health concern worldwide. Over 2.7 million Americans are chronically infected with HCV, which results in an estimated 10,000 deaths each year and is a leading indication for liver transplantation (1). Currently, optimal antiviral therapy of chronic hepatitis C with peginterferon alpha plus ribavirin cures up to 80% of patients infected with HCV genotypes 2 and 3. However, the same treatment regimen is effective in only about 50% of patients infected with HCV genotype 1 (2). It is thus important to be able to identify factor(s), either host or viral, which affect results of therapy as such information may be valuable in improving current antiviral strategy.
In this setting, HCV quasispecies (QS) characteristics have been a major focus of study in patients undergoing antiviral therapy. However, previous studies have generated conflicting data with regard to the role of HCV QS in the determination of therapeutic efficiency (see a recent review in ref. 3). Such results are to some extent not surprising since the responses to antiviral therapy represent a complex phenotype that is affected by multiple factors from both virus and host sides. The involvement of these factors certainly interferes with the data interpretation from HCV QS studies, especially when the study population is small. In addition, techniques used to assess HCV QS diversity may be another source for data discrepancy. The effect of mutations on gel mobility of a given DNA molecule is sometimes unpredictable (4). Thus, data from gel-based assays is not always consistent with the results from cloning/sequencing, which is thought to be a gold standard technique to assess viral diversity. In current study, we have performed a detailed QS analysis in 153 patients undergoing combination antiviral therapy (peginterferon alfa-2a plus ribavirin). Compared to many previous studies, the current project has several unique features, such as being the largest study population, with an exclusive focus on HCV genotype 1 and the application of large-scale cloning and sequencing techniques. These characteristics allow a thorough dissection of the potential effect of HCV QS during antiviral therapy.
Patients and Methods
Samples
This was an ancillary study of a large clinical trial that aimed to compare therapeutic efficiency of peginterferon alpha-2a and alpha-2b in treatment-naïve patients with chronic HCV infection (5). Of 380 patients enrolled in the trial, 189 patients were treated with peginterferon alpha-2a and are the subjects in present study. Patient recruitment was restricted to HCV genotype 1 (5). Serum samples were collected at multiple time points during the early phase of antiviral therapy, including baseline (w00), week 4 (w04), week 8 (w08) and week 12 (w12). De-identified specimens were shipped to Saint Louis University (SLU) and John Hopkins University (JHU) and stored at −80°C until use. For each patient, molecular cloning was planned for two serum samples, one at the baseline and the other at the latest time point during the early phase of antiviral therapy before week 12 with a minimum HCV viral load of more than 1000 copies per milliliter, approximately equal to 1111 IU/ml when HCV RNA level is quantified with Roche Amplicor HCV Monitor, v2.0 (lower limit of quantification, 600 IU/mL).
Molecular Cloning of HCV HVR1
A 442-bp fragment covering HCV HVR1 was amplified by Reverse transcription-PCR (RT-PCR), followed by gel purification and TA cloning. About 15 independent clones for each sample were sequenced. Detailed experimental procedures were provided in the Support Information.
Genetic Analysis
Raw sequences were edited with the programs ClustalW (6) and BioEdit (7) in which HCV H77 strain (AF009606) served as the reference sequence. After the removal of primer sequences, the target domain for genetic analyses is 399 bp in length. Nucleotide positions containing insertions or deletions within this domain were removed for the present analysis and will be analyzed separately for their potential influence on antiviral therapy. HCV QS nature was characterized by measuring both genetic complexity and genetic diversity. The definitions and measurement of these genetic parameters were outlined in the Supporting Information.
Phylogenetic analysis was used to verify HCV genotypes and/or subtypes and potential sequence clusterings corresponding to response patterns. We constructed two phylogenetic trees, one with all 4,314 clones (big tree) and the other with only 153 clones respectively representing the dominant HCV QS variant at the baseline from each patient (small tree). Both trees were computed using program MEGA 4 with Neighbor-Joining approach, using the maximum composite likelihood model. We also assumed a rate variation among sites with an experienced value of gamma parameter (α =0.5). Forty-five reference HCV sequences, representing different HCV genotypes and subtypes, were included.
Statistical Analysis
Values of genetic parameters from comparative analyses were tested for statistical significance using two-tailed Student’s t test. Categorical data from cross analyses were tested for statistical significance using the χ2 test with Yate’s correction or Fisher’s exact test. With regard to HCV QS diversity at baseline, we explored its potential distribution pattern in this study population (n=153). In doing so, one-sample Kolmogorov-Smirnov test was first used to test common distribution patterns. Next, a newly developed procedure was applied to see if the data fits a power-law or power-law-like distribution, such as exponential distribution, in which the given quantities are tightly clustered around their average values with much reduced probability far from the mean in a one-way direction (8). In this setting, the term “decay region” was used to denote the low-boundary phase of the distributions and the value at proposed low-bound point (χmin) on the curve was calculated (8). All statistical analyses were done with SPSS (version 13.0) except for the HCV QS distribution analysis that was run in MATLAB (http://www.mathworks.com).
Nucleotide Sequence Accession Numbers
A total of 3909 distinct HCV QS sequences generated in this study have been deposited in GenBank under accession numbers FJ688411 through FJ692319. The entire data set including 4313 sequences is available upon request.
Results
Experimental Performance and Sample Compilation
We had a 100% success rate for the amplification of a 442-bp target by using our protocol described above. This high success rate mainly resulted from our efforts to optimize PCR primers, including their positions and composition. In some samples with low viral loads near 1000 copies per milliliter (n=15, 5.7%), we found that it was necessary to increase the input amount of serum RNA for reverse transcription (RT). This was achieved by using 280 μl of serum, instead of regular 140 μl, for RNA extraction, followed by the elution into the same volume of Tris buffer (60 μl). Most experiments resulted in a single visible band with expected size on agarose gel. In the molecular cloning experiments, the positive rate of recombinant clones was approximately 95%.
For each patient, HCV QS profiles were generated at two time points, the baseline and the latest time point during the early phase of antiviral therapy (≤ week 12) with a minimum HCV viral load more than 1000 copies per milliliter. Based on this standard, we finally identified 110 patients with two time points and 43 patients with only one time point (baseline), which resulted in 263 serum samples to be studied. A total of 4,314 clones were generated and sequenced from these samples, an average 16.4 clones per sample. Among 153 patients, 104 (68%) achieved early virological response (EVR), defined as more than 2 log decrease of HCV RNA level at week 12 compared to the baseline (9). Potential differences between these two groups have been examined in terms of viral factors, including baseline viral load, HCV subtypes, QS diversity, complexity and dynamics.
Lack of Association among Viral Load, Subtypes and Early Response Patterns
The phylogenetic tree constructed with all 4,314 clones (big tree) displayed single patient-based clusterings, indicating the lack of HCV co-infection with different subtypes or strains. This observation further excluded any contamination during experimental performance. We verified HCV genotype/subtype for all patients through the phylogenetic analysis of 153 viral sequences representing dominant QS variant from each patient. Thus, 115 patients were infected with HCV genotype 1a and 38 with HCV genotype 1b (Figure 1). HCV genotype 1a isolates further formed three clusters, named subgroups 1, 2, and 3 (Figure 1). Among 109 patients with HCV subtypes based on Inno-LiPA HCV II Line Probe assay, 17 appeared to have been mistyped based on our phylogenetic analysis (Figure 1). Thus, Inno-LiPA HCV II Line Probe assay seems to have an error rate of HCV subtyping at 15.6%, consistent with a previous report (10). More interestingly, Inno-LiPA HCV II Line Probe assay mistyped 16 of 17 HCV 1a patients as HCV genotype 1b, suggesting the existence of an intrinsic bias to HCV genotype 1b.
Figure 1.
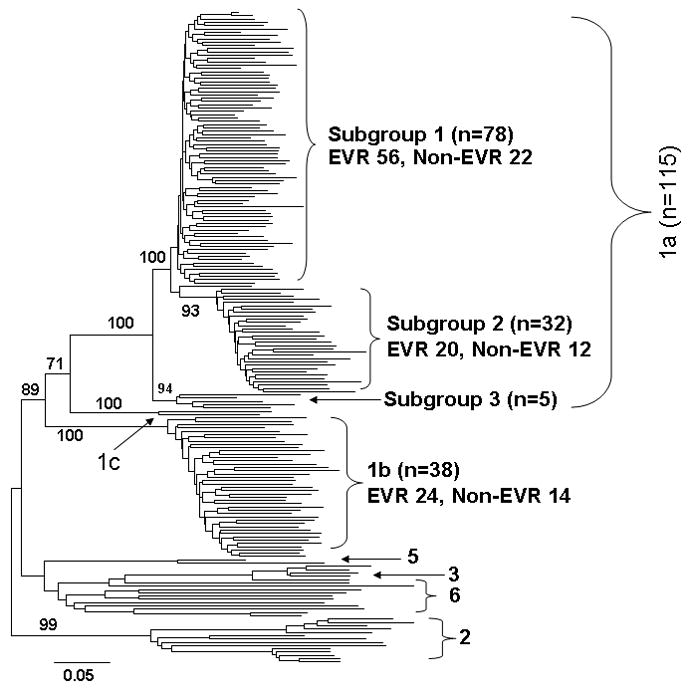
Neighbor-Joining tree of 153 dominant clones representing individual patients and 45 reference sequences from GenBank. Bootstrap test was done with 500 replicates and shown at major branches. Among 153 patients, 38 were infected with HCV genotype 1b and 115 were genotype 1a. The latter was further clustered into three subgroups with more than 90% bootstrap support. EVR, early virologic response.
There was no significant difference between HCV subtypes with regard to early response patterns, EVR vs. non-EVR, 1a, 76.9% vs. 23.1% and 1b, 71.4% vs. 28.6% (Figure 1). In the phylogenetic tree, HCV genotype 1a strains were further clustered into three subgroups, supported by bootstrap test (Figure 1). Again, no statistical significance was detected with respect to the relationship between HCV 1a subgroups and early response patterns in terms of current treatment regimen (Figure 1).
We also investigated the potential relationship and interactions between pretreatment HCV RNA levels and early response patterns, HCV genotypes and subgroups. As shown in Table 1, pretreatment HCV viral load was not associated with early virological response patterns (p=0.137), HCV genotypes (p=0.489) or HCV 1a subgroups (p=0.171).
Table 1.
The lack of correlation between HCV viral load at baseline and response patterns, HCV genotypes and HCV 1a subgroups.
| Response pattern | HCV subtype | HCV 1a subgroup | |||||
|---|---|---|---|---|---|---|---|
| EVR | Non-EVR | 1a | 1b | 1 | 2 | 3 | |
| Number | 104 | 49 | 115 | 38 | 78 | 32 | 5 |
| Viral Load* | 6.49 ± 0.46 | 6.41 ± 0.41 | 6.44 ± 0.48 | 6.55± 0.39 | 6.43 ± 0.39 | 6.44 ± 0.61 | 6.53 ± 0.39 |
| p value** | 0.366 | 0.194 | 0.887 | NP | |||
HCV viral load was determined by using Roche Amplicor HCV Monitor Test, v2.0 (Roche Diagnostics) and is expressed as average log10 values and stand derivation.
Two-tailed t test under the assumption of two-sample equal variance. NP, not performed.
Effect of HCV QS Diversity on Antiviral Therapy
We separated our amplified region into two domains, HVR1 (81 bp) and non-HVR1 (318 bp), to avoid possible masking of statistical significance due to apparently unequal nucleotide substitution rates between these two domains. Next, we performed the analyses at two levels, pretreatment genetic diversity and its early dynamic changes during antiviral therapy.
With regard to pretreatment genetic diversity, subjects with EVR had overall higher values than non-EVR group in the most of parameters measured. Thus for HVR1, d 0.253 vs. 0.1723; dS 0.0849 vs. 0.0810; dN 0.1451 vs. 0.1033 and for Non-HVR1, d 0.0333 vs. 0.0265; dS 0.0528 vs. 0.0528 and dN 0.0064 vs. 0.0051. However, only HVR1 dN reached statistical significance (p=0.039) (Figure 2).
Figure 2.
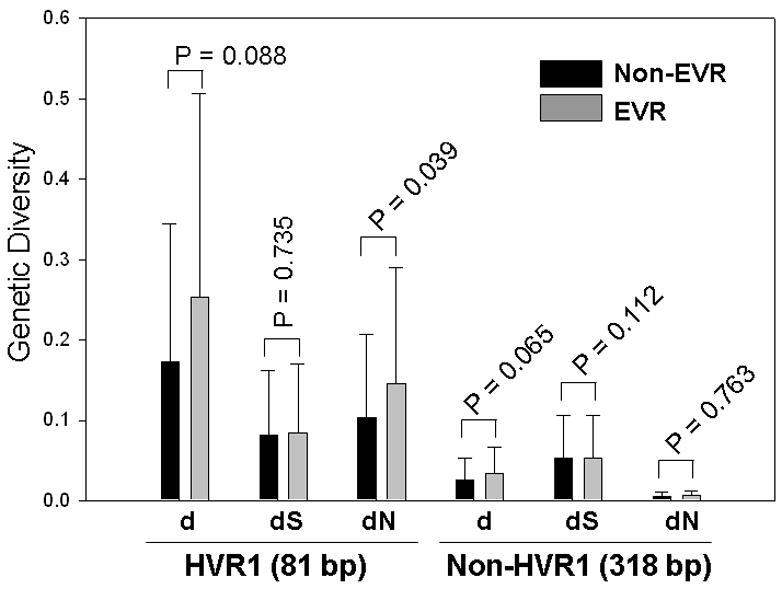
The correlation between early virologic response patterns (EVR or Non-EVR) and genetic diversity at the baseline. While EVR group showed a higher genetic diversity than Non-EVR group. The difference between two groups did not reach statistical significance (two-tailed t test) except for HVR1 dN, which indicated a higher pressure for the positive selection in the EVR group.
The criteria for sample selection identified 110 patients with serum samples to be cloned and sequenced at two time points, one at the baseline and the other at the latest time point during the early phase of antiviral therapy (≤ week 12) with a minimum HCV viral load more than 1000 copies per milliliter. Again, these patients were separated into two groups, EVR (n = 66) and Non-EVR (n = 44). We conducted two kinds of group-based analyses, the average change and net change of genetic diversity between two time points. Average change simply compares population-based genetic diversity without the consideration of sequence differences between two populations, which is reflected by the net change. In other words, the net change estimates the extent of “clustered evolution” in terms of its phylogenetic representation (11).
The average change in genetic diversity was calculated based on either HVR1 (81 bp) or non-HVR1 region (318 bp). The net change was determined with HVR1 only. Both EVR and non-EVR groups displayed a trend toward decreasing genetic diversity over time, shown as all positive values of genetic parameters. However, the average change of non-HVR1 dN increased in EVR group (Figure 3). Because the absolute values of dN change of non-HVR1 are actually very minimal in both EVR and non-EVR groups (0.0013 vs. 0.0018), such an increase may not be biologically significant. The EVR group had a more prominent decrease of genetic diversity over time than the non-EVR group (Figure 3). However, the difference between two groups was not statistically significant (Figure 3).
Figure 3.
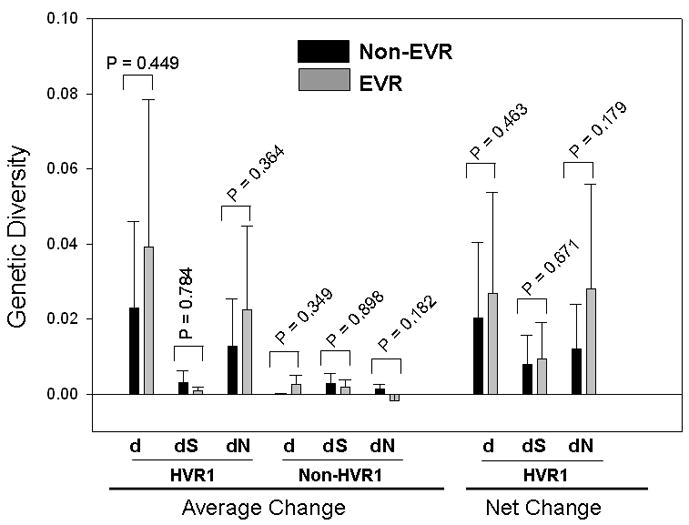
The correlation between early virologic response patterns (EVR or Non-EVR) and genetic diversity at the baseline. While EVR group showed a higher genetic diversity than Non-EVR group, the difference between two groups did not reach statistical significance (two-tailed t test) except for dN value in HVR1.
The net change of genetic diversity had similar patterns as the average change did. The EVR group was associated with more apparent decrease of net genetic diversity. Again, the difference between EVR and Non-EVR group was not supported statistically (Figure 3).
Genetic complexity was estimated by measuring average Shannon entropy in HVR1 domain. Like genetic diversity, EVR group had a higher pretreatment genetic complexity than Non-EVR group at either nucleotide or amino acid level (Figure 4). The latter reached statistical significance (p = 0.0499). The average change of genetic complexity was also higher in EVR group than that in Non-EVR group although this difference was not statistically supported (Figure 4).
Figure 4.
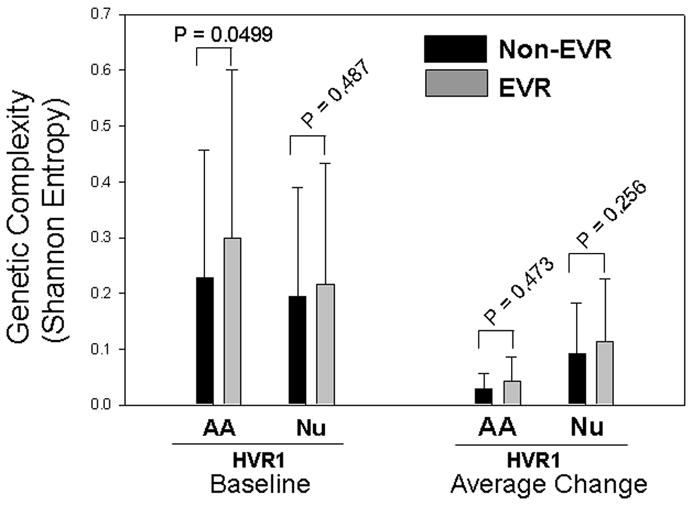
Comparisons of genetic complexity between EVR and Non-EVR groups. Pretreatment HCV genetic complexity (left side) and its average change over time (right side) were compared between two groups at wither amino acid or nucleotide level. AA, amino acid; Nu, nucleotide.
Distribution of QS Diversity in Patients Infected with HCV Genotype 1 Isolates
The current project, the largest-ever QS study yet to focus on HCV genotype 1, investigated possible distribution patterns of QS diversity. Using HVR1 genetic distance (d), we first plotted its histogram in this study population. The distribution patterns were subsequently estimated by one-sample Kolmogorov-Smirnov test. The data supported an exponential distribution (p=0.132) with the exclusion of normal (p<0.001), uniform (p<0.001) and Poisson (p<0.001) distributions (Figure 5). We further calculated the lower bound (χmin) using described formulas under the hypothesis of either continuous power-law or exponential distribution (8). The power-law distribution was not favored due to the short tail, only 15 patients located in the power-law region (χmin =0.58), which is too few to be meaningful. The χmin for exponential distribution was equal to 0.53, putting genetic distance from 19 patients in the decay region (Figure 5).
Figure 5.
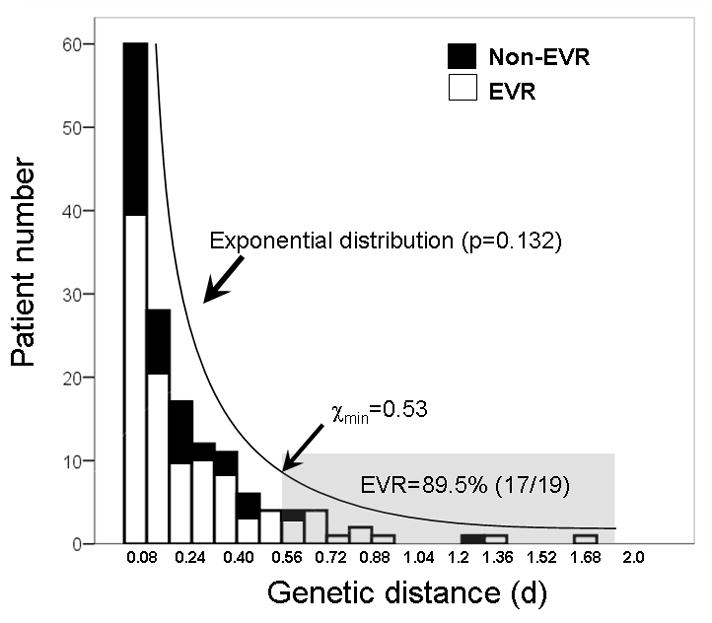
Histogram of baseline QS diversity in the study population. The number of patients at each category of genetic distance (d) based on HVR1 was calculated. The distribution of QS diversity in this study population fit an exponential distribution (p=0.132 by KS test) in which most patients (about 63%) had a small d value less than 0.2. The χmin, estimated using described formula in MATLAB, is about 0.53, which put genetic distance from 19 patients in the decay region (shaded area). This group of patients had a much higher EVR rate (89.5%) compared to the overall EVR rate (68%, p=0.032) or patients with genetic distance less than 0.53 (65%, p=0.016). KS test, One-sample Kolmogorov-Smirnov test.
Discussion
We have evaluated HCV QS heterogeneity at baseline and its dynamic changes during the early therapeutic period. In this type of study, sampling bias is often a concern due to the lack of normalization of entry HCV RNA amount used for RT-PCR (12). Thus, viral QS heterogeneity may be to some extent dependent on viral titers. However, under our experimental procedure and study protocol, we consider the potential for sampling bias to be minimal, and its role on our observations and conclusions unimportant. First, we previously failed to detect a statistical relationship between QS diversity and viral titers (13); Second, for a given viral region used to measure QS diversity, such as HVR1 in this study, QS diversity is maintained by sequencing an adequate number of clones, usually >10, and the use of fixed PCR primers (14, 15); Finally, we have focused on comparative HCV QS analyses between early virologic response (EVR) and non-EVR groups. There is no statistical difference with regard to their average HCV viral loads in both groups, which may further reduce the sampling bias assuming it exists. An additional limitation, by the nature of the PEAK study that only followed patients through the first 12 weeks of therapy, is the inability to correlate HCV QS heterogeneity with sustained virologic response (SVR). Rather, we have chosen to correlate it with EVR. The number of patients with rapid virologic response (RVR), defined as undetectable viral RNA at week 4, was only 11 patients (7.2%), making it difficult to analyze. Nonetheless, we actually didn’t find any viral factors analyzed in this study that were specifically associated with RVR (data not shown). Thus, we focused on the EVR rather than RVR. EVR is also a response pattern that appears to reflect intrinsic sensitivity of HCV to combination therapy. It has been reported that EVR is a very good predictor of SVR (16). Data interpretation from our study may have general applicability in terms of HCV antiviral therapy.
HCV genotype is a well-documented independent factor affecting the efficiency of antiviral therapy (2). The large size of this study population allows us to examine whether or not such an observation can be extended to HCV subtype level. Statistically, we have demonstrated that pretreatment HCV viral loads, HCV subtypes and HCV subgroups within HCV genotype 1a are not determinants of early response patterns. Previous studies suggest that a low baseline HCV viral load is an independent predictor to SVR (reviewed in ref. 17). In our study, EVR group even had a higher average viral load although the differences between groups were not statistically supported (Table 1). The discordance may be attributed to multiple factors, such as different therapeutic regimens, patient selection and various stages on disease progress (18, 19). Alternatively, it may simply suggest that pre-treatment HCV viral load is not an independent factor to predict therapeutic efficiency.
An important finding came from our QS analysis. Due to known differences in mutation frequency between HVR1 and non-HVR1 domains, our analysis focused on the HVR1. EVR was associated with increased baseline QS diversity, shown as higher values of genetic diversity and complexity. Especially, dN reached statistical significance (p=0.039). The dN reflects the strength of evolutionary selection that is frequently interpreted as immune pressure (20). Since HVR1 contains putative B and T cell epitopes (21, 22), our observation suggests a role of pretreatment immune status in the determination of early virological response patterns. Compared with previous studies, it should be emphasized that our conclusion is more solid in terms of statistical power given the large number of patients studied. Additionally, two aspects of HCV QS dynamics have been assessed, including genetic diversity/complexity (average change) and sequence diversification (net change). In the former aspect, both EVR and Non-EVR groups display a general trend of reduced genetic diversity and complexity after the start of antiviral therapy. Such a trend seems more apparent in EVR group. Given the fact of higher pretreatment genetic diversity or complexity in EVR group, this trend may be only the reflection of the elimination of drug-sensitive HCV quasispecies variants. However, this explanation cannot be applied to the sequence diversification (net change) in which a similar trend has been featured. Thus, consistent with previous reports, HCV QS diversification is more likely associated with early response patterns (11).
By taking the advantage of this largest-ever HCV QS study, we explored potential distribution patterns of intra-patient HCV QS diversity at the population level. In contrast to viral load that displayed a typical normal (Gaussian) distribution among 153 patients we studied (data not shown), the QS diversity showed a best fit to an exponential distribution (Figure 5) (23). This finding has several important implications. First, the exponential distribution of QS diversity may explain long-existing controversies with regard to the role of QS diversity in HCV antiviral therapy (11, 24–40). While the overall EVR rate in this study population is about 68%, the group of patients with HVR1 genetic distance beyond the low bound (χmin=0.53) has a significantly higher EVR rate (89.5%, p=0.032) (Figure 5). In fact, when taking out the patient group with large QS diversity (d>0.53), the statistical significance of dN values was lost in terms of its association with the EVR (EVR, 0.106 versus Non-EVR, 0.092, p=0.194). Thus, assuming a potential role of QS diversity in the antiviral therapy, we can conclude that such a role may become dominant only in patients with large QS diversity (d>0.53). This conclusion was also true in the similar analysis using dN values (data not shown). Since the QS diversity in most patients, as measured by genetic distance (d), is less than 0.53 (Figure 5), intrinsic uncertainty is actually accompanied with any HCV genetic studies to explore the role of QS diversity in the antiviral therapy, especially when the study population size is small. For example, in our previous study, there is only one patient to be confirmed with genetic distance large than 0.53 among 29 patients studied (36).
Second, since the introduction of QS theory into virology, most viral genetic studies simply use this term to describe viral genome heterogeneity. Its original definition is largely ignored (41, 42). According to this theory, all viral variants in infected individuals form a network and act as a unit in response to internal or external interference, such as antiviral therapy. In this study, we have found that the EVR is associated with high QS diversity. Such an observation is not easily understood with classical population biology because high QS diversity indicates an increased possibility to contain drug-resistant viral variants. In this setting, QS theory may provide a plausible explanation by treating the entire viral population as an acting unit presumably in a status of the self-organized criticality (SOC), which is a prevailing hypothesis to explain many complex phenomena in nature, including exponential distribution (43). Consequently, high QS diversity may imply a critical status in which HCV reaches its maximum capability to maintain the QS network. Such a status, as assumed by SOC hypothesis, would be extremely sensitive to any external stimulus, such as antiviral therapy, resulting in the collapse of the entire QS network (virus extinction). Thus our data provide indirect evidence for the support of QS theory in virology and the SOC hypothesis should be an important addition to this theory.
Third, the formation of QS diversity results from the complicated interaction between virus and host. The exponential distribution of QS diversity suggests the lack of an ideal genetic distance that may favor HCV infection. In other words, the QS nature is not necessarily the only prerequisite for HCV to establish or maintain its persistent infection. Indeed, most RNA viruses, such as dengue and West Nile virus, share the QS nature (44, 45). However, only a few of them result in a persistent infection in human.
Finally, our data showed the large variability of HCV QS diversity in infected patients. With the fact of a considerable relatedness between the EVR and high HCV QS diversity, the modulation of HCV QS diversity may represent a novel strategy for antiviral therapy. The underlying mechanism responsible for the formation of high QS diversity in HCV patients therefore warrants further investigation.
Supplementary Material
Acknowledgments
Financial Support
This work was supported by Roche, USA and NIH grants R01 DK80711 (to XF) and R21 AI076834 (to AMD).
We thank Aaron Clauset (Santa Fe Institute) for his assistance on statistical analysis.
Nonstandard abbreviations
- HCV
hepatitis C virus
- QS
quasispecies
- HVR1
hypervariable region 1
- EVR
early virologic response
- SVR
sustained virologic response
- SOC
self-organized criticality
References
- 1.National Institutes of Health. NIH Consensus Development Conference Statement: Management of hepatitis C. Hepatology. 2002;36 (Suppl 1):S3–20. [Google Scholar]
- 2.Feld JJ, Hoofnagle JH. Mechanism of action of interferon and ribavirin in treatment of hepatitis C. Nature. 2005;436:967–972. doi: 10.1038/nature04082. [DOI] [PubMed] [Google Scholar]
- 3.Wohnsland A, Hofmann WP, Sarrazin C. Viral determinants of resistance to treatment in patients with hepatitis C. Clin Microbiol Rev. 2007;20:23–38. doi: 10.1128/CMR.00010-06. [DOI] [PMC free article] [PubMed] [Google Scholar]
- 4.Upchurch DA, Shankarappa R, Mullins JI. Position and degree of mismatches and the mobility of DNA heteroduplexes. Nucleic Acids Res. 2000;28:E69. doi: 10.1093/nar/28.12.e69. [DOI] [PMC free article] [PubMed] [Google Scholar]
- 5.Di Bisceglie AM, Ghalib RH, Hamzeh FM, Rustgi VK. Early virologic response after peginterferon alpha-2a plus ribavirin or peginterferon alpha-2b plus ribavirin treatment in patients with chronic hepatitis C. J Viral Hepatitis. 2007;14:721–729. doi: 10.1111/j.1365-2893.2007.00862.x. [DOI] [PubMed] [Google Scholar]
- 6.Higgins DG, Sharp PM. CLUSTAL: a package for performing multiple sequence alignment on a microcomputer. Gene. 1988;73:237–244. doi: 10.1016/0378-1119(88)90330-7. [DOI] [PubMed] [Google Scholar]
- 7.Hall TA. BioEdit:a user-friendly biological sequence alignment editor and analysis program for Windows 95/98/NT. Nucleic Acids Symp Ser. 1999;41:95–98. [Google Scholar]
- 8.Clauset A, Shalizi CR, Newman MEJ. Power-law distributions in empirical data. :0706.1062. E-print 2007; arXiv. [Google Scholar]
- 9.Di Bisceglie AM, Fan X, Chambers T, Strinko J. Pharmacokinetics, pharmacodynamics, and hepatitis C viral kinetics during antiviral therapy: the null responder. J Med Virol. 2006;78:446–451. doi: 10.1002/jmv.20560. [DOI] [PubMed] [Google Scholar]
- 10.Ross RS, Viazov S, Roggendorf M. Genotyping of hepatitis C virus isolates by a new line probe assay using sequence information from both the 5′untranslated and the core regions. J Virol Meth. 2007;143:153–160. doi: 10.1016/j.jviromet.2007.03.006. [DOI] [PubMed] [Google Scholar]
- 11.Abbate I, Lo Iacono O, Di Stefano R, Cappiello G, Girardi E, Longo R, et al. HVR-1 quasispecies modifications occur early and are correlated to initial but not sustained response in HCV-infected patients treated with pegylated- or standard-interferon and ribavirin. J Hepatol. 2004;40:831–836. doi: 10.1016/j.jhep.2004.01.019. [DOI] [PubMed] [Google Scholar]
- 12.Shan-Lu Liu SL, Rodrigo AG, Shankarappa R, Learn GH, Hsu L, Davidov O, et al. HIV Quasispecies and Resampling. Science. 1996;273:413–417. doi: 10.1126/science.273.5274.415. [DOI] [PubMed] [Google Scholar]
- 13.Fan X, Solomon H, Poulos JE, Neuschwander-Tetri BA, Di Bisceglie AM. Comparison of genetic heterogeneity of hepatitis C viral RNA in liver tissue and serum. Am J Gastroenterol. 1999;94:1347–1354. doi: 10.1111/j.1572-0241.1999.01085.x. [DOI] [PubMed] [Google Scholar]
- 14.Fan X, Lyra AC, Tan D, Xu Y, Di Bisceglie AM. Differential amplication of hypervariable region 1 of hepatitis C virus by partially mismatched primers. Biochem Biophy Res Communi. 2001;284:694–697. doi: 10.1006/bbrc.2001.5019. [DOI] [PubMed] [Google Scholar]
- 15.Torres-Puente M, Bracho MA, Jimenez N, Garcia-Robles I, Moya A, Gonzalez-Candelas F. Sampling and repeatability in the evaluation of hepatitis C virus genetic variability. J Gen Virol. 1003;84:2343–50. doi: 10.1099/vir.0.19273-0. [DOI] [PubMed] [Google Scholar]
- 16.Ferenci P, Fried M, Shiffman M, Smith C, Marinos G, Gonçales F, et al. Predicting sustained virological responses in chronic hepatitis C patients treated with peginterferon alfa-2a (40KD)/ribavirin. J Hepatol. 2005;43:425–433. doi: 10.1016/j.jhep.2005.04.009. [DOI] [PubMed] [Google Scholar]
- 17.Mihm U, Herrmann E, Sarrazin C, Zeuzem S. Review article: predicting response in hepatitis C virus therapy. Aliment Pharm Therap. 2006;23:1043–1054. doi: 10.1111/j.1365-2036.2006.02863.x. [DOI] [PubMed] [Google Scholar]
- 18.Manns MP, McHutchison JG, Gordon SC, Rustgi VK, Shiffman M, Reindollar R, et al. Peginterferon alfa-2b plus ribavirin compared with interferon alfa-2b plus ribavirin for initial treatment of chronic hepatitis C: a randomised trial. Lancet. 2001;358:958–965. doi: 10.1016/s0140-6736(01)06102-5. [DOI] [PubMed] [Google Scholar]
- 19.Shiffman ML, Di Bisceglie AM, Lindsay KL, Morishima C, Wright EC, Everson GT, et al. Peginterferon Alfa-2a and ribavirin in patients with chronic hepatitis C who have failed prior treatment. Gastroenterology. 2004;126:1015–1023. doi: 10.1053/j.gastro.2004.01.014. [DOI] [PubMed] [Google Scholar]
- 20.Nei M. Phylogenetic analysis in molecular evolutionary genetics. Ann Rev Genet. 1996;30:371–403. doi: 10.1146/annurev.genet.30.1.371. [DOI] [PubMed] [Google Scholar]
- 21.Mondelli MU, Cerino A, Meola A, Nicosia A. Variability or conservation of hepatitis C virus hypervariable region 1? Implications for immune responses. J Bioscience. 2003;28:305–310. doi: 10.1007/BF02970149. [DOI] [PubMed] [Google Scholar]
- 22.Mondelli MU, Cerino A, Segagni L, Meola A, Cividini A, Silini E, et al. Hypervariable region 1 of hepatitis C virus: immunological decoy or biologically relevant domain? Antivir Res. 2001;52:153–159. doi: 10.1016/s0166-3542(01)00180-2. [DOI] [PubMed] [Google Scholar]
- 23.Bak P. How Nature Works: The science of self-organized criticality. Springer-Verlag; New York: 1999. pp. 1–31. [Google Scholar]
- 24.Gonzalez-Peralta RP, Qian K, She JY, Davis GL, Ohno T, Mizokami M, et al. Clinical implications of viral quasispecies heterogeneity in chronic hepatitis C. J Med Virol. 1996;49:242–247. doi: 10.1002/(SICI)1096-9071(199607)49:3<242::AID-JMV14>3.0.CO;2-E. [DOI] [PubMed] [Google Scholar]
- 25.Hino K, Yamaguchi Y, Fujiwara D, Katoh Y, Korenaga M, Okazaki M, et al. Hepatitis C virus quasispecies and response to interferon therapy in patients with chronic hepatitis C: a prospective study. J Viral Hepat. 2000;7:36–42. doi: 10.1046/j.1365-2893.2000.00196.x. [DOI] [PubMed] [Google Scholar]
- 26.Kanazawa Y, Hayashi N, Mita E, Li T, Hagiwara H, Kasahara A, Fusamoto H, et al. Influence of viral quasispecies on effectiveness of interferon therapy in chronic hepatitis C patients. Hepatology. 1994;20:1121–1130. [PubMed] [Google Scholar]
- 27.Koizumi K, Enomoto N, Kurosaki M, Murakami T, Izumi N, Marumo F, et al. Diversity of quasispecies in various disease stages of chronic hepatitis C virus infection and its significance in interferon treatment. Hepatology. 1995;22:30–35. [PubMed] [Google Scholar]
- 28.Moribe T, Hayashi N, Kanazawa Y, Mita E, Fusamoto H, Negi M, et al. Hepatitis C viral complexity detected by single-strand conformation polymorphism and response to interferon therapy. Gastroenterology. 1995;108:789–795. doi: 10.1016/0016-5085(95)90452-2. [DOI] [PubMed] [Google Scholar]
- 29.Nagasaka A, Hige S, Tsunematsu I, Yoshida J, Sasaki Y, Matsushima T, et al. Changes in hepatitis C virus quasispecies and density populations in patients before and after interferon therapy. J Med Virol. 1996;50:214–220. doi: 10.1002/(SICI)1096-9071(199611)50:3<214::AID-JMV2>3.0.CO;2-C. [DOI] [PubMed] [Google Scholar]
- 30.Okada S, Akahane Y, Suzuki H, Okamoto H, Mishiro S. The degree of variability in the amino terminal region of the E2/NS1 protein of hepatitis C virus correlates with responsiveness to interferon therapy in viremic patients. Hepatology. 1992;16:619–624. doi: 10.1002/hep.1840160302. [DOI] [PubMed] [Google Scholar]
- 31.Shindo M, Hamada K, Koya S, Arai K, Sokawa Y, Okuno T. The clinical significance of changes in genetic heterogeneity of the hypervariable region 1 in chronic hepatitis C with interferon therapy. Hepatology. 1996;24:1018–1023. doi: 10.1053/jhep.1996.v24.pm0008903369. [DOI] [PubMed] [Google Scholar]
- 32.Le Guen B, Squadrito G, Nalpas B, Berthelot P, Pol S, Brechot C. Hepatitis C virus genome complexity correlates with response to interferon therapy: a study in French patients with chronic hepatitis C. Hepatology. 1997;25:1250–1254. doi: 10.1002/hep.510250531. [DOI] [PubMed] [Google Scholar]
- 33.Lopez-Labrador FX, Ampurdanes S, Gimenez-Barcons M, Guilera M, Costa J, Jimenez MT, et al. Relationship of the genomic complexity of hepatitis C virus with liver disease severity and response to interferon in patients with chronic HCV genotype 1b infection. Hepatology. 1999;29:897–903. doi: 10.1002/hep.510290306. [DOI] [PubMed] [Google Scholar]
- 34.Nakazawa T, Kato N, Ohkoshi S, Shibuya A, Shimotohno K. Characterization of the 5′ noncoding and structural region of the hepatitis C virus genome from patients with non-A, non-B hepatitis responding differently to interferon treatment. J Hepatol. 1994;20:623–629. doi: 10.1016/s0168-8278(05)80350-2. [DOI] [PubMed] [Google Scholar]
- 35.Sandres K, Dubois M, Pasquier C, Payen JL, Alric L, Duffaut M, et al. Genetic heterogeneity of hypervariable region 1 of the hepatitis C virus (HCV) genome and sensitivity of HCV to alpha interferon therapy. J Virol. 2000;74:661–668. doi: 10.1128/jvi.74.2.661-668.2000. [DOI] [PMC free article] [PubMed] [Google Scholar]
- 36.Chambers TJ, Fan X, Droll DA, Hembrador E, Slater T, Nickells MW, et al. Quasispecies heterogeneity within the E1/E2 region as a pretreatment variable during pegylated interferon therapy of chronic hepatitis C virus infection. J Virol. 2005;79:3071–3083. doi: 10.1128/JVI.79.5.3071-3083.2005. [DOI] [PMC free article] [PubMed] [Google Scholar]
- 37.Farci P, Strazzera R, Alter HJ, Farci S, Degioannis D, Coiana A, et al. Early changes in hepatitis C viral quasispecies during interferon therapy predict the therapeutic outcome. Proc Natl Acad Sci USA. 2002;99:3081–3086. doi: 10.1073/pnas.052712599. [DOI] [PMC free article] [PubMed] [Google Scholar]
- 38.Sarrazin C, Bruckner M, Herrmann E, Rüster B, Bruch K, Roth WK, et al. Quasispecies heterogeneity of the carboxy-terminal part of the E2 gene including the PePHD and sensitivity of hepatitis C virus 1b isolates to antiviral therapy. Virology. 2001;289:150–163. doi: 10.1006/viro.2001.1092. [DOI] [PubMed] [Google Scholar]
- 39.Torres-Puente M, Cuevas JM, Jimenez-Hernandez N, Bracho MA, Garcia-Robles I, Wrobel B, et al. Genetic variability in hepatitis C virus and its role in antiviral treatment response. J Viral Hepatitis. 2008;15:188–199. doi: 10.1111/j.1365-2893.2007.00929.x. [DOI] [PubMed] [Google Scholar]
- 40.Morishima C, Polyak SJ, Ray R, Doherty MC, Di Bisceglie AM, Malet PF, et al. Hepatitis C Virus-Specific Immune Responses and Quasi-Species Variability at Baseline Are Associated with Nonresponse to Antiviral Therapy during Advanced Hepatitis C. J Infect Dis. 2006;193:931–940. doi: 10.1086/500952. [DOI] [PubMed] [Google Scholar]
- 41.Domingo E. Quasispecies theory in virology. J Virol. 2002;76:463–465. doi: 10.1128/JVI.76.1.463-465.2002. [DOI] [PMC free article] [PubMed] [Google Scholar]
- 42.Biebricher CK, Eigen M. What is a quasispecies? Curr Top Microbiol. 2006;299:1–31. doi: 10.1007/3-540-26397-7_1. [DOI] [PubMed] [Google Scholar]
- 43.Bak P, Tang C, Wiesenfeld K. Self-organized criticality. Phys Rev. 1998;38:364–374. doi: 10.1103/physreva.38.364. [DOI] [PubMed] [Google Scholar]
- 44.Wang WK, Lin SR, Lee CM, King CC, Chang SC. Dengue type 3 virus in plasma is a population of closely related genomes: quasispecies. J Virol. 2002;76:4662–4665. doi: 10.1128/JVI.76.9.4662-4665.2002. [DOI] [PMC free article] [PubMed] [Google Scholar]
- 45.Jerzak G, Bernard KA, Kramer LD, Ebel GD. Genetic variation in West Nile virus from naturally infected mosquitoes and birds suggests quasispecies structure and strong purifying selection. J Gen Virol. 2005;86:2175–83. doi: 10.1099/vir.0.81015-0. [DOI] [PMC free article] [PubMed] [Google Scholar]
Associated Data
This section collects any data citations, data availability statements, or supplementary materials included in this article.