Abstract
C57BL/6 inbred strains of mice are widely used in knockout and transgenic research. To evaluate the loss-of-function and gain-of-function effects of the gene of interest, animal behaviors are often examined. However, an issue of C57BL/6 substrains that is not always appreciated is that behaviors are known to be strongly influenced by genetic background. To investigate the behavioral characteristics of C57BL/6 substrains, we subjected C57BL/6J, C57BL/6N, and C57BL/6C mice to a behavior test battery. We performed both a regular scale analysis, in which experimental conditions were tightly controlled, and large-scale analysis from large number of behavioral data that we have collected so far through the comprehensive behavioral test battery applied to 700–2,200 mice in total. Significant differences among the substrains were found in the results of various behavioral tests, including the open field, rotarod, elevated plus maze, prepulse inhibition, Porsolt forced swim, and spatial working memory version of the eight-arm radial maze. Our results show a divergence of behavioral performance in C57BL/6 substrains, which suggest that small genetic differences may have a great influence on behavioral phenotypes. Thus, the genetic background of different substrains should be carefully chosen, equated, and considered in the interpretation of mutant behavioral phenotypes.
Keywords: inbred strain, C57BL/6, mouse, behavior
Introduction
Remarkable advances in molecular genetics have provided powerful tools to investigate the relationships between genes and behaviors in mice. Investigation of the behavioral phenotypes of genetically engineered mice has contributed to an understanding of the molecular mechanisms of complex behaviors, such as circadian rhythm, anxiety, motor functions, and learning and memory, and to establish animal models of neuropsychiatric disorders (Takahashi et al., 1994; Bucan and Abel, 2002; Takao et al., 2008; Yamasaki et al., 2008; Matsuo et al., 2009; Nakatani et al., 2009). However, the phenotypes of mutant mice are strongly influenced by genetic background, including flanking alleles, as well as the targeted genes. Therefore, appropriate control for genetic background is essential for adequate experimental design and the proper interpretation of data (Gerlai, 1996; Crawley et al., 1997; Crusio et al., 2009).
Of the many inbred strains, C57BL/6 is the most commonly used background strain for genetically engineered mice. C57BL/6 has several substrains, such as C57BL/6J, C57BL/6NCrlCrlj (C57BL/6N), and C57Bl/6CrSlc (C57BL/6C). The C57BL/6J was developed by Little in 1921, after crossing the female N.57 with the male N.52, and is the most widely used inbred strain. C57BL/6N was separated from C57BL/6J at generation F32 in 1951, and is maintained at the National Institute of Health (NIH) (Bailey, 1978). Several SNP differences have been identified that distinguish C57BL/6J from C57BL/6N (Bothe et al., 2004; Tsang et al., 2005; Mekada et al., 2009). C57BL/6C mice were initially received from the National Cancer Institute of the NIH to the Institute of Medical Science, University of Tokyo, Japan in 1972. They were transferred to Japan SLC, Inc in 1975 and maintained for a couple of decades. Genetic analysis using SNP markers confirmed that C57BL/6C is a C57BL/6N substrain (Mekada et al., 2009). Phenotypic differences between C57BL/6J and C57BL/6N have been reported in alcohol preference, fear conditioning, and sensorimotor functions (Blum et al., 1982; Radulovic et al., 1998; Stiedl et al., 1999; Khisti et al., 2006; Bryant et al., 2008; Mulligan et al., 2008). However, differences in the comprehensive behavioral profiles among the three substrains have not been investigated.
In order to investigate the behavioral differences of C57BL/6 substrains, we subjected C57BL/6J, C57BL/6N and C57BL/6C mice to a comprehensive behavioral test battery. Our behavioral test battery includes general health, rotarod, hot plate, open field, light/dark transition, elevated plus maze, social interaction, prepulse inhibition, Porsolt forced swim, and eight-arm radial maze tests. In addition, we performed a large-scale analysis using behavioral data obtained from more than 5,000 mice with mutant and wild-type with various genetic backgrounds that we have collected so far through a systematic phenotyping (Aiba et al., 2007; Takao et al., 2007). Our results demonstrate significant behavioral differences in the open field, rotarod, elevated plus maze, prepulse inhibition, Porsolt forced swim, and spatial working memory version of the eight-arm radial maze tests among the closely related inbred substrains.
Materials and Methods
Animals and experimental design
For regular scale analysis, C57BL/6J and C57BL/6NCrlCrlj (C57BL/6N) were obtained form Charles River Laboratories, Japan, Inc. C57BL/6J mice were directly transported from JAX by Charles River Laboratories, Japan, Inc. C57Bl/6CrSlc (C57BL/6C) was obtained from Japan SLC, Inc. They were bred, reared, and maintained at the identical vivarium environment in Kyoto University. For large-scale analysis, behavioral data of control wild-type C57BL/6 male mice that we have collected from the comprehensive behavioral analysis of more than 70 strains of genetically engineered mice were used. The mouse strains which were used for generating these mutant mice vary, and thus we have a large-scale behavioral data of control wild-type mice of different C57BL/6 substrains. Basically we did not exclude any behavioral data except for some specific cases in which the animals fell down from the arms in the elevated plus maze test, or the movies were not recorded due to some technical problems. For the subjects used for large-scale analysis, more than 80% of the mice used were backcrossed at least six times (and more than 95% of the mice used were backcrossed at least five times) with either C57BL/6J, C57BL/6N, or C57BL/6C mice. For the large-scale analysis, C57BL/6N includes C57BL/6NCrl and C57BL/6NTac. For the subjects used for large-scale analysis, the exact entity of “C57BL/6J” (JAX C57BL/6J or C57BL/6J maintained in Japan) is not clear. They were housed in a room with a 12-h light/dark cycle (lights on at 7:00 a.m.) with access to food (CRF-1, Oriental Yeast Co., Ltd.) and water ad libitum on sterilized PaperClean Bedding (Japan SLC). Behavioral testing was performed between 9:00 a.m. and 6:00 p.m. For regular scale analysis, 3.6%, 38.2%, and 58.2% of the mice were housed in 2, 3, and 4 animals per cage, respectively. For large-scale analysis, 7.4%, 2.3%, 5.9%, 76.7%, 7.1%, and 0.5% of the mice were housed in 1, 2, 3, 4, 5, 6 or more animals per cage, respectively. For regular scale analysis, the mice were tested in the following order; wire hang/grip strength test, light/dark transition test, open field test, elevated plus maze test, hot plate, social interaction test, rotarod test, prepulse inhibition test, Porsolt forced swim test, and eight-arm radial maze test. The interval between tests was at least 24 h. More than 70% of the mice used for the large-scale analysis were subjected to the test battery in exactly the same order as performed in the regular scale analysis. For the rest of the mice, behavioral tests were performed in the same order although some tests were omitted from the battery. Raw data of the behavioral test examined, the date on which each experiment was done, and the age of the mice at the time of the experiment are disclosed in the mouse phenotype database1. After the tests, all apparatus was cleaned with super hypochlorous water to prevent a bias due to olfactory cues. All behavioral testing procedures were approved by the Animal Care and Use Committee of Kyoto University Graduate School of Medicine.
Neuromuscular strength
Neuromuscular strength was tested with the grip strength and wire hang tests. A grip strength meter (O'Hara & Co., Tokyo, Japan) was used to assess forelimb grip strength. Mice were lifted and held by their tail so that their forepaws could grasp a wire grid. The mice were then gently pulled backward by the tail with their posture parallel to the surface of the table until they released the grid. The peak force applied by the forelimbs of the mouse was recorded in Newtons (N). Each mouse was tested three times, and the greatest measured value was used for statistical analysis. In the wire hang test, the mouse was placed on a wire mesh that was then inverted and waved gently, so that the mouse gripped the wire. Latency to fall was recorded, with a 60-s cut-off time.
Hot plate test
The hot plate test was used to evaluate sensitivity to a painful stimulus. Mice were placed on a 55.0 (±0.3)°C hot plate (Columbus Instruments), and latency to the first hind-paw response was recorded. The hind-paw response was defined as either a foot shake or a paw lick.
Rotarod test
The rotarod test, using an accelerating rotarod (UGO Basile Accelerating Rotarod), was performed by placing mice on rotating drums (3 cm diameter) and measuring the time each animal was able to maintain its balance on the rod. The speed of the rotarod accelerated from 4 to 40 rpm over a 5-min period.
Light/dark transition test
Light/dark transition test was conducted as previously described (Takao and Miyakawa, 2006). The apparatus used for the light/dark transition test consisted of a cage (21 cm × 42 cm × 25 cm) divided into two sections of equal size by a partition containing a door (O'Hara & Co., Tokyo, Japan). One chamber was brightly illuminated (390 lux), whereas the other chamber was dark (2 lux). Mice were placed into the dark side and allowed to move freely between the two chambers with the door open for 10 min. The total number of transitions between chambers, time spent in each side, first latency to enter the light side and distance traveled were recorded automatically.
Open field test
Each mouse was placed in the center of the open field apparatus (40 cm × 40 cm × 30 cm; Accuscan Instruments, Columbus, OH, USA). Total distance traveled (in cm), vertical activity (rearing measured by counting the number of photobeam interruptions), time spent in the center, and the beam-break counts for stereotyped behaviors were recorded. Data were collected for 120 min.
Elevated plus maze test
Elevated plus maze test was conducted as previously described (Komada et al., 2008). The elevated plus maze (O'Hara & Co., Tokyo, Japan) consisted of two open arms (25 cm × 5 cm) and two enclosed arms of the same size, with 15 cm high transparent walls. The arms and central square were made of white plastic plates and were elevated to a height of 55 cm above the floor. To minimize the likelihood of animals falling from the apparatus, 3 mm high plastic ledges were provided for the open arms. Arms of the same type were arranged at opposite sides to each other. Each mouse was placed in the central square of the maze (5 cm × 5 cm), facing one of the closed arms. The level of lighting in the room was 100 lux. Mouse behavior was recorded during a 10-min test period. The number of entries into, and the time spent in the open and enclosed arms, were recorded. For data analysis, we used the following four measures: the percentage of entries into the open arms, the time spent in the open arms (s), the number of total entries, and total distance traveled (cm). Data acquisition and analysis were performed automatically using Image EP software.
Social interaction test in a novel environment
Social interaction test was conducted as previously described (Miyakawa et al., 2003). Two mice of identical genotypes that were previously housed in different cages, were placed into a box together (40 cm × 40 cm × 30 cm) and allowed to explore freely for 10 min. Social behavior was monitored by a CCD camera. Analysis was performed automatically using Image SI software. The total duration of contacts, the number of contacts, the number of active contacts, mean duration per contact, and total distance traveled were measured. The number of active contacts was defined as follows. Images were captured at one frame per second, and the distance traveled between two successive frames was calculated for each mouse.
Startle response/prepulse inhibition tests
A startle reflex measurement system (O'Hara & Co., Tokyo, Japan) was used to measure startle response and prepulse inhibition. A test session began by placing a mouse in a plastic cylinder where it was left undisturbed for 10 min. White noise (40 ms) was used as the startle stimulus for all trial types. The startle response was recorded for 140 ms (measuring the response every 1 ms) starting with the onset of the prepulse stimulus. The background noise level in each chamber was 70 dB. The peak startle amplitude recorded during the 140 ms sampling window was used as the dependent variable. A test session consisted of six trial types (i.e., two types for startle stimulus only trials, and four types for prepulse inhibition trials). The intensity of the startle stimulus was 110 or 120 dB. The prepulse sound was presented 100 ms before the startle stimulus, and its intensity was 74 or 78 dB. Four combinations of prepulse and startle stimuli were used (74–110, 78–110, 74–120, and 78–120 dB). Six blocks of the six trial types were presented in pseudorandom order such that each trial type was presented once within a block. The average inter-trial interval was 15 s (range 10–20 s).
Porsolt forced swim test
The apparatus consisted of four Plexiglas cylinders (20 cm height × 10 cm diameter). The cylinders were filled with water (23°C), up to a height of 7.5 cm. Mice were placed in the cylinders, and the immobility and the distance traveled were recorded over a 10-min test period. Images were captured at one frame per second. For each pair of successive frames, the amount of area (pixels) within which the mouse moved was measured. When the amount of area was below a certain threshold, mouse behavior was judged as “immobile.” When the amount of area equaled or exceeded the threshold, the mouse was considered as “moving.” The optimal threshold by which to judge was determined by adjusting it to the amount of immobility measured by human observation. Immobility lasting for less than a 2 s was not included in the analysis. Data acquisition and analysis were performed automatically, using Image J based original program ImagePS software (see “Image Analysis”).
Eight-arm radial maze test
Fully-automated eight-arm radial maze apparatuses (O'Hara & Co., Tokyo, Japan) were used. The floor of the maze was made of white plastic, and the wall (25 cm high) consisted of transparent plastic. Each arm (9 cm × 40 cm) radiated from an octagonal central starting platform (perimeter 12 cm × 8 cm) like the spokes of a wheel. Identical food wells (1.4 cm deep and 1.4 cm in diameter) with pellet sensors were placed at the distal end of each arm. The pellet sensors were able to automatically record pellet intake by the mice. The maze was elevated 75 cm above the floor and placed in a dimly-lit room with several extra-maze cues. During the experiment, the maze was maintained in a constant orientation. One week before pretraining, animals were deprived of food until their body weight was reduced to 80–85% of the initial level. Pretraining started on the eighth day. Each mouse was placed in the central starting platform and allowed to explore and consume food pellets scattered on the whole maze for a 30-min period (one session per mouse). After completion of the initial pretraining, mice received further pretraining to take a food pellet from each food well after being placed at the distal end of each arm. A trial was finished after the mouse consumed the pellet. This was repeated eight times, using eight different arms, for each mouse. After these pretraining trials, actual maze acquisition trials were performed. In the spatial working memory task of the eight-arm radial maze, all eight arms were baited with food pellets. Mice were placed on the central platform and allowed to obtain all eight pellets within 25 min. A trial was terminated immediately after all eight pellets were consumed or 25 min had elapsed. An “arm visit” was defined as traveling more than 5 cm from the central platform. The mice were confined at the center platform for 5 s after each arm choice. The animals went through one trial per day. For each trial, arm choice, latency to obtain all pellets, distance traveled, number of different arms chosen within the first eight choices, the number of arm revisited, and omission errors were automatically recorded.
Image analysis
The applications used for the behavioral studies (Image LD, Image EP, Image RM, Image SI) were based on the public domain NIH Image program (developed at the U.S. National Institutes of Health and available on the Internet at http://rsb.info.nih.gov/nih-image/) and ImageJ program2, which were modified for each test by Tsuyoshi Miyakawa (available through O'Hara & Co., Tokyo, Japan).
Statistical analysis
Statistical analysis was conducted using StatView (SAS Institute, Cary, NC, USA). Data were analyzed by one-way ANOVA, or repeated measures ANOVA, unless noted otherwise. Post hoc analysis were performed on all ANOVAs found to be significant. Values in graphs are expressed as mean ± SEM. Effect sizes were calculated according to the Hedges’ g (Hedges, 1981).
Results
Physical characteristics and neurological screen
Male mice (B6J: n = 13, B6N: n = 21, B6C: n = 21) that were 12 weeks old at the beginning of the behavioral studies were used for the experiments. The condition of the animals was highly controlled. They were bred, reared and maintained at the same laboratory environment, and tested at the same time by the same experimenter to avoid environmental confounding factors as much as possible.
We also performed a large-scale analysis using collected data from the comprehensive behavioral test batteries in our laboratory. We have been collecting behavioral data of more than 100 strains of genetically engineered mice systematically (Takao et al., 2007). The background mouse strains that were used for generating these mutant mice vary, and thus, we have a large amount of behavioral data of control wild-type mice of different C57BL/6 substrains. The large-scale analysis is statistically useful for validating data, although the breeding environment and experimental conditions were not necessarily identical.
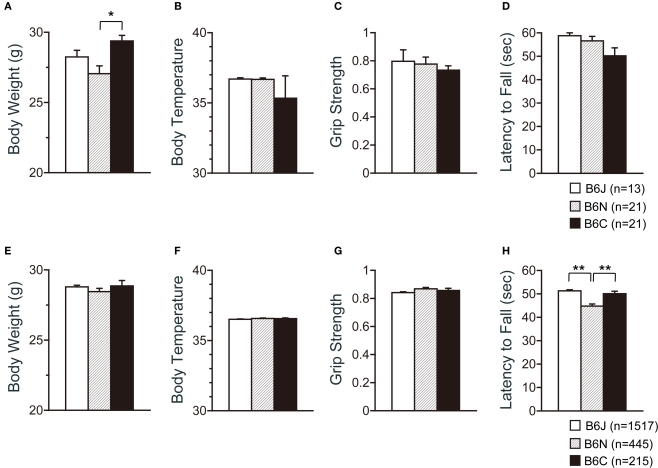
For the large-scale analysis, behavior tests were started at the age of 107.702 ± 2.875 (C57BL/6J), 106,393 ± 2.543 (C57BL/6N), and 112.177 ± 2.875 (C57BL/6C) days old. The C57BL/6C mice weighed approximately 10% more than C57BL/6N mice (Figure 1A; p = 0.0007). There were no significant effects of substrain on body temperature (Figure 1B) and neuromuscular strength (grip strength and wire hang tests) (Figures 1C,D).
Figure 1.
Physical characteristics of C57BL/6 substrains. (A–D) Regular scale analysis. (E–H) Large-scale analysis. (A,E) Body weight. (B,F) Body temperature. (C,G) Grip strength test. (D,H) Wire hang test. *p < 0.001, **p < 0.0001. Error bars indicate SEM.
According to the large-scale analysis data, significant differences were not observed in body weight, body temperature, and grip strength among the substrains (Figures 1E–G), while significant differences were detected in the wire hang test (Figure 1H; F2,2179 = 26.277, p < 0.0001). Effect sizes for each behavioral measure are listed on Table 1.
Table 1.
The list of effect size for each behavioral test.
| Measure | Effect size (J–N) | Effect size (J–C) | ||
|---|---|---|---|---|
| Regular | Large | Regular | Large | |
| Body weight | –0.53 | –0.07 | 0.64 | 0.01 |
| Body temperature | –0.06 | 0.08 | –0.24 | 0.06 |
| Grip strength | –0.08 | 0.12 | –0.30 | 0.06 |
| Wire hang | –0.30 | –0.18 | –0.68 | –0.02 |
| Hot plate | 0.04 | 0.38 | 0.03 | 0.32 |
| Rotarod | –0.80 | –0.79 | –0.65 | –0.34 |
| OF (total distance) | –0.97 | –0.34 | –0.71 | –0.53 |
| OF (vertical activity) | –0.92 | –0.31 | 0.00 | –0.08 |
| OF (center time) | –0.83 | –0.29 | –0.05 | –0.26 |
| OF (stereotypic counts) | –1.00 | –0.14 | –0.31 | –0.32 |
| LD (distance traveled_light) | –0.63 | –0.18 | –0.68 | –0.75 |
| LD (distance traveled_dark) | –0.31 | –0.29 | –0.77 | –1.03 |
| LD (transition) | –0.09 | –0.06 | –0.61 | –0.63 |
| LD (latency to light) | 0.04 | 0.12 | 0.51 | 0.71 |
| LD (stay time in light) | –0.16 | 0.04 | –0.33 | –0.41 |
| EP (distance traveled) | –0.58 | –0.17 | –0.09 | –0.48 |
| EP (number of entries) | –0.40 | –0.22 | –0.05 | –0.57 |
| EP (entries into open arms) | –1.09 | –0.84 | –0.74 | –0.63 |
| EP (time on open arms) | –0.67 | –0.56 | –0.95 | –0.49 |
| EP (time on center) | 0.45 | 0.11 | 0.17 | –0.30 |
| SI (distance traveled) | –0.86 | –0.14 | –0.47 | –0.31 |
| SI (number of contacts) | –1.28 | –0.37 | –0.42 | –0.11 |
| SI (total duration of contacts) | –0.53 | –0.14 | –0.13 | 0.19 |
| SI (mean duration/contact) | 0.80 | 0.08 | 0.13 | 0.19 |
| PPI (startle amplitude_110 dB) | –1.23 | –0.57 | –0.33 | –0.04 |
| PPl (startle amplitude_120 dB) | –0.75 | –0.42 | –0.14 | 0.39 |
| PPI (110–74 dB) | 0.36 | 0.43 | –0.55 | –0.21 |
| PPI (110–78 dB) | 1.03 | 0.38 | –0.63 | –0.41 |
| PPI (120–74 dB) | 0.59 | 0.38 | 0.11 | –0.14 |
| PPI (120–78 dB) | 0.98 | 0.53 | –0.54 | –0.32 |
| PS (immobility_trial1) | 0.49 | 0.37 | 0.00 | 0.39 |
| PS (immobility_trial2) | 0.66 | 0.24 | –0.01 | 0.23 |
| PS (distance traveled_trial1) | –0.96 | –0.23 | –0.49 | –0.30 |
| PS (distance traveled_trial2) | –0.99 | –0.23 | –0.23 | –0.22 |
| RM (different arm choices in first 8 entries) | –0.44 | –0.25 | –0.21 | –0 06 |
| RM (total number of revisiting) | –0.04 | –0.01 | 0.01 | –0.20 |
| RM (latency) | 1.93 | 0.71 | 1.19 | 0.62 |
Regular, regular scale analysis; large, large-scale analysis; OF, open field; LD, light/dark transition; EP, elevated plus; SI, social interaction; PPI, prepulse inhibition; PS, porsolt; RM, radial maze.
Sensorimotor function tests
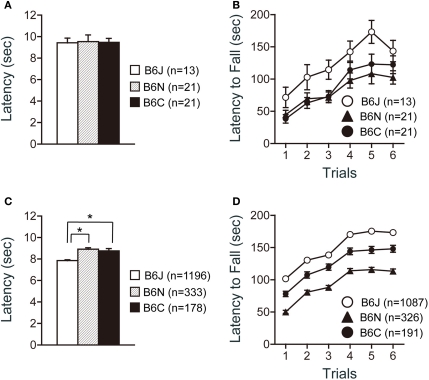
There were no significant effects of substrain on pain sensitivity (hot plate test) (Figure 2A). There were significant effects of substrain (Figure 2B; F2,52 = 4.358, p = 0.0178) and trial (Figure 2B; F5,260 = 39.928, p < 0.0001) on motor coordination and balance as assessed by the rotarod test. C57BL/6J mice showed significantly longer latencies to fall than C57BL/6N and C57BL/6C mice in the test (p = 0.0065, and p = 0.0202, respectively).
Figure 2.
Sensorimotor function tests of C57BL/6 substrains. (A,B) Regular scale analysis. (C,D) Large-scale analysis. (A,C) Hot plate test. C57BL/6J showed the shortest latencies in the large-scale analysis. (B,D) Rotarod test. C57BL/6J mice showed the longest latencies to fall. *p < 0.0001. Error bars indicate SEM.
Large-scale analysis data revealed a significant difference in the hot plate test among the substrains (Figure 2C; F2, 1704 = 23.379, p < 0.0001). C57BL/6J showed significantly shorter latencies than either C57BL/6N or C57BL/6C mice (p < 0.0001, and p < 0.0001, respectively). Significant differences were also found in the rotarod test among the substrains (Figure 2D; F2,1601 = 132.731, p < 0.0001). C57BL/6J mice showed significantly longer latencies to fall than C57BL/6C mice (p < 0.0001), and C57BL/6C mice showed significantly longer latencies to fall than C57BL/6N (p < 0.0001).
Open field test
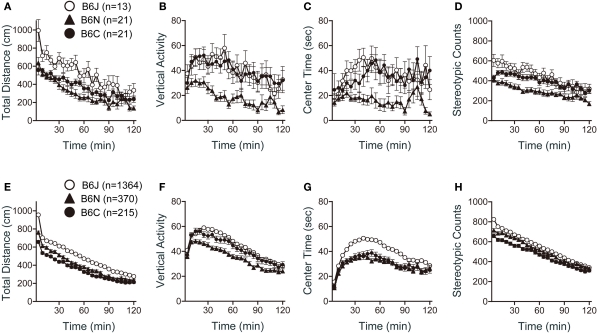
Significant differences among strains were obtained in all indices of the open field test. There were significant effects of substrain on total distance (Figure 3A; F2,52 = 9.850, p = 0.0002), vertical activity (Figure 3B; F2,52 = 6.546, p = 0.0029), center time (Figure 3C; F2,52 = 5.436, p = 0.0072), and stereotypic counts (Figure 3D; F2,52 = 9.464, p = 0.0003). C57BL/6J mice traveled a significantly longer distance than C57BL/6N and C57BL/6C mice (Figure 3A; p < 0.0001, and p = 0.0039, respectively). C57BL/6N exhibited the lowest vertical activity [Figure 3B; J > N (p = 0.0062), C > N (p = 0.0020)], spent the shortest time in center part of the open field [Figure 3C; J > N (p = 0.0088), C > N (p = 0.0060)], and showed the fewest number of stereotypic counts [Figure 3D; J > N (p = 0.0002), C > N (p = 0.0023)] among the three substrains.
Figure 3.
Open field test of C57BL/6 substrains. (A–D) Regular scale analysis. (E–H) Large-scale analysis. (A,E) Total locomotion distance traveled. C57BL/6J mice traveled the longest distance. (B,F) Count of vertical activity. C57BL/6N exhibited the lowest vertical activity. (C,G) Time spent in the center of the compartment. (D,H) Count of stereotypic behavior. Error bars indicate SEM.
Large-scale analysis also revealed significant effects of substrain in all indices of the open field test (Figures 3E–H). C57BL/6J mice traveled a significantly longer distance than C57BL/6N and C57BL/6C [Figure 3E; J > N (p < 0.0001), J > C (p < 0.0011)]. C57BL/6N exhibited the lowest vertical activity [Figure 3F; J > N (p < 0.0001), C > N (p = 0.0060)]. C57BL/6J spent a longer time in center part of the open field than C57BL/6N and C57BL/6C (Figure 3G; p < 0.0001, and p < 0.0001, respectively). C57BL/6J exhibited the largest number of stereotypic counts and C57BL/6C exhibited the smallest number [Figure 3H; J > N (p = 0.0034), J > C (p < 0.0001), N > C (p = 0.0114)].
Light/dark transition test
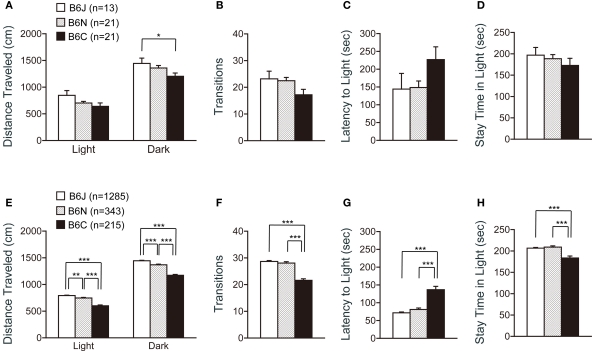
Analysis of the light/dark transition test revealed significant differences among the substrains in the distance traveled in a dark box (Figure 4A; F2,52 = 3.322, p = 0.0439), but not in the other indices (Figures 4A–D).
Figure 4.
Light-dark transition test of C57BL/6 substrains. (A–D) Regular scale analysis. (E–H) Large-scale analysis. (A,E) Distance traveled in the light and dark box. C57BL/6J mice traveled the longest distance. (B,F) Number of transitions between the light and dark box. C57BL/6C mice showed the least number of transitions. (C,G) Latency time before the first entry to the light box. C57BL/6C mice showed longer latency to enter the light box. (D,H) Time the mice stayed in the light box. C57BL/6C mice stayed less time in the light box. *p < 0.05, **p < 0.005, ***p < 0.0001. Error bars indicate SEM.
In contrast, data from large-scale analysis exhibited significant differences in all indices analyzed in this test (Figures 4E–H), although the patterns of each graph were quite similar to those shown in Figures 4A–D. Regarding the distance traveled in the light and dark box, ANOVA revealed that all substrain pairs were significantly different [Figure 4E; light: J > N (p = 0.0023), N > C (p < 0.0001), J > C (p < 0.0001), dark: J > N (p < 0.0001), N > C (p < 0.0001), J > C (p < 0.0001)]. C57BL/6J and C57BL6N mice showed a significantly greater number of transitions than C57BL/6C mice (Figure 4F; p < 0.0001, and p < 0.0001, respectively). C57BL/6C showed longer latency to enter the light box [Figure 4G; C > J (p < 0.0001), C > N (p < 0.0001)], and stayed less time in the light box [Figure 4H; J > C (p < 0.0001), N > C (p < 0.0001)], suggesting a greater anxiety-like behavior of C57BL/6C compared with C57BL/6J and C57BL6N substrains.
Elevated plus maze test
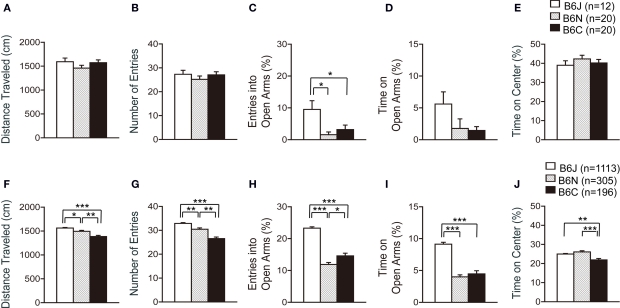
In the elevated plus maze, the number of total arm entries and distance traveled were similar in the three C57BL/6 substrains (Figures 5A,B). The percentage of entries into open arms was significantly higher in C57BL/6J compared with C57BL/6N and C57BL/6C (Figure 5C; p = 0.0055 and p = 0.0355, respectively), whereas the substrain effect regarding the time in open arms and time on center of the maze was not significantly different (Figures 5D,E).
Figure 5.
Elevated plus maze test of C57BL/6 substrains. (A–D) Regular scale analysis. (E–H) Large-scale analysis. (A,F) Total distance traveled. C57BL/6J mice traveled the longest distance in the large-scale analysis. (B,G) Number of entries into the center crossing between the open and closed arms. C57BL/6J showed the largest number of total arm entries in the large-scale analysis. (C,H) Percent number of entries into the open arms. C57BL/6J exhibited the highest percentage of entries into open arms. (D,I) Percent time spent on the open arms. C57BL/6J spent the longest time in open arms. (E,J) Percent time spent on the center of the maze. *p < 0.05, **p < 0.001, ***p < 0.0001. Error bars indicate SEM.
In the large-scale analysis, all indices showed significant differences among the substrains. C57BL/6J traveled the longest distance among the substrains, and C57BL/6N traveled a longer distance than C57BL/6C [Figure 5F; J > C (p < 0.0001), J > N (p = 0.0064), N > C (p = 0.0006)]. C57BL/6J also showed the largest number of total arm entries among the substrains, and C57BL/6N showed a larger number of total arm entries than C57BL/6C [Figure 5G; J > C (p < 0.0001), J > N (p = 0.0006), N > C (p = 0.0001)]. C57BL/6J exhibited a higher percentage of entries into open arms than C57BL/6N and C57BL/6C (Figure 5H; p < 0.0001 and p < 0.0001, respectively), and spent more time in open arms than C57BL/6N and C57BL/6C (Figure 5I; p < 0.0001 and p < 0.0001, respectively). C57BL/6C spent less time on the center of the maze than C57BL/6J and C57BL/6N (Figure 5J; p = 0.0001 and p < 0.0001, respectively).
Social interaction test
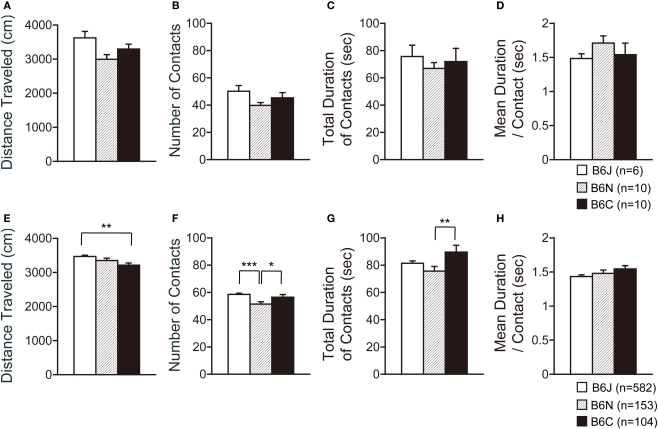
In the social interaction test, three substrains showed no significant differences in all indices containing the traveled distance, number of contacts, total duration of contacts, and mean duration per contact (Figures 6A–D).
Figure 6.
Social interaction test of C57BL/6 substrains. (A–D) Regular scale analysis. (E–H) Large-scale analysis. (A,E) Total distance traveled. (B,F) Number of contacts. (C,G) Total duration of contacts. (D,H) Mean duration per contacts. *p < 0.05, **p < 0.01, ***p < 0.0001. Error bars indicate SEM.
Large-scale analysis demonstrated significant differences in the traveled distance (Figure 6E; F2,836 = 4.774, p = 0.0087), number of contacts (Figure 6F; F2,836 = 8.377, p = 0.0002), and total duration of contacts (Figure 6G; F2,836 = 3.415, p = 0.0333), but not in the mean duration per contact (Figure 6H; F2,836 = 1.771, p = 0.1708). C57BL/6J traveled a longer distance than C57BL/6C (p = 0.0039). C57BL/6N showed a lower number of contacts than C57BL/6J and C57BL/6C (p < 0.0001 and p = 0.0390, respectively). C57BL/6C showed a longer total duration of contacts than C57BL/6N (p = 0.0091).
Startle response/prepulse inhibition tests
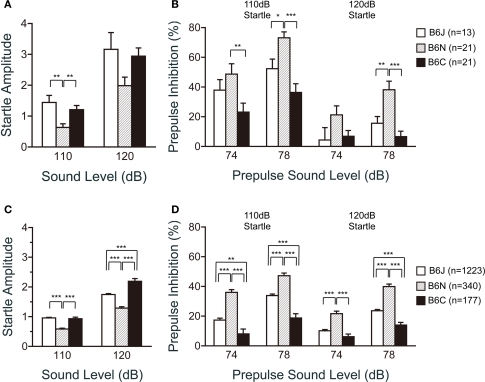
In the acoustic startle response and prepulse inhibition tests, the C57BL/6N substrain revealed remarkable features. The startle amplitude of C57BL/6N for the 110 dB startle stimulus was significantly lower than that of C57BL/6J and C57BL/6C (Figure 7A; p = 0.0008 and p = 0.0053, respectively). The prepulse inhibition of C57BL/6N for the 110 dB startle stimulus was significantly larger than that of C57BL/6J for the 78 dB prepulse sound level (p = 0.0133) and C57BL/6C for the 74 dB (p = 0.0059) and 78 dB prepulse sound level (p < 0.0001). Similarly, for the 120 dB startle stimulus, the prepulse inhibition of C57BL/6N was significantly larger than that of C57BL/6J and C57BL/6C (Figure 7B; p = 0.0035 and p < 0.0001, respectively) for the 78 dB prepulse sound level. C57BL/6N exhibited the smallest startle amplitude and showed the largest prepulse inhibition of the three substrains.
Figure 7.
Startle response/prepulse inhibition test of C57BL/6 substrains. (A,B) Regular scale analysis. (C,D) Large-scale analysis. (A,C) Acoustic startle response for the 110 and 120 dB startle stimulus. C57BL/6N showed the lowest startle amplitude. (B,D) Prepulse inhibition for the 74 and 78 dB prepulse sound level. C57BL/6N showed the highest prepulse inhibition. *p < 0.05, **p < 0.01, ***p < 0.0001. Error bars indicate SEM.
Large-scale analysis exhibited similar results as those shown in Figures 7A,B (Figures 7C,D). It demonstrated significant differences among the substrains in the startle responses (110 dB; F2,1737 = 42.607, p < 0.0001, 120 dB; F2,1737 = 41.931, p < 0.0001), and prepulse inhibition (74–110 dB; F2,1737 = 32.659, p < 0.0001, 78–110 dB; F2,1737 = 38.553, p < 0.0001, 74–120 dB; F2,1737 = 24.280, p < 0.0001, 78–120 dB; F2,1737 = 53.585, p < 0.0001). Consistently, C57BL/6N showed lower startle responses than C57BL/6J and C57BL/6C for the 110 dB (p < 0.0001, and p < 0.0001, respectively) and 120 dB startle stimuli (p < 0.0001, and p < 0.0001, respectively), and higher prepulse inhibition than C57BL/6J and C57BL/6C in all conditions tested (Figure 7D; p < 0.0001 in all conditions).
Porsolt forced swim test
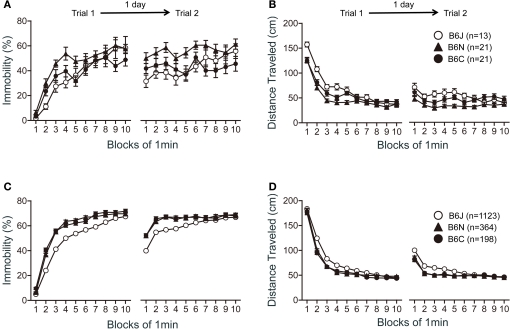
In the Porsolt forced swim test, a repeated measures ANOVA revealed significant substrain effects on immobility (Figure 8A; trial 1: F2,52 = 4.030, p = 0.0236; trial 2: F2,52 = 8.256, p = 0.008) and distance traveled (Figure 8B; trial 1: F2,52 = 12.184, p < 0.0001; trial 2: F2,52 = 12.011, p < 0.0001). C57BL/6N showed greater immobility than C57BL/6J and C57BL/6C on trial 1 (p = 0.0303, and p = 0.0135, respectively) and trial 2 (p = 0.0026, and p = 0.0006, respectively). C57BL/6J traveled a longer distance than C57BL/6C and C57BL/6N on trial 1 (p = 0.0113, and p < 0.0001, respectively). C57BL/6C traveled a longer distance than C57BL/6N (p = 0.0118). On trial 2, C57BL/6N traveled a shorter distance than C57BL/6J and C57BL/6C (p < 0.0001, and p = 0.0006, respectively).
Figure 8.
Porsolt swim test of C57BL/6 substrains. (A,B) Regular scale analysis. (C,D) Large-scale analysis. (A,C) Immobility time (%) in each block for trial 1 and trial 2. (B,D) Total distance traveled in each block for trial 1 and trial 2. Error bars indicate SEM.
Large-scale analysis also demonstrated significant substrain effects on immobility (Figure 8C; trial 1: F2,1693 = 69.358, p < 0.0001; trial 2: F2,1693 = 28.574, p < 0.0001) and distance traveled (Figure 8D; trial 1: F2,1682 = 46.888, p < 0.0001; trial 2: F2,1682 = 31.412, p < 0.0001). C57BL/6J showed less immobility than C57BL/6N and C57BL/6C on trial 1 (p < 0.0001, and p < 0.0001, respectively) and trial 2 (p < 0.0001, and p < 0.0001, respectively). C57BL/6J traveled s longer distance than C57BL/6N and C57BL/6C on trial 1 (p < 0.0001, and p < 0.0001, respectively) and trial 2 (p < 0.0001, and p < 0.0001, respectively).
Eight-arm radial maze test
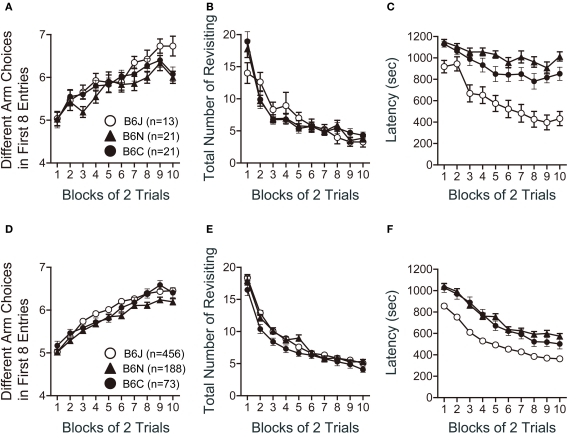
In the spatial working memory test using the eight-arm radial maze, the number of different arms chosen during the first eight choices, which is relatively independent of locomotor activity levels and the total number of choices, was significantly different among the substrains (Figure 9A; F2,51 = 3.556, p = 0.0358). C57BL/6J showed a larger number of different arm choices in the first 8 entries than C57BL/6N (p = 0.0111). There was no significant substrain effect in the number of revisiting errors, in which subjects returned to the arms that had been visited previously to retrieve a food pellet (Figure 9B; F2,51 = 0.045, p = 0.9546). The latency to take all pellets was shorter in C57BL/6J than in C57BL/6N and C57BL/6C (Figure 9C; p < 0.0001, and p < 0.0001, respectively).
Figure 9.
Spatial working memory version of eight-arm radial maze test of C57BL/6 substrains. (A–C) Regular scale analysis. (D–F) Large-scale analysis. (A,D) Number of different arms chosen within the first eight choices. (B,E) Number of revisiting errors. (C,F) Latency. C57BL/6J showed the shortest latency to take all pellets. Error bars indicate SEM.
Large-scale analysis revealed significant substrain effects on the number of different arms chosen during the first eight choices (Figure 9D; F2,681 = 11.551, p < 0.0001) and the latency to take all pellets (Figure 9F; F2,681 = 67.045, p < 0.0001), but not on the total number of revisiting (Figure 9E; F2,681 = 2.709, p = 0.0673). C57BL/6N showed a smaller number of different arm choices in the first 8 entries than C57BL/6J and C57BL/6C (p < 0.0001, and p = 0.04, respectively). The latency to take all pellets was shorter in C57BL/6J than in C57BL/6N and C57BL/6C (Figure 9F; p < 0.0001, and p < 0.0001, respectively).
Discussion
We performed behavioral profiling of three C57BL/6 substrains, C57BL/6J, C57BL/6N, and C57BL/6C, in two types of analyses: regular scale analysis, whose conditions of behavior tests and environments were tightly controlled, and large-scale analysis. In the large-scale analysis, the data was obtained from experiments using the same behavioral protocols and the same apparatuses, but the vendor, breeding environment, the dates tested, the experimenters and the test order, which could potentially affect the results, were not necessarily the same. Differences in environmental background are known to affect behaviors in mice (Crabbe et al., 1999). However, in general, data obtained from both analyses were very similar, and consistently significant differences in both analyses were found among the substrains in many tests, such as the open field, rotarod, elevated plus maze, prepulse inhibition, Porsolt forced swim, and eight-arm radial maze. Genetic differences among the C57BL/6 substrains may overwhelm the environmental effects on behaviors. Alternatively, statistical analysis of a large number of samples may have masked the effects of environmental factors. However, some tests showed less robust patterns between the regular scale and large-scale analysis. Some tests might be sensitive to some factors other than genetic factors such as environmental conditions where the mice were reared, transported conditions, and experimenters’ handling. For example, the body weight difference seems to have affected the latency in the wire hang test though it is not statistically significant. Alternatively, genetic background may not be completely identical within the same substrain used for the large-scale analysis because the mice from different vendors were mixed in the large-scale analysis. In addition, the mice used for the large-scale analysis were obtained from control wild-type animals for genetically engineered mice. Thus, we cannot completely rule out the possibility that remaining alleles of the other strains may affect the behavior though the flanking gene effect should be minimal since we used only control wild-type mice for the analysis.
Our behavioral profiling data of the three substrains provides a clue for choosing an appropriate genetic background to detect predicted behavioral phenotypes of the mutated gene of interest. For example, examination of the spontaneous locomotor activity in several behavioral tasks consistently revealed that C57BL/6J was the most active among the three substrains. This suggests a possibility that a hyperactive phenotype induced by a mutated gene may be masked by the basic hyperactive trait of C57BL/6J mice. Thus, C57BL/6J may not be the best choice of background substrain for testing mutant mice that are expected to be hyperactive.
C57BL/6J exhibited the longest time spent at the center of the open field, the shortest latency to the light box in the light / dark transition test, and the highest percentage of entries into open arms and the time in open arms in the elevated plus maze test. All of these results indicate that the C57BL/6J mice show the least anxiety-like behaviors among the three substrains. In addition, these results suggest that C57BL/6J is a recommended background strain for mutant mice that are expected to show increased anxiety-like behaviors. It is notable that the results from the light / dark transition test suggested a higher anxiety-like behavior of C57BL/6C than C57BL/6N as measured by the latency to light and the time stay in the light box, whereas there was no significant difference in the time spent on open arms in the elevated plus maze between C57BL/6N and C57BL/6C. We previously reported the discrepancies between the results of tests for anxiety-like behaviors in genetically engineered mice (Nakajima et al., 2008; Tsujimura et al., 2008). Kf-1+/+ mice showed highly increased anxiety-like behavior in the light/dark transition test while there was not a significant difference in time on open arms in the elevated plus maze test (Tsujimura et al., 2008). Calpastatin knockout mice spent significantly less time in the center of the open field, however, there were not any significant differences in the light/dark transition test and time on open arms in the elevated plus maze (Nakajima et al., 2008). Milner and Crabbe (2008) compared anxiety-like behaviors among inbred strains and found no significant correlation between time spent in the center area of the open field test and the indices in light/dark transition test or elevated zero maze, and they also found that indices of two tests had different factor patterns in principal components analyses. Our results together with these previous findings support the idea that indices of the light/dark transition and elevated plus maze tests and the time spent in the center of the open field reflect unique aspects of anxiety-like behaviors.
The startle response/prepulse inhibition test revealed a low startle amplitude and a high prepulse inhibition in C57BL/6N mice. The results are consistent with a previous report, although C57BL/6NHsd mice were used in the study (Grottick et al., 2005). Thus, C57BL/6N is recommended as a background strain for mutant mice that are expected to have deficits in prepulse inhibition, such as an animal model for schizophrenia (Braff and Geyer, 1990).
Results regarding the sensorimotor functions in our tests were consistent with a previous report (Bryant et al., 2008), with a longer hot plate latency of C57BL/6N than C57BL/6J and a longer rotarod latency of C57BL/6J than C57BL/6N.
There are several reports characterizing the behavioral differences between C57BL/6J and C57BL/6N, but no reports have been published regarding the behavioral characters of the C57BL/6C substrain. C57BL/6C was originally derived from C57BL/6N, and genetic analysis using 1,427 SNP markers showed that the SNP genotype of C57BL/6C was identical to that of C57BL/6N (Mekada et al., 2009). Consistent with the genetic evidence, the behavioral phenotypes were similar between C57BL/6N and C57BL/6C in many tests. However, our behavioral data demonstrated significant differences in several behavior tests between these two substrains. Surprisingly, in the prepulse inhibition test, the phenotype of the C57BL/6C was similar to that of the C57BL/6J rather than that of C57BL/6N. This was also the case for vertical activity in the open field test. These results are good examples that a subtle genetic difference may result in a robust phenotypic difference. Unknown mutations, which are critical for the phenotypes, may exist between the C57BL/6N and C57BL/6C substrains. Comprehensive genome analysis among the substrains by next-generation DNA sequencing technology would reveal more precise genetic differences responsible for a behavioral difference.
C57BL/6 mice are probably the most widely used inbred strain for generating and backcrossing genetically engineered mice. Background flanking genes from the parental strains may interact with the targeted gene, in a manner that may severely compromise the interpretation of the mutant phenotype (Gerlai, 1996; Crawley et al., 1997). Our behavioral profiling of three closely related inbred substrains revealed significant behavioral differences. Therefore, the genetic background of substrains should be carefully and optimally chosen, and should be considered in the interpretation of the mutant behavioral phenotypes. A method to minimize flanking allele problems is a continuous backcrossing to one well-characterized inbred mice. The method of backcrossing and full substrain information should be also described when reports on mutant studies are published.
Conflict of Interest Statement:
The authors declare that the research was conducted in the absence of any commercial or financial relationships that could be construed as a potential conflict of interest.
Acknowledgments
Male mice (C57BL/6J, C57BL/6NCrlCrlj, C57Bl/6CrSlc) were kindly provided by Oriental Yeast, Co., Ltd. Japan, and Japan SLC, Inc for the comparative behavior profiling. This work was supported by KAKENHI (Grant-in-Aid for Scientific Research) on Priority Areas “Systems Genomics” (20016013), “Pathomechanisms of Brain Disorders” (20023017), Young Scientists A (16680015), Exploratory Research (19653081), and Integrative Brain Research (IBR-shien) from the Ministry of Education, Culture, Sports, Science and Technology (MEXT) of Japan, Promotion of Fundamental Studies in Health Sciences of the National Institute of Biomedical Innovation (NIBIO), Neuroinformatics Japan Center (NIJC), and by grants from CREST & BIRD of Japan Science and Technology Agency (JST).
Footnotes
References
- Aiba A., Inokuchi K., Ishida Y., Itohara S., Kobayashi K., Masu M., Mishina M., Miyakawa T., Mori H., Nakao K., Obata Y., Sakimura K., Shiroishi T., Wada K., Yagi T. (2007). Mouse liaison for integrative brain research. Neurosci. Res. 58, 103–104 10.1016/j.neures.2007.02.012 [DOI] [PubMed] [Google Scholar]
- Bailey D. W. (1978). “Sources of subline divergence and their relative importance for sublines of six major inbred strains of mice,” in Origins of Inbred Mice, ed. Morse H. C., III (New York: Academic Press; ), 197–215 [Google Scholar]
- Blum K., Briggs A. H., DeLallo L., Elston S. F., Ochoa R. (1982). Whole brain methionine-enkephalin of ethanol-avoiding and ethanol-preferring c57BL mice. Experientia 38, 1469–1470 10.1007/BF01955775 [DOI] [PubMed] [Google Scholar]
- Bothe G. W., Bolivar V. J., Vedder M. J., Geistfeld J. G. (2004). Genetic and behavioral differences among five inbred mouse strains commonly used in the production of transgenic and knockout mice. Genes Brain Behav. 3, 149–157 10.1111/j.1601-183x.2004.00064.x [DOI] [PubMed] [Google Scholar]
- Braff D. L., Geyer M. A. (1990). Sensorimotor gating and schizophrenia. Human and animal model studies. Arch. Gen. Psychiatry. 47, 181–188 [DOI] [PubMed] [Google Scholar]
- Bryant C. D., Zhang N. N., Sokoloff G., Fanselow M. S., Ennes H. S., Palmer A. A., McRoberts J. A. (2008). Behavioral differences among C57BL/6 substrains: implications for transgenic and knockout studies. J. Neurogenet. 22, 315–331 10.1080/01677060802357388 [DOI] [PMC free article] [PubMed] [Google Scholar]
- Bucan M., Abel T. (2002). The mouse: genetics meets behaviour. Nat. Rev. Genet. 3, 114–123 10.1038/nrg728 [DOI] [PubMed] [Google Scholar]
- Crabbe J. C., Wahlsten D., Dudek B. C. (1999). Genetics of mouse behavior: interactions with laboratory environment. Science 284, 1670–1672 10.1126/science.284.5420.1670 [DOI] [PubMed] [Google Scholar]
- Crawley J. N., Belknap J. K., Collins A., Crabbe J. C., Frankel W., Henderson N., Hitzemann R. J., Maxson S. C., Miner L. L., Silva A. J., Wehner J. M., Wynshaw-Boris A., Paylor R. (1997). Behavioral phenotypes of inbred mouse strains: implications and recommendations for molecular studies. Psychopharmacology (Berl.) 132, 107–124 10.1007/s002130050327 [DOI] [PubMed] [Google Scholar]
- Crusio W. E., Goldowitz D., Holmes A., Wolfer D. (2009). Standards for the publication of mouse mutant studies. Genes Brain Behav. 8, 1–4 10.1111/j.1601-183X.2008.00438.x [DOI] [PubMed] [Google Scholar]
- Gerlai R. (1996). Gene-targeting studies of mammalian behavior: is it the mutation or the background genotype? Trends Neurosci. 19, 177–181 10.1016/S0166-2236(96)20020-7 [DOI] [PubMed] [Google Scholar]
- Grottick A. J., Bagnol D., Phillips S., McDonald J., Behan D. P., Chalmers D. T., Hakak Y. (2005). Neurotransmission- and cellular stress-related gene expression associated with prepulse inhibition in mice. Brain Res. Mol. Brain Res. 139, 153–162 10.1016/j.molbrainres.2005.05.020 [DOI] [PubMed] [Google Scholar]
- Hedges L. V. (1981). Distribution theory for Glass's estimator of effect size and related estimators. J. Educ. Behav. Stat. 6, 107–128 10.3102/10769986006002107 [DOI] [Google Scholar]
- Khisti R. T., Wolstenholme J., Shelton K. L., Miles M. F. (2006). Characterization of the ethanol-deprivation effect in substrains of C57BL/6 mice. Alcohol 40, 119–126 10.1016/j.alcohol.2006.12.003 [DOI] [PMC free article] [PubMed] [Google Scholar]
- Komada M., Takao K., Miyakawa T. (2008). Elevated plus maze for mice. J. Vis. Exp. 22, 1088. [DOI] [PMC free article] [PubMed] [Google Scholar]
- Matsuo N., Yamasaki N., Ohira K., Takao K., Toyama K., Eguchi M., Yamaguchi S., Miyakawa T. (2009). Neural activity changes underlying the working memory deficit in alpha-CaMKII heterozygous knockout mice. Front. Behav. Neurosci. 3:20 10.3389/neuro.08.020.2009 [DOI] [PMC free article] [PubMed] [Google Scholar]
- Mekada K., Abe K., Murakami A., Nakamura S., Nakata H., Moriwaki K., Obata Y., Yoshiki A. (2009). Genetic differences among C57BL/6 substrains. Exp. Anim. 58, 141–149 10.1538/expanim.58.141 [DOI] [PubMed] [Google Scholar]
- Milner L. C., Crabbe J. C. (2008). Three murine anxiety models: results from multiple inbred strain comparisons. Genes Brain Behav. 7, 496–505 10.1111/j.1601-183X.2007.00385.x [DOI] [PubMed] [Google Scholar]
- Miyakawa T., Leiter L. M., Gerber D. J., Gainetdinov R. R., Sotnikova T. D., Zeng H., Caron M. G., Tonegawa S. (2003). Conditional calcineurin knockout mice exhibit multiple abnormal behaviors related to schizophrenia. Proc. Natl. Acad. Sci. U.S.A. 100, 8987–8992 10.1073/pnas.1432926100 [DOI] [PMC free article] [PubMed] [Google Scholar]
- Mulligan M. K., Ponomarev I., Boehm S. L., 2nd, Owen J. A., Levin P. S., Berman A. E., Blednov Y. A., Crabbe J. C., Williams R. W., Miles M. F., Bergeson S. E. (2008). Alcohol trait and transcriptional genomic analysis of C57BL/6 substrains. Genes Brain Behav. 7, 677–689 10.1111/j.1601-183X.2008.00405.x [DOI] [PubMed] [Google Scholar]
- Nakajima R., Takao K., Huang S. M., Takano J., Iwata N., Miyakawa T., Saido T. C. (2008). Comprehensive behavioral phenotyping of calpastatin-knockout mice. Mol. Brain 1, 7. 10.1186/1756-6606-1-7 [DOI] [PMC free article] [PubMed] [Google Scholar]
- Nakatani J., Tamada K., Hatanaka F., Ise S., Ohta H., Inoue K., Tomonaga S., Watanabe Y., Chung Y. J., Banerjee R., Iwamoto K., Kato T., Okazawa M., Yamauchi K., Tanda K., Takao K., Miyakawa T., Bradley A., Takumi T. (2009). Abnormal behavior in a chromosome-engineered mouse model for human 15q11-13 duplication seen in autism. Cell 137, 1235–1246 10.1016/j.cell.2009.04.024 [DOI] [PMC free article] [PubMed] [Google Scholar]
- Radulovic J., Kammermeier J., Spiess J. (1998). Generalization of fear responses in C57BL/6N mice subjected to one-trial foreground contextual fear conditioning. Behav. Brain Res. 95, 179–189 10.1016/S0166-4328(98)00039-4 [DOI] [PubMed] [Google Scholar]
- Stiedl O., Radulovic J., Lohmann R., Birkenfeld K., Palve M., Kammermeier J., Sananbenesi F., Spiess J. (1999). Strain and substrain differences in context- and tone-dependent fear conditioning of inbred mice. Behav. Brain Res. 104, 1–12 10.1016/S0166-4328(99)00047-9 [DOI] [PubMed] [Google Scholar]
- Takahashi J. S., Pinto L. H., Vitaterna M. H. (1994). Forward and reverse genetic approaches to behavior in the mouse. Science 264, 1724–1733 10.1126/science.8209253 [DOI] [PMC free article] [PubMed] [Google Scholar]
- Takao K., Miyakawa T. (2006). Light/dark transition test for mice. J. Vis. Exp. 1, 104. [DOI] [PMC free article] [PubMed] [Google Scholar]
- Takao K., Toyama K., Nakanishi K., Hattori S., Takamura H., Takeda M., Miyakawa T., Hashimoto R. (2008). Impaired long-term memory retention and working memory in sdy mutant mice with a deletion in Dtnbp1, a susceptibility gene for schizophrenia. Mol. Brain 1, 11. 10.1186/1756-6606-1-11 [DOI] [PMC free article] [PubMed] [Google Scholar]
- Takao K., Yamasaki N., Miyakawa T. (2007). Impact of brain-behavior phenotypying of genetically-engineered mice on research of neuropsychiatric disorders. Neurosci. Res. 58, 124–132 10.1016/j.neures.2007.02.009 [DOI] [PubMed] [Google Scholar]
- Tsang S., Sun Z., Luke B., Stewart C., Lum N., Gregory M., Wu X., Subleski M., Jenkins N. A., Copeland N. G., Munroe D. J. (2005). A comprehensive SNP-based genetic analysis of inbred mouse strains. Mamm. Genome 16, 476–480 10.1007/s00335-005-0001-7 [DOI] [PubMed] [Google Scholar]
- Tsujimura A., Matsuki M., Takao K., Yamanishi K., Miyakawa T., Hashimoto-Gotoh T. (2008). Mice lacking the kf-1 gene exhibit increased anxiety- but not despair-like behavior. Front. Behav. Neurosci. 2:4 10.3389/neuro.08.004.2008 [DOI] [PMC free article] [PubMed] [Google Scholar]
- Yamasaki N., Maekawa M., Kobayashi K., Kajii Y., Maeda J., Soma M., Takao K., Tanda K., Ohira K., Toyama K., Kanzaki K., Fukunaga K., Sudo Y., Ichinose H., Ikeda M., Iwata N., Ozaki N., Suzuki H., Higuchi M., Suhara T., Yuasa S., Miyakawa T. (2008). Alpha-CaMKII deficiency causes immature dentate gyrus, a novel candidate endophenotype of psychiatric disorders. Mol. Brain 1, 6. 10.1186/1756-6606-1-6 [DOI] [PMC free article] [PubMed] [Google Scholar]


