Summary
PABA/NO is a diazeniumdiolate selectively activated by glutathione S-transferase P (GSTP) to release nitric oxide (NO) and is a potent inducer of protein S-glutathionylation, a redox-sensitive post-translational modification of cysteine residues. Using a procedure that incrementally increased exposure of cells to PABA/NO, an acquired drug resistant human promyelocytic leukemia HL60 cell line (HL60PABA) that exhibited 1.9-fold resistance to the drug (IC50 ~15 μM vs ~8 μM for wild-type) was created. HL60PABA cells had a decreased growth rate attributable to altered cellular differentiation, as measured by increased expression of CD11b; decreased expression of CD14; decreased nuclear to cytoplasmic ratios and a condensation of nuclear chromatin. This was accompanied by alterations in both plasma and mitochondrial membrane potentials. Both GSTP expression and nitric oxide release were reduced two-fold, while increased expression levels of genes involved in the unfolded protein response (UPR) were evident in HL60PABA cells. Wild type cells treated with PABA/NO had increased levels of protein S-glutathionylation and JNK activation, while JNK was constitutively active in HL60PABA cells and these cells had reduced levels of S-glutathionylation. By removing PABA/NO from the growth medium, HL60PABA cells reverted to sensitivity within 21 days suggesting that resistance was not genetically stable. Mechanistically, PABA/NO resistance is mediated through reduced levels of GSTP resulting in reduced NO release and its subsequent alterations in cellular response to nitrosative stress.
Keywords: Glutathione, Glutathione S-transferase, Nitric oxide, Oxidative stress, Nitrosative stress, Unfolded protein response
Introduction
Glutathione S-transferase P (GSTP1/2) is one of the members of a cytosolic GST super-family composed of alpha, mu, pi, omega, theta and zeta [1, 2]. A single gene located on chromosome 11 encodes for proteins designated in the Pi class (GSTP1). The GSTP1 gene spans ~3 kb, encodes 210 amino acids in seven exons [3]. Expression of GSTP1 occurs to varying extents in most tissues and cells [4] and is frequently increased in tumors. Moreover, a primary and reproducible characteristic of most tumor cells is an aberrant redox environment that expresses through various changes in glutathione homeostasis. As a consequence, there exists the potential to intervene in these pathways in a manner that can yield a beneficial therapeutic index. Increased GSTP expression patterns have been directly associated with ovarian, NSCLC, breast, liver, pancreas, colon cancers and lymphomas [5]. In addition, there are many examples of cancer cell lines that have acquired resistance to a range of cancer drugs that show high expression of GSTP. One of the conundrums in this field has been that in many instances, the drug used in selecting resistance is not a substrate for thioether conjugation with GSH via GST catalysis, raising the question of why such enhanced expression should occur [6]. This is particularly pertinent when considering that in some cases GSTP can be the most prevalent cytosolic protein in the cell. As a rationale for drug design, prodrugs activated by GSTP should provide an enhanced therapeutic index and preclinical and clinical experiences with Telcyta (TLK286) have provided a paradigm for this approach [7].
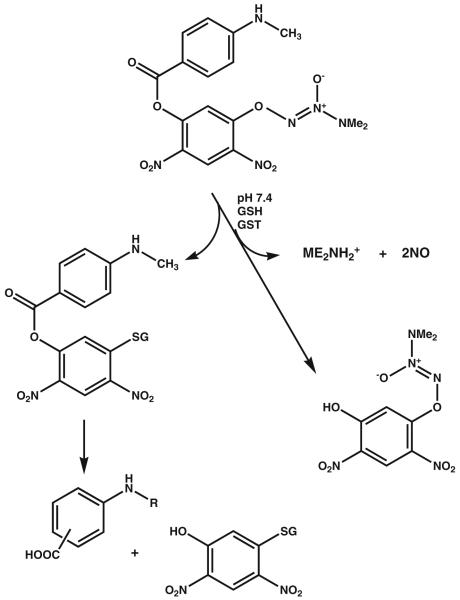
Nitric oxide (NO) is involved in a diverse number of physiological processes characterized in many previous publications, [8] but can also have cytotoxic consequences. Through interaction with metals, superoxides, oxygen and glutathione, nitric oxide can also lead to S-glutathionylation, a reversible, post-translational modification involved in cell signaling [9, 10]. As a consequence, directed delivery (tumor cells with high GSTP) of a therapeutic concentration of nitric oxide is a relevant approach to drug design. A strategy to derivatize the 02 position of a diazeniumdiolate with protective groups has been used to convert them into substrates for GST [11, 12]. The resulting inactive prodrug can become cytotoxic when localized in a cell that has high GSTP concentrations. PABA/NO (02- {2,4-dinitro-5-[4-(N-methylamino)benzoyloxy]phenyl} 1-(N,N-dimethylamino) diazen-1-ium-1,2-diolate) has N-methyl-p-aminobenzoic acid bound via its carboxyl oxygen as a 5-substituent on the 2,4-dinitrophenyl ring [13, 14]. PABA/NO belongs to the O2-aryl diazeniumdiolates, electrophiles shown to transfer their aryl groups to attacking nucleophiles with simultaneous production of ions that release NO at physiological pH. In the presence of GSH PABA/NO is activated by GSTP, as shown in Fig. 1 [12]. This reaction results in the formation of a Meisenheimer-complex intermediate, and subsequently the leaving group of the reaction generates two molecules of NO. Elevated NO levels lead to cytotoxic effects by forming RNS/ROS intermediates. In our hands, PABA/NO-induced nitrosative stress results in limited levels of protein nitrosylation, but high levels of S-glutathionylation [9, 15].
Fig. 1.
Activation of PABA/NO. Modified from Reference [11]
Drug resistance remains a primary obstacle in the therapeutic treatment of cancer. In a preclinical setting, drug resistant cell lines can be useful experimental models for studying adaptive cellular responses to chronic drug induced stress. In turn, analysis of the adaptive changes can provide information regarding plausible mechanism(s) of action of a novel agent. The present study was designed to establish an in vitro model of chronic nitrosative stress and to study those factors that might contribute to resistance to nitric oxide based therapies.
Methods
Materials
PABA/NO was prepared as previously described [12, 15] and provided by Dr. Larry Keefer, Basic Research Program, SAIC, NCI, Frederick, MD. DAF-FM-DA and JC-9 fluorescent probes were from Invitrogen (Carlsbad, CA). ThioGlo-1 fluorescent probe was from Calbiochem (San-Diego, CA). Antibodies were obtained commercially from the following companies: anti-GSH (Virogen, Watertown, MA), anti-GSTP1 (MBL International Corporation, Woburn, MA), anti-GAPDH (Novus Biologicals, Littleton, CO), anti-JNK1/2 (BD Biosciences, San Diego, CA), anti-p-JNK, anti-p38, and anti-p-p38 (Santa Cruz Biotechnology, Santa Cruz, CA). Fluorescent conjugated antibodies CD11b-PECy7, CD14-PE, and Annexin V-FITC were all obtained from BD Biosciences.
Cell lines
Human promyelocytic leukemia HL60 cells were cultured in suspension in RPMI-1640 (Cellgro, Herndon, VA) supplemented with 10% fetal bovine serum (HyClone, Logan, Utah), 1% L-glutamine (Invitrogen, Carlsbad, CA), 1% Penicillin-Streptomycin (Cellgro), and 1% MEM non-essential amino acids (Invitrogen) at 37° C in 5% CO2. HL60PABA cells were created by exposing wild type cells to 1 μM PABA/NO for a period of at least two passages and through continuous selection in increasing doses (incremental increasing by 1 μM). PABA/NO is maintained in 100 mM stocks in 100% dimethyl sulfoxide (DMSO) (Sigma, St. Louis, MO), and drug dilutions were prepared fresh in medium immediately prior to treatment. 2×10⁵ cells were initially treated with 1 μM PABA/NO and assessed for viability every 48 h. Once viability reached greater than 80%, drug dosage was increased in 0.5 μM increments until growth continued to be exponential. In most cases, the incremental increases were administered approximately once every 2 to 3 weeks. Final selection of the HL60PABA culture occurred after approximately 6 months. Experimental controls include vehicle treated HL60 cells (0.01% DMSO for 6 days) and HL60 cells treated with 1.5% DMSO for 6 days. An HL-60Revertant line was created by withdrawing drug from the cells for at least 7 passages prior to analysis. For all experimental procedures, HL60PABA cells were grown for 24 hrs without PABA/NO prior to experimental procedures.
Growth curve analysis
HL60, HL60PABA and HL60Revertant were plated at an initial density of 2×10⁵ cells/ml. The cell number and percent viability was assessed every 24 h for 5 days. Total cell number and percent viability was determined using an Auto T4 Cellometer (Nexcelom Biosciences, Lawrence, MA). To analyze cell growth in the presence of PABA/NO, every 24 h cells were counted and treated with a concentration of 8 μM. At each 24-hour interval following counting, cells were spun down and resuspended in new medium. Fresh drug was added each day for the PABA/NO treated groups. Total cell number was plotted as a function of time, and standard error is representative of three independent experiments.
Immunoblot
Equal amounts of protein were separated on 10% SDS-polyacrylamide gels and transferred overnight onto nitrocellulose membranes (Bio-Rad). Non-specific binding was reduced by incubating the membrane in 10% blocking buffer for 1 h containing 20 mM Tris-HCl, pH 7.5, 150 mM NaCl, 10% bovine serum albumin, 0.1% Tween 20, 1× protease inhibitors. Protein expression was determined by incubating membranes with specific primary in 5% blocking buffer according to manufacturer’s recommendation. Briefly, the membranes were washed three times and incubated with the appropriate secondary antibodies, conjugated with horseradish peroxidase, in 5% blocking buffer for 1 h. The membranes were washed three times and developed with enhanced chemiluminescence detection reagents (Amersham Biosciences). The relative abundance of proteins was evaluated using ChemiDock XRS with Quantity One software (ver.4.5.2; Bio-Rad) and plotted as arbitrary units in relation to actin.
Protein preparation
Following PABA/NO treatment, cells were collected and washed twice with 1× phosphate-buffered saline. Cell pellets were lysed on ice in protein lysis buffer containing 20 mM Tris-HCl, pH 7.5, 15 mM NaCl, 1 mM EDTA, 1 mM EGTA, 1% Triton X-100, 2.5 mM sodium pyrophosphate, and 1 mM-glycerophosphate freshly supplemented with complete protease inhibitor (Roche, Mannheim, Germany), 5 mM NaF and 1 mM Na3VO4. Cells were incubated on ice for 30 min, vortexed and sonicated twice for 10 s. Insoluble fraction was separated by centrifugation for 30 min at 14,000 rpm at 4°C, and supernatant protein concentrations were determined using the Bradford assay with IgG as a standard.
Flow cytometry
2×10⁶ cells per well were plated in 6-well plates containing 4 mls of complete medium. Five groups were represented: HL60, HL60 treated with 10 μM PABA/NO, HL-60PABA, vehicle control, and 1.5% DMSO. Cells were collected after 24 h, washed and resuspended in Hank’s balanced salt solution (HBSS). Replicates for each group were transferred to a 96 well plate, pelleted, and incubated for 30 min in the dark with antibody master mix containing CD14-PECy7, CD11b-PE, and FACS buffer (1× HBSS, 0.5% BSA, 0.1% sodium azide). Cells were pelleted and incubated for 15 min in the dark with Annexin-FITC antibody. Following incubation with Annexin V, cells were transferred to flow tubes and immediately analyzed using fluorescence-activated cell sorting analysis. Compensations were included in the analysis, and results were plotted as the relative percent gated population.
RNA isolation and quantitative real-time
RT-PCR Total RNA was isolated and DNase I treated using the RNeasy mini kit according to the protocol of the manufacturer (Qiagen, Valencia, CA). cDNA was prepared using either the iScript™ cDNA synthesis kit from BioRad (Hercules, CA) or the RT2 First Strand Kit from SABiosciences (Frederick, MD) according to the protocols of the manufacturers. All quantitative real-time RT-PCR (qPCR) reactions were performed using the MyiQ™ system from BioRad, and iQ™ SYBR green supermix from BioRad or SYBR Green/Fluorescein PCR Master Mix from SABiosciences according to the protocols of the manufacturers. Actin mRNA levels were used to normalize differences in cDNA levels and the data are expressed using the ΔΔCt method [16]. Primers were designed using Primer3 software [17] and previously reported [18] All reactions were performed in triplicate and data were analyzed using the 2 −ΔΔCT method [16]. GAPDH and actin was used as a gene control to normalize differences in cDNA between groups.
Protein sulfhydryl fluorescence detection
Supernatants from cell lysates (standard lysis buffer) were passed through Biospin-6 (BioRad) size-exclusion columns and diluted 1:100 with 20 mM PB (pH=7.4) in quartz cuvettes. After the addition of TG-1 (final concentration 5 μM, fluorescence at 513 nm (excitation at 379 nm) was recorded in real-time kinetics until saturation. The protein concentration of cell lysates was detected using the Bradford procedure (BioRad). The averaged emission saturation values were normalized for protein concentrations.
Plasma membrane potential measurements
Suspension of HL60 cells (0.5×10⁶ cells/ml) in PBS with 100 μM CaCl2 (pH=7.4) was incubated under constant stirring in quartz cuvette at 37°C. BisOxanol fluorescent probe in DMSO was added to cell suspension (final concentration 5 μM) and fluorescence kinetics at (at 520 nm excitation at 488 nm) was detected with resolution of 0.1 sec for 5 min. Experimental traces were averaged and smoothed using standard SigmaPlot 10.0 (Systat Software Inc., San Jose, CA) software.
Mitochondrial potential fluorescence detection
Fluorescent dye JC-9 (Invitrogen) was added (final concentration 0.3 μg/ml) to the HL60 or HL60PABA cell suspensions (1.0×10⁶ cells/ml in PBS with 100 μM CaCl2, pH=7.4). The cells were incubated in quartz cuvettes with dye at 37°C under constant stirring for 1 h. JC-9 fluorescence data were acquired in ratiometric mode (530/590 nm, excitation at 485 nm) of QM-4 (PTI) at 37°C under constant stirring.
Nitric oxide fluorescence detection
Suspensions of cells (0.5×10⁵cells/ml) were incubated with 5 μM of DAF-FM-DA (3-Amino, 4-aminomethyl-2′,7′-difluorofluorescein Diacetate (Invitrogen) for 1 h in complete media at 37°C. The labeled cells were washed 3 times with PBS, containing 100 μM of CaCl2 or 4 mM EGTA and used in quartz cuvettes (1.0×10⁶ cells /ml) for real-time kinetic measurements in a QM-4 (PTI) spectrofluorometer at 37°C under constant stirring.
Cell morphology
5×10⁵ cells were washed with 1× phosphate-buffered saline and smeared onto clean slides coated with poly-L-lysine (Sigma). Slides were left to airdry overnight, then stained with Wright-Giemsa stain (Sigma) and imaged using a Nikon Eclipse E800 microscope.
Statistical analysis of experimental data
All experimental data were statistically treated using SigmaStat 3.5 (Systat Software Inc., San Jose, CA) and generally represented as the mean ± SD. We used t-test and ANOVA to evaluate the relevance of treatment differences.
Results
Effects of PABA/NO on HL60 Cell Growth and Viability
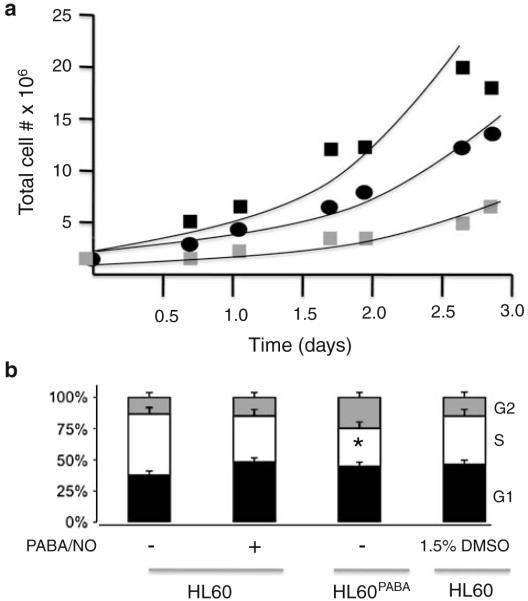
Chronic treatment of HL60 cells led to the development of resistant cells (HL60PABA) with distinct growth characteristics. In the absence of drug for ~7 passages, the resistant cells showed a revertant, yet intermediate phenotype (HL60Revertant). Growth curve analysis showed that HL60PABA grew more slowly than HL60 or HL60Revertant cells, p<0.001 (Fig. 2a). The doubling time of the cells was calculated (HL60, 20 h; HL60PABA, 50 h and HL60Revertant, 28 h). These findings are consistent with changes in the cell cycle distribution (Fig. 2b) which showed HL60PABA cells with a diminished number of cells in S and more in G2, values consistent with the slower proliferation rate, p<0.05.
Fig. 2.
PABA/NO resistant cells have a slower growth rate. a Cellular growth rates were assessed for (■) HL60, ( ) HL60PABA, (●) HL60Revertant. Cells were plated at a density of 2×10⁵ cells/ml and the total cell number was recorded at regular intervals and plotted as a function of time. b Cell cycle distribution was assessed in the Flow Cytometry Facility at MUSC. Data represent the mean±SE for 3 independent experiments. Student’s t test was used to determine statistically significant differences indicated by (*) p-value <0.001
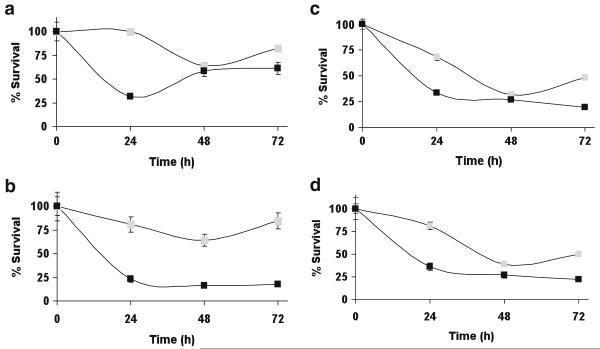
Figures 3a–b show the growth of HL60 and HL60PABA cells when challenged on day 1 with 10 μM or 20 μM PABA/NO. There was a statistically significant difference in survival of HL60PABA cells compared to HL60 cells, p<0.05. At 24 h following 10 μM PABA/NO treatment, only 32±4% of HL60 cells survived versus 100±9% of HL60PABA cells. HL60 cells did recover from this treatment, however only the HL60PABA cells continued growth following further drug exposure. Because response to both thapsigargin and cisplatin is also linked with GSTP expression and with S-glutathionylation [19], we assessed cell kill by each of these drugs. In each case, collateral resistance of the HL60PABA/NO cells was found, p<0.05 (Fig. 2c and d).
Fig. 3.
a PABA/NO resistant cells are less sensitive to the cytotoxic effects of PABA/NO. 2×10⁴ cells (■) HL60 or ( ) HL60PABA were treated with a 10 uM or b 20 uM PABA/NO. Collateral resistance was assessed by treating the cells with c 300 nM thapsigargin or d 5 uM cisplatin. The total number of cells was counted and cell viability plotted as a function of time. Statistically significant differences were determined using Student’s t test and are indicated by, p-value <0.05
We have shown that PABA/NO treatment leads to dose- and time- dependent increases in NO generation and activation of endoplasmic reticulum (ER) stress in HL60 and SKOV3 cells [18]. Basal levels of NO were approximately two-fold lower in HL60PABA compared to wild type cells, p<0.001 (Fig. 4). Addition of PABA/NO produced an increase of NO in each cell line, while the lower levels of NO in HL60PABA cells remained equivalent. These results suggest that the resistant cells may be activating less of the drug. However, even though the resistant cells are able to grow in PABA/NO, our data suggest that they are in a state of continuous ER stress. Elevated levels of PDI, ERO1, BiP and XBP-1 are coordinate with ER stress and activation of the unfolded protein response (UPR) [18, 20]. Table 1 shows by RT-PCR that HL60PABA cells have elevated transcript levels for seven distinct gene products that have been associated with regulating the UPR. These data are consistent with adaptation of HL60PABA to chronic ER stress as a consequence of drug-induced nitrosative stress.
Fig. 4.
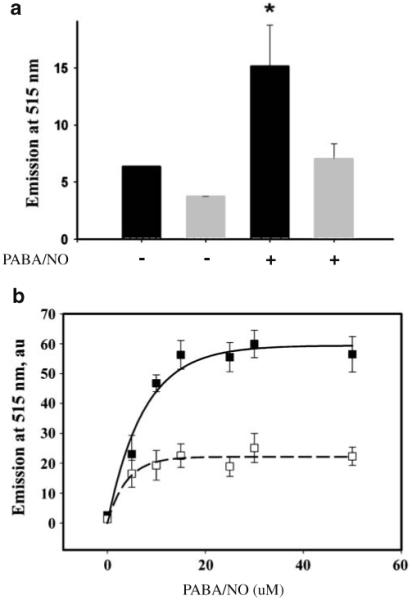
NO generation is decreased in PABA/NO resistant cells. To measure NO levels cells were labeled with 5 μM DAF-FM. a Basal NO levels (− bars) and NO levels resulting from an additional 25 μM PABA/NO (+ bars) were assessed in HL60 (black) and HL60PABA (grey). b Dose-dependent (PABA/NO) increases in NO generation were measured for HL60 (■) and HL60PABA (□). Data represent the mean±SE for 3 independent experiments. * Statistically significant differences were determined using t-test (SigmaStat 3.5), p-value <0.001
Table 1.
Fold-induction of UPR responsive genes. The right hand columns show the quantitative expression levels of each of the genes in wild type (HL60) and resistant cell lines HL60−PABA
| Name | Sequence | HL60 | HL60PABA |
|---|---|---|---|
| PDI | F 5′ TCC TTG CCC TGT ATC AAA TCT T 3′ R 5′ TGA CCA GTG GCA AAA TTA AAA A 3′ |
1.0±0.2 | 1.89±0.2* |
| ERO1 | F 5′ TAA ACC TGA AGA GGC CGT GT 3′R 5′ TGA CAT GGT TTG ACA GCA CA 3′ | 1.01±0.2 | 1.42±0.1* |
| CHOP | F 5′ CTG AAT CTG CAC CAA GCA TGA 3′R 5′ AAG GTG GGT AGT GTG GCC C 3′ | 1.00±0.1 | 1.54±0.3* |
| Bip | F 5′ AAG AAG CTA TTC AGT TGG ATG GA 3′ R 5′ TTC TGT TAA CTT CGG CTT GGA 3′ |
1.01±0.1 | 8.65±0.9* |
| HSP70 | F 5′ TGC AGC AGG ACA TCA AGT TC 3′R 5′ ATG TCT TTG TTT GCC CAC CT 3′ | 1.02±0.2 | 3.04±0.7* |
| GADD34 | F 5′ CTG GGG ACT TTT GGA TGA TG 3′R 5′ ATT GAC TTC CCT GCC CTC TA 3′ | 1.04±0.2 | 3.41±0.6* |
| XBP-1 | F 5′ CCA AAA ACT TTT GCT AGA AAA TCA GC 3′ R 5′ CAT CCC CAA GCG CTG TCT TA 3′ |
1.01±0.2 | 1.80±0.5* |
Statistically significant differences were determined using t-test (SigmaStat 3.5), p-value <0.05
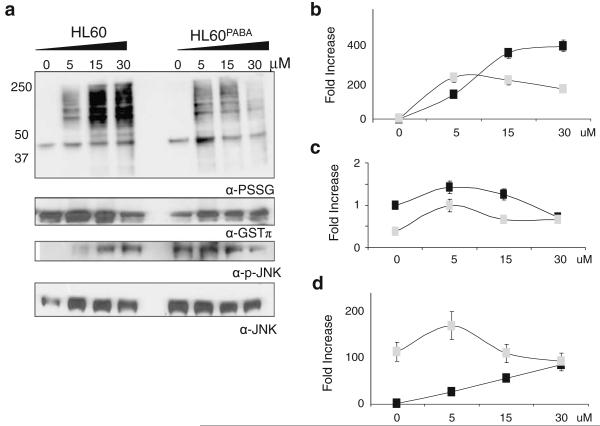
We established previously that PABA/NO induces protein S-glutathionylation in a dose- and time-dependent manner in HL60 cells [9]. However, the influence of chronic exposure to PABA/NO on protein S-glutathionylation is not known. To examine this, we evaluated dose-dependent PABA/NO effects on S-glutathionylation patterns. Figure 5 confirmed the dose-dependency of PABA/NO increases in protein S-glutathionylation. Although the drug did induce S-glutathionylation in HL60PABA cells, this was less dose-dependent and total levels were reduced. Interestingly, the baseline levels of S-glutathionylation were the same in both cell lines. The forward reaction of S-glutathionylation can be catalyzed by GSTP [21], the same enzyme that can activate PABA/NO. Figure 5a (second panel) shows that basal GSTP expression levels were >2-fold lower in HL60PABA when compared to wild type, p<0.05. Such data are consistent with the observed S-glutathionylation patterns. Moreover, the expression of JNK1 and its phosphorylated form is constitutively higher in the HL60PABA cells (p<0.05) and following PABA/NO treatment is diminished. However, these levels are not below those of the stimulated HL60 cells.
Fig. 5.
S-glutathionylation, GSTP expression and JNK activation are diminished in PABA/NO resistant cells. HL60 and HL60PABA cells were treated for 1 hr with 0–50 uM PABA/NO. a 50 μg protein lysate was separated by SDS-PAGE under non-reducing conditions and immunoblotted using specific antibodies for protein S-glutathionylation, GSTP and total and phosphorylated JNK levels. The corresponding relative abundances of b S-glutathionylated proteins; c GSTP levels; and d activated JNK were plotted as the relative ratio to actin for HL60 (■) and HL60PABA ( )
)
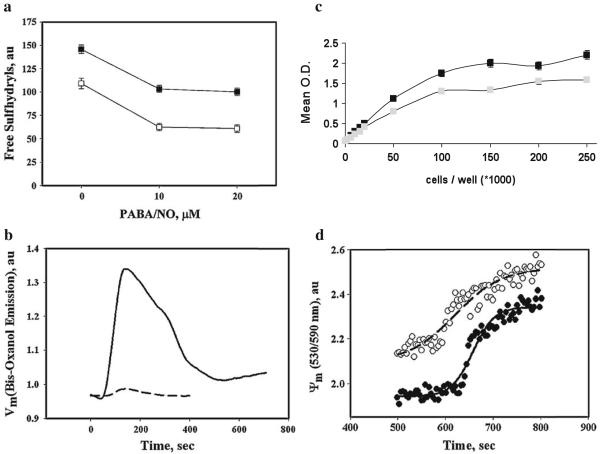
To show PABA/NO-mediated effects on cell surface and intracellular thiol redox status, we used a fluorescent (ThioGlo-1) detection technique. Figure 6a shows that HL60PABA cells have decreased levels of cell surface protein sulfhydryls compared to wild type, p<0.001. Additional treatments with PABA/NO further decreased cell surface protein-sulfhydryl content in both wild type and HL60PABA cells, although there was no apparent dose response. These effects were insensitive to treatment with the disulfide reducing agent TCEP (data not shown). These data suggest that development of resistance to PABA/NO is accompanied by cell surface modification(s) that alter redox properties. This was supported by data for the plasma membrane potential following a single dose of PABA/NO (Fig. 6b). The membrane potential in the HL60PABA cells was diminished compared to wild type.
Fig. 6.
Resistance to PABA/NO was concurrent with altered plasma- and mitochondrial membrane potential. a Measurement of extracellular free thiols in HL60 (black) and HL60PABA (gray) cells using the molecular probe, TG-1. TG-1 (final concentration 5 μM) was added to the suspension of 1.0×10⁶ cells/ml, in PBS with 100 μM CaCl2 before and after addition of indicated amounts of PABA/NO and incubated for 30 min at 37°C under constant stirring. Emissions at 513 nm (excitation at 379 nm) were recorded in real-time kinetics until saturation. The average emission values were normalized for cell number. b To determine if changes in sulfhydryl content at the cell surface alter membrane potential we monitored the plasma membrane potential (Vm) changes using emission detection of the fluorescent dye bis-oxanol (5 μM; Ex. at 488 nm, Em. at 520 nm). Original traces (resolution 0.1 sec) were averaged and smoothed using standard Sigma Plot10 Software; Experimental data were fitted with exponential decay using standard SigmaPlot10 Software, R2≥0.97. c Mitochondrial function was assessed by measuring the conversion of tetrozole to formazan in living cells via mitochondria reductases. d The mitochondrial membrane potential (Ψ) in HL60 cells and HL60PABA/NO are different. Cell suspensions in PBS (with 100 μM CaCl2, pH 7.4) were incubated with JC-9 (final concentration 0.3 μg/ml) at 37°C under constant stirring for 1 h. JC-9 emission was recorded in ratiometric mode (530/590 nm, excitation at 485 nm) before and after (500 sec) addition of 20 μM PABA/NO. The experimental points were fitted with standard sigmoid curves (SigmaPlot 10.0), R2~0.98. Data are representative for 3 independent experiments
Original efforts to assess collateral resistance using the MTT survival assays suggested that the HL60PABA cells had some mitochondrial dysfunction, insofar as survival was incompatible with the growth curves. Accordingly, to measure the changes in the metabolism, we plated equivalent numbers of cells and immediately assessed mitochondrial reductase mediated conversion of the tetrazolium salt to formazan [22]. The MTT assay data indicated impairment of mitochondrial reductase activity in HL60PABA cells resulting in a diminished conversion (per cell) relative to HL60 cells, p<0.05 (Fig. 6c). To extend these results, we employed fluorescent detection of the mitochondrial membrane potential using the ratiometric dye JC-9. Our data showed that the initial trans-membrane potential in HL60PABA cells was higher than in wild type, Fig. 6d. Moreover, the response of mitochondrial membrane potential to additional PABA/NO was steeper in wild type compared to resistant cells (Fig. 6d). These data are consistent with drug induced partial impairment of mitochondrial function in resistant cells and indicate that PABA/NO may have direct effects on mitochondria that may be important to its mechanism of action.
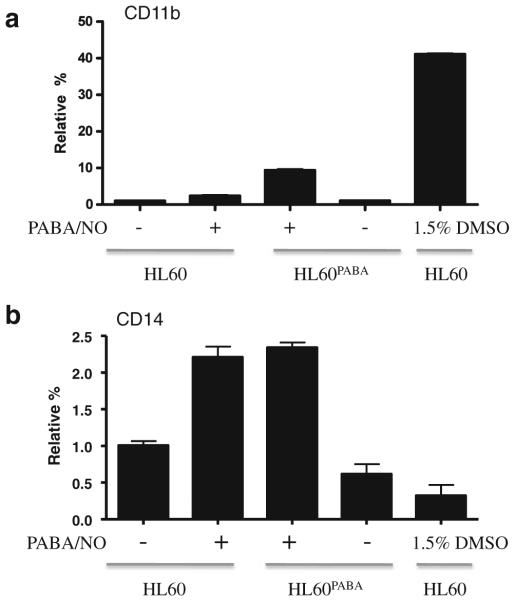
Because NO can cause terminal differentiation of leukemic cells [14, 23], we considered that the resistant phenotype observed in HL60PABA may be linked with cellular differentiation. To test this, we performed flow cytometric analyses to measure the expression of cell surface antigen markers for myeloid differentiation, as well as Wright-Giemsa staining to examine cell morphology. Figure 7a shows the presence of cell surface antigen markers CD11b and CD14 expressed as a relative percent of the gated populations. Less than 1% of HL60 wild type cells expressed CD11b. However, HL60PABA cells had a ~10-fold increase in CD11b compared to HL60 cells, p<0.001. This increase was not seen following a single treatment of PABA/NO or vehicle control cells indicating that a portion of the HL60PABA population was differentiated. A >2-fold increase in expression of CD14 was seen in both HL60 cells following a single PABA/NO treatment and HL60PABA cells compared to vehicle and HL60 cells, p<0.001. Wright-Giemsa staining illustrated a morphological difference between HL60 and HL60PABA cells. Figure 8 shows that both HL60PABA (panel D) and 1.5% DMSO treated cells (positive control; panel B) exhibited features characteristic of terminal differentiation including a marked change in size, decreased cytoplasm to nucleus ratio, reduction in number of nucleoli and nuclear segmentation. The morphology of the HL60Revertant cells (panel C) showed a heterogeneous population that contained cells morphologically similar to HL60 (panel A) as well as differentiated cells.
Fig. 7.
PABA/NO resistant cells have cell surface markers consistent with differentiation. Flow cytometry was used to measure the expression of cell surface antigens a CD11b and b CD14 in HL-60, HL60 (10 μM PABA/NO), HL60PABA, vehicle control and 1.5% DMSO treated. Results are plotted as the relative percent gated population
Fig. 8.
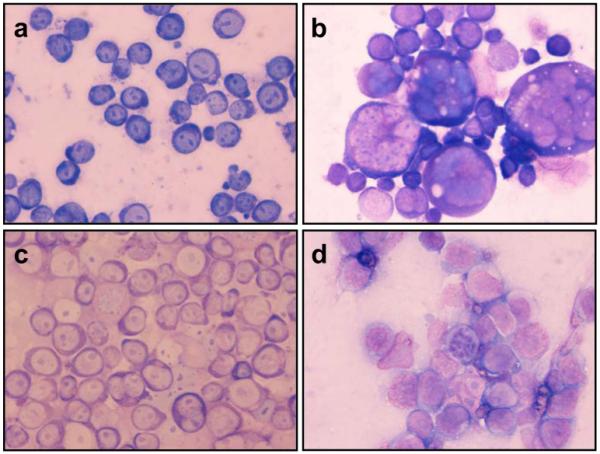
Cell morphology of PABA/NO resistant cells was studied using Wright-Giemsa stain. a HL60, b DMSO 1.5% treated (induced differentiation), c HL60Revertant, d HL60PABA. Cells were collected on 4 independent days, and the images are representative of all images captured
Discussion
Tumor cell lines with acquired drug resistance frequently adapt cellular properties in response to the selection conditions. As a consequence, resistance models can provide information useful in understanding the drug’s mechanism(s) of action. In the present study, an approximately two-fold resistance was achieved, even after 6–8 months of exposure to PABA/NO. Despite the extensive selection period, this low degree of resistance expressed is similar to another GSTP activated prodrug, where selection of a resistant HL60 cell line with Telcyta (TLK286; γ-glutamyl-α-amino-β (2-ethyl-N,N,N’,N’-tetrakis (2-chloroethyl) phosphorodiamidate)-sulfonyl-propionyl-(R)-(-) phenylglycine]) was both unstable and difficult to achieve [24]. PABA/NO differs from Telcyta in that the latter produces an electrophilic aziridinium and a vinyl sulfone species. Conversely PABA/NO releases NO causing concomitant downstream nitrosative and oxidative stress. Resistance to each drug is similar in being accompanied by a reduced expression of GSTP. In each case this contributes to reduction in the kinetics of drug activation, a commonality that is unusual in that the majority of drug resistant cell lines over-express GSTP [5]. Since we have shown that GSTP catalyzes the forward S-glutathionylation reaction [21], the lower protein S-glutathionylation in HL60PABA cells is also consistent with the adaptive down-regulation of GSTP. Treatment of wild type cells with PABA/NO increases JNK expression and phosphorylation. In HL60PABA cells, there are constitutively high levels of JNK1 and its phosphorylated form, consistent with the chronic nature of the drug-induced stress.
The resistant cells have a significantly slower growth rate than the wild type, reflected by the smaller fraction of cells in G2/S phases. At least one contributing factor is the capacity of NO to cause HL60 cell differentiation. The proportion of HL60PABA cells that differentiate as a consequence of drug selection provide an end stage population that may no longer contribute towards the overall proliferative index. Our results show that approximately 10% of the cells express differentiation markers that implicate movement into granulocyte/monocyte lineage. In principle, these cells could remain viable and because they are not dividing, will be less sensitive to cytotoxic agents. They could represent end stage cells that will die off with time and might be less likely to contribute to repopulation since they will not re-enter the proliferative pool. When cells are passaged in the absence of PABA/NO for greater than 2 weeks the resistant cells revert to sensitivity and their growth characteristics become intermediate between the wild type or HL60PABA cell lines. This implies that resistance is more a function of adaptive stress responses rather than genetic selection of a sub-population of resistant cells.
The HL60PABA cells developed collateral resistance to thapsigargin and cisplatin. While this could be related to the generally reduced sensitivity of cells with slower doubling times, the altered thiol homeostasis found in the resistant cells may also be of consequence. Thapsigargin is an inhibitor of the Ca2+ dependent ATPase SERCA1 [25] and its metabolism does not obviously produce any electrophilic metabolites [26]. Nevertheless, we have found that thapsigargin can cause protein S-glutathionylation and that this may be a consequence of a linkage between S-glutathionylation and intracellular Ca2+ homeostasis (Manevich et al. unpublished data). In this regard SERCA is regulated by S-glutathionylation [27]. These results may imply similar downstream effects of these drugs on thiol and calcium regulatory pathways. Changes in cell surface thiols and cell membrane potential accompanying the resistance phenotype may have impact on drug uptake or efflux. In addition, the modified mitochondrial membrane potential could influence a number of pathways that regulate cell survival and these might contribute to the observed collateral response patterns.
In summary, PABA/NO is in preclinical development as a possible anticancer drug and has shown promising in vitro and in vivo activity [9, 28]. The present data suggest that a number of cellular adaptations underlie resistance. At least one adaptive response is decreased expression of GSTP with accompanied lower levels of intracellular nitrosative stress and a concomitant lower protein S-glutathionylation. The fact that resistance was difficult to achieve and unstable may be favorable factors in continued drug development plans.
Acknowledgements
Supported by NCI National Cancer Institute grants CA08660 and CA117259. We thank Cameron McIlwain for her initial role in creating the drug resistant cell lines and the Drug Metabolism and Pharmacokinetics and Flow Cytometry Core Facilities of the Hollings Cancer Center.
Abbreviations
- PABA/NO
(O2-{2,4-dinitro-5-[4-(N-methylamino)benzoyloxy]phenyl} 1-(N,N-dimethylamino) diazen-1-ium-1,2-diolate)
- GSH
Glutathione reduced
- GSSG
Glutathione oxidized
- ER-stress
Endoplasmic reticulum stress
- GSTP
Glutathione S-transferase P
- PDI
Protein disulfide isomerase
- Tg
Thapsigargin
- JNK
c-Jun N-terminal kinase
- ROS-RNS
Reactive oxygen and nitrogen species
- NO
Nitric oxide
- TCEP
Tris(2-carboxyethyl) phosphine
- UPR
Unfolded protein response
Contributor Information
Steven Hutchens, Department of Pharmaceutical and Biomedical Sciences, Medical University of South Carolina, Charleston, SC, USA.
Yefim Manevich, Department of Cell and Molecular Pharmacology and Experimental Therapeutics, Medical University of South Carolina, Charleston, SC, USA.
Lin He, Department of Cell and Molecular Pharmacology and Experimental Therapeutics, Medical University of South Carolina, Charleston, SC, USA.
Kenneth D. Tew, Department of Cell and Molecular Pharmacology and Experimental Therapeutics, Medical University of South Carolina, Charleston, SC, USA
Danyelle M. Townsend, Department of Pharmaceutical and Biomedical Sciences, Medical University of South Carolina, Charleston, SC, USA
References
- 1.Hayes JD, Pulford DJ. The glutathione S-transferase supergene family: regulation of GST and the contribution of the isoenzymes to cancer chemoprotection and drug resistance. Crit Rev Biochem Mol Biol. 1995;30(6):445–600. doi: 10.3109/10409239509083491. [DOI] [PubMed] [Google Scholar]
- 2.McIlwain CC, Townsend DM, Tew KD. Glutathione S-transferase polymorphisms: cancer incidence and therapy. Oncogene. 2006;25(11):1639–1648. doi: 10.1038/sj.onc.1209373. [DOI] [PMC free article] [PubMed] [Google Scholar]
- 3.Cowell IG, et al. The structure of the human glutathione S-transferase pi gene. Biochem J. 1988;255(1):79–83. doi: 10.1042/bj2550079. [DOI] [PMC free article] [PubMed] [Google Scholar]
- 4.Laisney V, et al. Human genes for glutathione S-transferases. Hum Genet. 1984;68(3):221–227. doi: 10.1007/BF00418392. [DOI] [PubMed] [Google Scholar]
- 5.Tew KD. Glutathione-associated enzymes in anticancer drug resistance. Cancer Res. 1994;54(16):4313–4320. [PubMed] [Google Scholar]
- 6.Tew KD. Redox in redux: emergent roles for glutathione S-transferase P (GSTP) in regulation of cell signaling and S-glutathionylation. Biochem Pharmacol. 2007;73(9):1257–1269. doi: 10.1016/j.bcp.2006.09.027. [DOI] [PubMed] [Google Scholar]
- 7.Tew KD. TLK-286: a novel glutathione S-transferase-activated prodrug. Expert Opin Investig Drugs. 2005;14(8):1047–1054. doi: 10.1517/13543784.14.8.1047. [DOI] [PubMed] [Google Scholar]
- 8.Furchgott RF. Endothelium-derived relaxing factor: discovery, early studies, and identification as nitric oxide. Biosci Rep. 1999;19(4):235–251. doi: 10.1023/a:1020537506008. [DOI] [PubMed] [Google Scholar]
- 9.Townsend DM, et al. A glutathione S-transferase piactivated prodrug causes kinase activation concurrent with S-glutathionylation of proteins. Mol Pharmacol. 2006;69(2):501–508. doi: 10.1124/mol.105.018523. [DOI] [PMC free article] [PubMed] [Google Scholar]
- 10.Wink DA, et al. The multifaceted roles of nitric oxide in cancer. Carcinogenesis. 1998;19(5):711–721. doi: 10.1093/carcin/19.5.711. [DOI] [PubMed] [Google Scholar]
- 11.Saavedra JE, et al. The secondary amine/nitric oxide complex ion R(2)N[N(O)NO](-) as nucleophile and leaving group in S9N)Ar reactions. J Org Chem. 2001;66(9):3090–3098. doi: 10.1021/jo0016529. [DOI] [PubMed] [Google Scholar]
- 12.Saavedra JE, et al. PABA/NO as an anticancer lead: analogue synthesis, structure revision, solution chemistry, reactivity toward glutathione, and in vitro activity. J Med Chem. 2006;49(3):1157–1164. doi: 10.1021/jm050700k. [DOI] [PMC free article] [PubMed] [Google Scholar]
- 13.Saavedra JE, et al. Esterase-sensitive nitric oxide donors of the diazeniumdiolate family: in vitro antileukemic activity. J Med Chem. 2000;43(2):261–269. doi: 10.1021/jm9903850. [DOI] [PubMed] [Google Scholar]
- 14.Udupi V, et al. JS-K, a nitric oxide prodrug, induces cytochrome c release and caspase activation in HL-60 myeloid leukemia cells. Leuk Res. 2006;30(10):1279–1283. doi: 10.1016/j.leukres.2005.12.007. [DOI] [PubMed] [Google Scholar]
- 15.Findlay VJ, et al. Tumor cell responses to a novel glutathione S-transferase-activated nitric oxide-releasing prodrug. Mol Pharmacol. 2004;65(5):1070–1079. doi: 10.1124/mol.65.5.1070. [DOI] [PMC free article] [PubMed] [Google Scholar]
- 16.Livak KJ, Schmittgen TD. Analysis of relative gene expression data using real-time quantitative PCR and the 2(-Delta Delta C(T)) method. Methods. 2001;25(4):402–408. doi: 10.1006/meth.2001.1262. [DOI] [PubMed] [Google Scholar]
- 17.Rozen S, Skaletsky H. Primer3 on the WWW for general users and for biologist programmers. Methods Mol Biol. 2000;132:365–386. doi: 10.1385/1-59259-192-2:365. [DOI] [PubMed] [Google Scholar]
- 18.Townsend DM, Manevich Y, He L, Hutchens S, Tew KD. Nitrosative-stress induced S-glutathionylation of PDI leads to activation of the unfolded protein response. Cancer Res. 2009;69:7626–7634. doi: 10.1158/0008-5472.CAN-09-0493. [DOI] [PMC free article] [PubMed] [Google Scholar]
- 19.Ishimoto TM, Ali-Osman F. Allelic variants of the human glutathione S-transferase P1 gene confer differential cytoprotection against anticancer agents in Escherichia coli. Pharmacogenetics. 2002;12(7):543–553. doi: 10.1097/00008571-200210000-00006. [DOI] [PubMed] [Google Scholar]
- 20.Townsend DM. S-glutathionylation: indicator of cell stress and regulator of the unfolded protein response. Mol Interv. 2007;7(6):313–324. doi: 10.1124/mi.7.6.7. [DOI] [PMC free article] [PubMed] [Google Scholar]
- 21.Townsend DM, et al. Novel role for glutathione S-transferase pi. Regulator of protein S-Glutathionylation following oxidative and nitrosative stress. J Biol Chem. 2009;284(1):436–445. doi: 10.1074/jbc.M805586200. [DOI] [PMC free article] [PubMed] [Google Scholar]
- 22.Mosmann T. Rapid colorimetric assay for cellular growth and survival: application to proliferation and cytotoxicity assays. J Immunol Methods. 1983;65(1–2):55–63. doi: 10.1016/0022-1759(83)90303-4. [DOI] [PubMed] [Google Scholar]
- 23.Collins SJ, et al. Terminal differentiation of human promyelocytic leukemia cells induced by dimethyl sulfoxide and other polar compounds. Proc Natl Acad Sci USA. 1978;75(5):2458–2462. doi: 10.1073/pnas.75.5.2458. [DOI] [PMC free article] [PubMed] [Google Scholar]
- 24.Rosario LA, et al. Cellular response to a glutathione S-transferase P1-1 activated prodrug. Mol Pharmacol. 2000;58(1):167–174. doi: 10.1124/mol.58.1.167. [DOI] [PubMed] [Google Scholar]
- 25.Xu C, et al. Specific structural requirements for the inhibitory effect of thapsigargin on the Ca2+ ATPase SERCA. J Biol Chem. 2004;279(17):17973–17979. doi: 10.1074/jbc.M313263200. [DOI] [PubMed] [Google Scholar]
- 26.Paula S, Ball WJ., Jr Molecular determinants of thapsigargin binding by SERCA Ca2+-ATPase: a computational docking study. Proteins. 2004;56(3):595–606. doi: 10.1002/prot.20105. [DOI] [PubMed] [Google Scholar]
- 27.Adachi T, et al. S-Glutathiolation by peroxynitrite activates SERCA during arterial relaxation by nitric oxide. Nat Med. 2004;10(11):1200–1207. doi: 10.1038/nm1119. [DOI] [PubMed] [Google Scholar]
- 28.Shami PJ, et al. Antitumor activity of JS-K [O2-(2, 4-dinitrophenyl) 1-[(4-ethoxycarbonyl)piperazin-1-yl]diazen-1-ium-1, 2-diolate] and related O2-aryl diazeniumdiolates in vitro and in vivo. J Med Chem. 2006;49(14):4356–4366. doi: 10.1021/jm060022h. [DOI] [PubMed] [Google Scholar]


