

Abstract
Nicotinic acid (NA; or niacin) has been used as a hypolipidemic agent for more than four decades. However, the mechanisms underlying the effects of NA treatment (wanted and unwanted) are still poorly understood. In the present study, we discovered that NA infusion in rats resulted in dephosphorylation (i.e., activation) of the forkhead transcription factor FOXO1 in insulin sensitive tissues such as skeletal and cardiac muscles, liver, and adipose tissue. These NA effects were opposite to the effects of insulin to increase FOXO1 phosphorylation. To test whether NA alters gene expression in these tissues, rats were infused for 7 h with NA (30 μmol/h) and/or insulin (5 mU/kg/min), and gene expression was evaluated using a microarray analysis. NA had widespread effects on gene expression in all of the tissues studied, and the number of genes affected by NA greatly exceeded that of genes affected by insulin. A systematic (or strategic) analysis of the microarray data revealed that there were numerous genes whose expression was regulated inversely by insulin and NA in correlation with FOXO1 phosphorylation, representing potential FOXO1 target genes. We also identified a group of genes whose expression was altered by NA exclusively in adipose tissue, presumably due to stimulation of the NA receptor in this tissue. Finally, there were genes whose expression was altered by both NA and insulin, likely via lowering plasma FFA levels, including lipoprotein lipase and ATP-binding cassette A1 which play a major role in the regulation of circulating lipids. Thus, our data suggest that NA alters gene expression in insulin-sensitive tissues by various mechanisms. Some of the NA-induced changes in gene expression are discussed as potential mechanisms underlying wanted and unwanted effects of NA treatment.
Supplementary key words: FFA rebound, insulin resistance, lipid-lowering drug, lipolysis, nicotinic acid receptor, microarray analysis, skeletal muscle, liver, adipose tissue
Introduction
In addition to its function as a vitamin, nicotinic acid (NA; or niacin) has been used as a lipid-lowering drug for more than four decades (1, 2); NA treatment, at high doses, decreases LDL-cholesterol, triglycerides, and VLDL while increasing HDL-cholesterol (3, 4), and all of these effects are beneficial to the prevention of atherosclerosis. The lipid-lowering effects of NA have been traditionally attributed to its antilipolytic effect in adipocytes (5); NA binds to and stimulates a G-protein coupled receptor (i.e., NA receptor) in the plasma membrane of adipocytes to decrease cAMP and lipolysis, and decreased lipolysis in adipocytes reduces the supply of FFA for triglyceride synthesis and VLDL formation in the liver. However, this classic view may need to be revised as circulating FFA levels, initially decreased, rebound during long-term NA treatment while the lipid-lowering effects persist (3). There is evidence that NA lowers circulating lipid levels by increasing the lipoprotein lipase (LPL) activity and thereby enhancing the VLDL removal rate (4, 6). Thus, despite a long history of its clinical use, the precise mechanism by which NA persistently lowers circulating lipids remains unclear. In addition, NA treatment often causes insulin resistance (7, 8), which prohibits the use of NA in diabetic patients who would greatly benefit from the lipid-lowering effects of the drug. The mechanism by which NA causes insulin resistance remains unclear.
NA has also been used as a tool for lowering plasma FFA (assuming that this is the only effect of NA) in metabolic studies on the role of plasma FFA. In our study employing NA for this purpose, we serendipitously found that NA infusion in conscious rats acutely decreased Akt and FOXO1 phosphorylation in insulin sensitive tissues, such as liver, adipose tissue, and skeletal and cardiac muscles. Akt, which is also known as protein kinase B (PKB), is a crucial component of the phosphatidylinositol 3-kinase (PI3K) pathway that is activated by various growth factors including insulin. Akt plays a major role in many biological responses that include cell survival, proliferation, growth, and nutrient metabolism (9, 10). Many of the Akt effects are mediated by the FOXO family of forkhead transcription factors (11, 12), which are also involved in glucose and lipid metabolisms. In particular, FOXO1 is expressed in insulin-sensitive tissues such as liver, skeletal muscle, and adipose tissue and has been implicated in the regulation of insulin action in these tissues (13-15). The activity of FOXO1 is controlled via its phosphorylation by Akt. Specifically, FOXO1 localizes in the nucleus in the basal state, but, upon stimulation with growth factors, Akt phosphorylates FOXO1, leading to the nuclear export of FOXO1 and inhibition of FOXO1-dependent transcription (11).
One goal of the present study was to follow up our novel finding that NA decreases Akt and FOXO phosphorylation in insulin sensitive tissues and to confirm that these effects are opposite to the well-known effects of insulin to increase Akt and FOXO1 phosphorylation. Because changes in FOXO1 phosphorylation would alter its nuclear transcriptional activity, our finding suggests that NA may alter the expression of genes, especially FOXO1 target genes, in insulin sensitive tissues. A second goal of the present study was to determine the effects of NA and/or insulin on gene expression in insulin sensitive tissues in rats using a gene expression microarray analysis. Our results indicate that NA had widespread effects on gene expression in all of the insulin sensitive tissues studied. In addition, a systematic or strategic analysis of the microarray data revealed that these effects occurred apparently via various mechanisms including FOXO1-dependent, plasma FFA-dependent, and adipose tissue-specific pathways. Some of these effects occurred in genes involved in the regulation of fuel metabolism, cellular signaling, and/or insulin action, providing novel insights into the mechanisms underlying wanted and unwanted effects of NA treatment.
Methods
Animals and catheterization
Male Wistar rats weighing 275–300 g were obtained from Simonsen (Gilroy, CA) and studied at least 5 days after arrival. Animals were housed under controlled temperature (22 ± 2°C) and lighting (12-h light, 0600–1800; 12-h dark, 1800–0600) with free access to water and standard rat chow. At least 4 days before the experiment, the animals were placed in individual cages with tail restraint as previously described (16-19), which was required to protect tail blood vessel catheters during experiments. The animals were free to move about and were allowed unrestricted access to food and water. One tail vein infusion catheter was placed the day before the experiment, and one tail artery blood sampling catheter was placed in the morning of the experiment (i.e.,∼0600). This study was conducted in conformity with the Public Health Service Policy on Humane Care and Use of Laboratory Animals, and all procedures involving animals were approved by the Institutional Animal Care and Use Committee at the University of Southern California.
Experimental protocols
Experiments were conducted in the conscious state after an overnight fast; food was removed at 1700 on the day before the experiment. In the morning of the experiment, animals received a constant infusion of saline, NA (30 μmol/h), insulin (human insulin; Novo Nordisk, Bagsvaerd, Denmark; 30 pmol/kg/min), or both NA and insulin for 1.5 (phosphorylation studies; n=4 for each group) or 7 hours (gene expression studies; n=3 for each group). During the NA and/or insulin infusion, plasma glucose was maintained at basal levels (∼ 5.5 mM) by exogenous glucose infusion. At the end of the experiments, the animals were anesthetized, tissue samples (cardiac and skeletal [gastrocnemius] muscles, liver, and epididymal fat) were rapidly dissected out, frozen immediately using liquid N2-cooled aluminum blocks, and stored at −80°C for later analysis. Blood samples were collected at various time points to measure the plasma levels of glucose, insulin, and FFA.
Western blot analysis for total and phosphorylated protein levels of Akt and FOXO1
Frozen tissues (∼50 mg) were homogenized using a Tekmar homogenizer (Cincinnati, Ohio) at half-maximum speed (1 min, on ice) in 500 μl of buffer (20 mM Tris, pH 7.5, 5 mM EDTA, 10 mM Na4P2O7, 100 mM NaF, 2 mM Na3VO4, 1% NP-40, 1 mM PMSF, 10 μg/ml aprotinin, and 10 μg/ml leupeptin) (19). Tissue lysates were further solubilized by incubating at 4°C for 1h with continuous rotation and subsequently centrifuged at 14,000 g, 4°C for 20 min. The supernatants (50 μg of protein) were resolved by SDS-PAGE followed by electrophoretic transfer of the proteins onto Hybond-P membranes (Amersham, Piscataway, NJ). The membranes were then probed with rabbit antibodies against Akt, phospho-Akt (serine 473), FOXO1, or phospho-FOXO1 (serine 256) obtained from Cell Signaling Technology (Beverly, MA). After the incubations with primary antibodies, the membranes were incubated with a secondary antibody (horseradish peroxidase-conjugated anti-rabbit IgG, Amersham). Signals were then detected by an enhanced chemiluminescence method and quantified using the Bio-Rad Molecular Analyst.
Gene expression microarray analysis
Total RNA was extracted from frozen tissue samples using Tri Reagent from Molecular Research Center (Cincinnati, OH) according to the manufacturer's instructions. The RNA samples were pooled (n=3) for each group and subjected to DNA microarray analysis. The first strand cDNA was synthesized from 3 μg of total RNA using T7-oligo dT primer and SuperScript II (Invitrogen Life Technologies). Second strand cDNA was synthesized with second strand buffer (Invitrogen Life Technologies), DNA polymerase I (New England Biolabs, Inc.), DNA ligase (NEB), and RNase H (Invitrogen Life Technologies). The cDNA was used as a template and in vitro transcription was performed using the RNA Transcript Labeling Kit (Enzo Diagnostics) to produce hybridizable biotin-labeled RNA targets. After in vitro transcription, cRNA was purified using RNeasy Mini Kit (Qiagen Inc.). The cRNA was fragmented by incubating at 94°C for 35 min, after which it was applied to the Affymetrix GeneChip® Rat Genome 230 2.0 Array and hybridized at 40°C for 16 hours. The GeneChip was then washed several times and stained with streptavidine-conjugated phycoerythrin in the GeneChip Fluidics Station 400 (Affymetrix, Inc.). Finally, the chips were scanned using the Agilent Scanner (Agilent Technologies) and analyzed with GeneChip Analysis Suite 5.0 (Affymetrix, Inc.).
Northern blot analysis for muscle pyruvate dehydrogenase kinase 4 (PDK4) mRNA levels
Northern blot analysis for muscle PDK4 mRNA expression was performed as previously described (18). Briefly, electrophoresis was performed using 25 μg each of total RNA preparations in 1% denaturing gel. RNA was then transferred onto a positive charged nylon membrane (BrightStar-Plus; Ambion, Austin, TX). cDNA probes for rat PDK4 were obtained by RT-PCR using an Advantage One Step RT-PCR kit from Clontech (Palo Alto, CA) and the following primers: 5′-CGTCGCCAGAATTAAAGCTC and 3′-CTGCCAGTTTCTCCTTCGAC. The cDNA probes were labeled with [32P]dCTP (Perkin Elmer) using a DECAprime DNA labeling kit (Ambion). Hybridization was conducted at 42°C in Ultrahyb solution (Ambion), and the relative densities from the autoradiographs were quantified using the Bio-Rad Molecular Analyst.
Quantitative RT-PCR
Quantitative real-time RT-PCR for LPS-induced TNF-alpha factor (LITAF) expression in adipose tissue was performed using iCycler (Bio-Rad Laboratories, Inc., Hercules, CA) following the manufacturer's protocol. The measurement was normalized against a β actin RNA control. The primers used for LITAF were as follow: (primer pair 1) F 5′-CCA ACA TCA ACA GAC AAG GTA G-3′, R 5′-TTT AGG AGG GAG CCA GGA C-3′; (primer pair 2) F 5′-AGA GGG GGT GCC AAG CCC AA-3′, R 5′- GCG GTT GAG ACC CCA CGA GC-3′.
Other assays
Plasma glucose was analyzed using a glucose oxidase method on a Beckman Glucose Analyzer II (Beckman, Fullerton, CA). Plasma insulin was measured using a radioimmunoassay kit from Linco Research (St. Charles, MO). Plasma FFA was measured using an acyl-CoA oxidase-based colorimetric kit (Wako Chemicals Inc., Richmond, VA).
Statistical analysis
The significance of differences between groups was assessed by students' t-test or ANOVA (for multiple comparisons), followed by post hoc analysis using the Newman-Keuls multiple range test. In microarray analysis, the expression levels of probe sets and the significance of differences between groups were analyzed with Affymetrix Microarray Suite Version 5.0.
Results
Effects of NA on Akt and FOXO1 phosphorylation in insulin sensitive tissues in vivo
Rats received an infusion of saline (control) or NA (30 μmol/h) for 1.5 h, which does not alter plasma insulin levels ([18]; also see below). At the end of the 1.5-h infusions, epididymal fat, liver, cardiac and skeletal (gastrocnemius) muscle samples were taken and analyzed for total and phosphorylated Akt and FOXO1. NA infusion decreased phospho-Akt (p-Akt) in all of the insulin-sensitive tissues studied (p<0.05, Figure 1), and these changes were accompanied by similar decreases in p-FOXO1 (P<0.05 for all but liver).
Figure 1.

Representative Western blots and quantitative data showing the effects of a short (1.5 h) infusion of NA on Akt and FOXO1 phosphorylation in insulin sensitive tissues of rats in vivo. Data are means±SEM (n=4). *, P<0.05 vs. saline control.
Opposite effects of NA and insulin on Akt and FOXO1 phosphorylation in vivo
The effects of NA to decrease p-Akt and p-FOXO1 are opposite to the well-known effects of insulin to increase Akt and FOXO1 phosphorylation (11). To further evaluate this interesting finding, saline, NA, and/or insulin was infused for up to 7 h in conscious rats. NA did not alter basal plasma insulin levels, but insulin infusion increased plasma insulin levels to ∼750 pM (Figure 2). Plasma glucose was maintained at basal levels in all of the experiments by exogenous glucose infusion. Small rates of glucose infusion were necessary during the initial 2 h of the NA infusion (18). Glucose infusion was greater during the insulin infusion and was not altered by NA. Plasma FFA levels decreased during the NA or insulin infusion. When the NA and insulin infusions were combined, there were no further decreases in plasma FFA. Tissue samples were collected at different times (i.e., 1.5 and 7 h) and analyzed for Akt and FOXO1 phosphorylation (1.5 h samples) or gene expression (7 h samples). As expected, insulin had marked effects to increase p-Akt in insulin sensitive tissues (Figure 3). These effects were opposite to the effects of NA to decrease p-Akt in the basal state, i.e., without insulin infusion. However, during the insulin infusion, when plasma insulin levels were raised to ∼750 pM, NA did not affect p-Akt. It appeared that insulin dominated the influence over p-Akt at this high insulin level. Similar patterns were observed with p-FOXO1. Total Akt or FOXO1 levels were not altered by the 1.5-h infusion of insulin and/or NA (data not shown).
Figure 2.
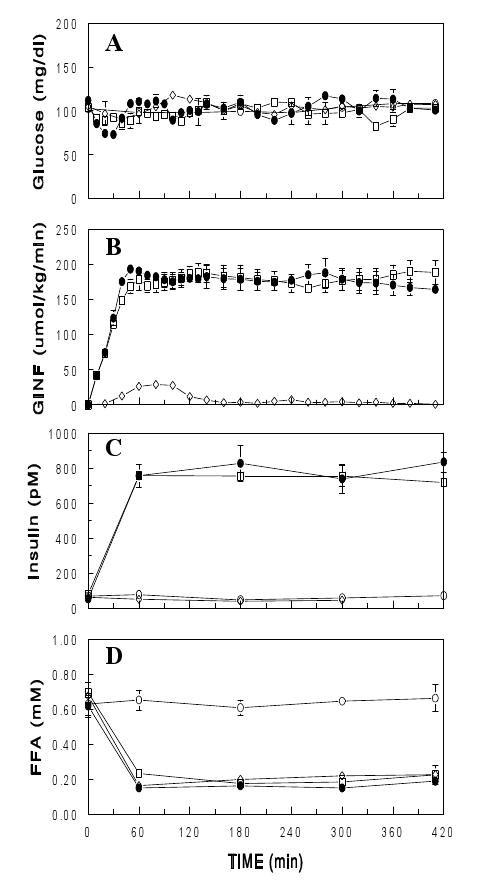
Plasma glucose (A), glucose infusion rate (GINF, B), plasma insulin (C) and FFA (D) during an infusion of saline ( ), NA (30 μmol/h; ▯), insulin (5 mU/kg/min;
  ), or both NA and insulin ( ) for 7 h in conscious rats. Data are means± SEM (n=3 for each group).
Figure 3.
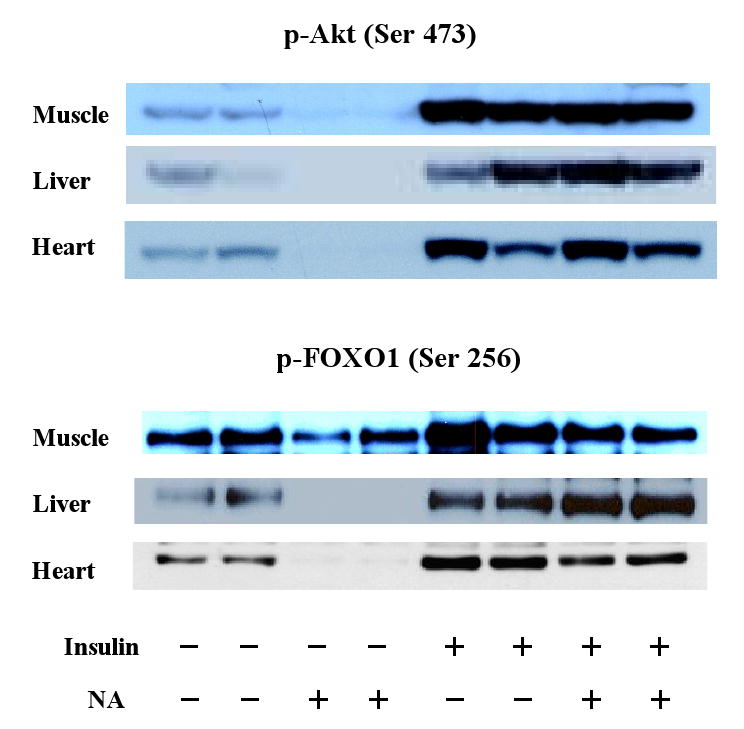
Western blots showing the effects of a short (1.5 h) infusion of NA and/or insulin on Akt and FOXO1 phosphorylation in insulin sensitive tissues.
Effects of NA and/or insulin on PDK4 mRNA expression in skeletal muscle
We examined whether the decreases in FOXO1 phosphorylation by NA, which would increase nuclear FOXO1 transcriptional activity (11), were accompanied by increases in the mRNA expression of PDK4, a FOXO1 target gene. Northern blot analysis revealed that, after the 7-h NA and/or insulin infusion, PDK4 mRNA levels in skeletal muscle were significantly altered in inverse correlation with p-FOXO1 levels (Figure 4). Thus, NA, which decreased p-FOXO1 levels, increased PDK4 mRNA levels by 45% (p<0.05), and insulin, which increased p-FOXO1, profoundly decreased PDK4 mRNA levels (p<0.05). These data are consistent with the concepts that PDK4 is a FOXO1 target gene and that FOXO1 transcriptional activity is controlled by FOXO1 phosphorylation. More importantly, these data support the notion that the NA effect on FOXO1 phosphorylation may lead to changes in gene expression, especially for FOXO1 target genes.
Figure 4.

Representative Northern blots and quantitative data showing the effects of a 7-h NA and/or insulin (I) infusion on FOXO1 target gene (i.e., PDK4) mRNA expression in gastrocnemius muscle. Equal loading was confirmed by 18S and 28S rRNA stained by ethidium bromide (data not shown). Data are means± SEM (n=3 for each group). *, P<0.05 vs. saline.
Effects of NA and/or insulin on gene expression in insulin sensitive tissues
To further evaluate the significance of the NA effects on Akt and FOXO1 phosphorylation in insulin sensitive tissues, changes in gene expression were evaluated in tissue samples (cardiac and skeletal muscles, epididymal fat, and liver) collected following the 7-h infusion of saline, NA, and/or insulin (Figure 2) using a gene expression microarray analysis. RNA was isolated from individual samples and pooled (n=3) for each of the 4 experimental groups (Figure 2). The pooled RNA samples were then subjected to microarray analysis using Affymetrix gene chips. The microarray data revealed that NA had profound effects on mRNA expression for numerous genes, and the number of genes whose mRNA expression was altered by NA exceeded the number of genes affected by insulin in skeletal muscle, fat, and liver tissues. The numbers of genes whose expression was increased or decreased more than 2-fold by NA were 306, 568, 765 in skeletal muscle, fat, and liver tissues, respectively. The corresponding numbers for insulin were 127, 132, and 331, respectively. The numbers of genes affected by NA vs. insulin were comparable in cardiac tissue (295 vs. 322). In addition, a systematic or strategic analysis of the microarray data revealed the following patterns of changes in gene expression:
There were numerous genes regulated by NA in an Akt or FOXO1-dependent manner: Our data indicated that Akt and FOXO1 phosphorylation were oppositely changed by insulin and NA (Figure 3). We analyzed the microarray data to identify genes whose expression was altered >2-fold by insulin and oppositely regulated by NA. There were 15, 19, 8, and 34 such genes identified in skeletal muscle, cardiac muscle, fat, and liver tissues, respectively. Interestingly, many of these genes encode proteins involved in energy metabolism and cellular signaling (Table 1). These genes showed expression patterns correlated positively or negatively with Akt or FOXO1 phosphorylation (Figure 3), suggesting that many of these genes may be regulated by FOXO1 and/or Akt. To support this idea, the gene list includes PDK4 (skeletal and cardiac muscles), glucose 6-phosphatase (G6Pase; liver), and IGF binding protein (fat and liver), known to be regulated by FOXO1 (20), and fatty acid synthase (fat), ATP citrate lyase (liver), 3-hydroxy-3-methylglutaryl-coenzyme A (liver), and cAMP responsive element modulator (liver), reported to be regulated by Akt (21). The opposite effects of NA and insulin on PDK4 mRNA levels were confirmed by Northern blot analysis (Figure 4).
There was a group of genes specifically regulated in adipocytes by NA: We also analyzed the microarray data to identify genes whose expression was altered specifically by NA. To enhance the specificity/reliability, we looked for genes whose expression was altered 1) profoundly (>4-fold) and 2) commonly in the NA and NA+insulin groups (vs. saline) but 3) was not affected by insulin. We found 121 genes that met these criteria. Interestingly, all of these changes occurred in fat tissue, none in liver, skeletal, or cardiac muscle, and all but one (i.e., phosphoenolpyruvate carboxykinase 1) of these genes were upregulated by NA (Table 2; see Discussion). Among these genes was LPS-induced TNF-α factor (LITAF), which mediates TNF-α transcription (22, 23). This is exciting because induction of this gene would induce TNF-α, which would in turn induce other cytokines, including interleukin 6 (IL-6) (24, 25). TNF-α and IL-6 have been shown to increase lipolysis and/or induce insulin resistance (26-28). The changes in LITAF mRNA expression were confirmed by real-time quantitative RT-PCR (Figure 5).
There was a group of genes whose expression was altered similarly by insulin and NA: We also identified genes whose expression was altered >50% commonly in the insulin, NA, and NA+insulin groups (vs. saline). The number of such genes was 76, 33, 105, and 274 in skeletal muscle, cardiac muscle, fat, and liver tissues, respectively. Since the three experimental conditions are all characterized by decreased plasma FFA levels (Figure 2), this group may represent those genes regulated by plasma FFA, possibly via peroxisome proliferator-activated receptors. This idea is supported by the finding that this group included leptin (in fat) and UCP3 (in muscle), which are known to be regulated by plasma FFA (29, 30). Interestingly, LPL, an important regulator of circulating lipids, was upregulated exclusively in skeletal muscle, and ATP-binding cassette A1 transporter, which plays a major role in the modulation of HDL particles, was upregulated in liver under all of the conditions of decreased plasma FFA (Figure 6).
Table 1.
Genes regulated oppositely by NA and insulin.
| Function | Correlation with p-FOXO1/p-Akt | |
|---|---|---|
| Negative | Positive | |
| Glucose metabolism | PDK4 (SM and heart) GLUT2 (liver) glucose 6-phosphatase (liver) |
|
| Fat Metabolism | cytosolic thioesterase 1 (fat) arachidonate 12-lipoxygenase (SM) |
fatty acid synthase (fat) DAG O-acyltransferase (fat) HMG-CoA reductase (liver) steroid 5 alpha reductase 1 (liver) |
| Mitochondrial Metabolism | mitochondria Pi transporter (liver) glutamate OAA transaminase (liver) glutaminase 2 (liver) |
mitochondria Pi transporter (SM) ATP citrate lyase (liver) cytochrome p450 (liver) |
| Cell signaling | IGF binding protein 1 (liver & fat) CBP/p300 transactivator 2 (SM) CRE modulator (liver) G0/G1 switch gene 2 (heart) |
Thyroid hormone resp. protein (liver) PP1, regular subunit 3B (liver) PP1, regular subunit 3C (SM) |
Abbreviations: PDK4, pyruvate dehydrogenase kinase 4; SM, skeletal muscle; GLUT2, glucose transporter 2; DAG, diacylglycerol; HMG-CoA, 3-hydroxy-3-methylglutaryl-coenzyme A; OAA, oxaloacetate; IGF, insulin-like growth factor; PP1, protein phosphatase 1; CRE, cAMP responsive element.
Table 2.
Number of genes whose expression was increased or decreased >4-fold by NA (vs. saline) but not affected by insulin.
| Increase | Decrease | |
|---|---|---|
| Fat | 120 | 1 |
| Liver | 0 | 0 |
| Muscle | 0 | 0 |
| Heart | 0 | 0 |
Genes induced (selected from 120):
LPS-induced TNFα factor
cystatin 8, 11, & TE-1
retinol binding protein 1, cellular
retinoic acid (RA) sensitive protein
epididymal RA-binding protein
Rho GTPase activating protein 8
serine proteinase inhibitor
serine protease inhibitor, Kazal type 5
endothelin converting enzyme-like 1
ATP-binding cassette, sub-family C
microtubule-associated protein 2
dual specificity phosphatase 5
early growth response 2
chimerin (chimaerin) 2
E1A enhancer binding protein, E1AF
gamma-glutamyltransferase 1
sialyltransferase 1
The gene downregulated: PEPCK1
Figure 5.

Effects of NA and insulin on LITAF mRNA expression in adipocytes as determined by microarray analysis (Affymetrix) and real-time quantitative RT-PCR on pooled RNA samples using two different primer sets (Primers 1 & 2).
Figure 6.
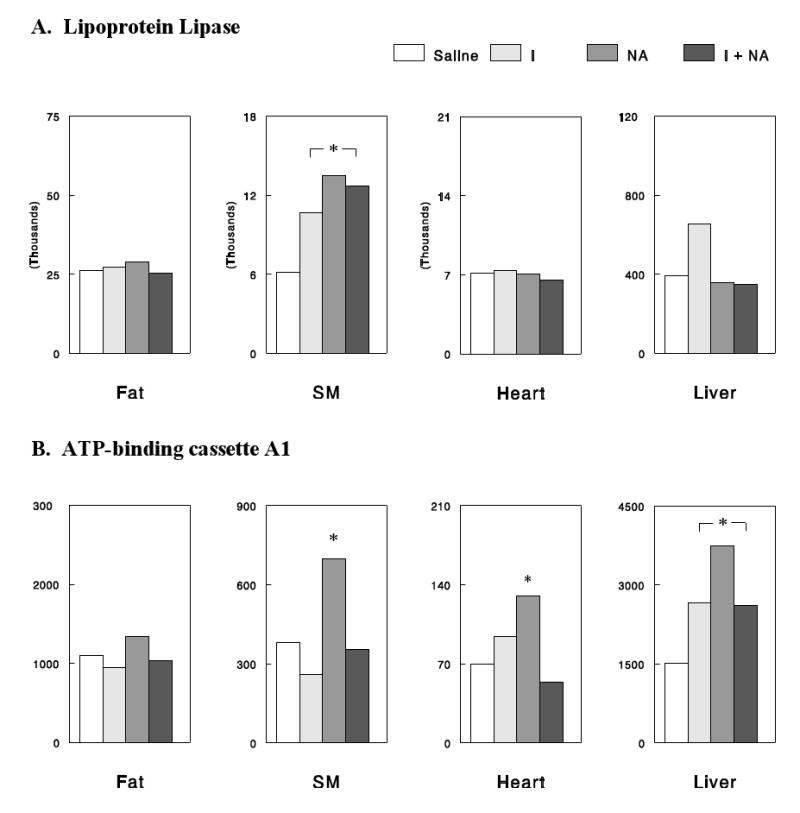
Effects of NA and/or insulin on LPL (A) and ATP-binding cassette A1, detected by microarray analysis. The Y-axis signals are the hybridization intensities in DNA microarray experiments. *, P<0.05 vs. saline control.
Discussion
In the present study we found that NA infusion had profound effects on Akt and FOXO1 phosphorylation in insulin sensitive tissues, such as liver, skeletal muscle, heart, and adipose tissue. In addition, a microarray study showed that a prolonged (i.e., 7-h) NA infusion had widespread effects on gene expression in these tissues, which appeared to occur by various mechanisms in a Akt- or FOXO1-dependent, adipose tissue-specific, or plasma FFA-dependent manner. Taken together, these data suggest that NA does more than merely decreasing plasma FFA levels (or suppressing lipolysis in adipocytes) and causes many changes in cellular signaling and gene expression in insulin sensitive tissues, providing novel insights into the mechanisms underlying wanted and unwanted effects of NA treatment as discussed below.
The effects of NA on Akt and FOXO1 phosphorylation in insulin sensitive tissues may not represent direct effects of NA in the affected tissues. First of all, the NA receptor is expressed abundantly in adipose tissue, but not in liver, heart, or skeletal muscle (31, 32). Second, NA had no significant effects on Akt and FOXO1 phosphorylation in vitro in adipose tissue explants or primary hepatocytes (data not shown). These findings suggest that an in vivo (neural or endocrine) factor might have been activated during the NA infusion and mediated the effects on Akt and FOXO1 phosphorylation. Previous human studies have shown that NA raised plasma epinephrine levels at resting states (33, 34). In addition, NA infusion in rats significantly increased plasma corticosterone levels (35). We have confirmed that NA infusion in rats, under conditions identical to the present ones, significantly increased plasma epinephrine and corticosterone levels (Oh, K, Y. Oh, C. Donovan, I. Kang, and J. Youn, unpublished data). Whether these hormonal changes are responsible for the NA effects on Akt and FOXO1 phosphorylation remains to be studied. Because Akt and FOXO1 play a key role in many important cellular processes (9, 10), future studies are warranted to elucidate the precise mechanisms by which NA decreases Akt and FOXO1 phosphorylation (and activity) in insulin sensitive tissues.
Insulin is known for its profound effects to regulate gene expression in various tissues (36). Therefore, it was rather unexpected that the number of genes affected by NA exceeded that of genes affected by insulin in most of the insulin sensitive tissues studied. However, many of the NA effects on gene expression may not represent direct effects of NA in the affected tissues. As discussed above, the NA receptor is expressed in adipose tissue, but not in the other insulin sensitive tissues (31, 32). On the other hand, NA infusion increases plasma levels of epinephrine and corticosterone (33-35), which are known to regulate gene expression in various tissues, including those evaluated in the present study. Therefore, it is conceivable that many of the NA effects on gene expression may be mediated by increases in these hormones during NA infusion. In this context, it would be interesting to study the effects of NA on gene expression in adrenalectomised rats where the epinephrine and the corticosterone responses to NA would be absent.
Microarray analysis allowed us to identify several gene groups with different patterns of expression changes among our experimental conditions. We first paid attention to the pattern in which gene expression was altered oppositely by NA and insulin with the effect of insulin dominating when both insulin and NA were infused. These changes correlate positively or negatively with the changes in Akt or FOXO1 phosphorylation induced by NA and/or insulin. Many of these genes are involved in glucose, fat, and mitochondrial metabolism or cellular signaling (Table 1), consistent with the roles of Akt or FOXO1. We believe that many of these genes are regulated by FOXO1 or Akt. This idea is supported by the finding that the gene list includes several genes known to be regulated by FOXO1 or Akt (see Results). Thus, a systematic (or strategic) analysis of the microanalysis data resulted in a list of genes predicted to be FOXO1 or Akt target genes. Future studies are warranted to directly test whether many of these genes are indeed FOXO1 or Akt target genes.
NA treatment often causes insulin resistance (7, 8), but the mechanism by which this occurs remains unclear. The present finding that NA decreases FOXO1 phosphorylation (thus activates FOXO1) in insulin sensitive tissues provides new insights into this unwanted effect of NA treatment. PDK4, a FOXO1 target gene (41, 42), plays an important role in the regulation of glucose oxidation (43, 44) and the development of insulin resistance in skeletal muscle (45). The present data demonstrate that NA increases PDK4 expression in skeletal muscle, presumably by activating FOXO1, and this effect may contribute to the development of insulin resistance during NA treatment (45). On the other hand, in hepatocytes, FOXO1 increases the transcription of key gluconeogenic enzymes/factors, including G6Pase, phosphoenolpyruvate carboxykinase (PEPCK), and PPAR-γ coactivator-1 (PGC-1) (46, 47). Therefore, FOXO1 activation in the liver may lead to increased expression of G6Pase, PEPCK, and/or PGC-1 to cause glucose overproduction and/or hepatic insulin resistance (47).
We also attempted to identify genes whose expression was altered specifically by NA. When we looked for genes whose expression was altered by >4-fold by NA but was not affected by insulin, 121 genes were identified. Interestingly, all of these changes in gene expression occurred in fat tissue, and none in liver, heart, or skeletal muscle. This confinement of the 121 independent changes to adipose tissue must be significant both statistically and physiologically. These genes may be regulated by pathways specifically activated (or inhibited) by NA through the NA receptor, which is expressed abundantly in adipose tissue but not in the other tissues (31, 32). The NA receptor is a G-protein coupled receptor. Activation of the NA receptor gives rise to an inhibitory G-protein (Gi) signal that inhibits adenylate cyclase and lowers cyclic AMP levels to reduce protein kinase (PKA) activity (1). Therefore, cAMP responsive elements and/or PKA-dependent pathways for gene regulation may be involved.
Among the 121 genes whose expression was altered by NA exclusively in adipocytes, two genes particularly attracted our attention as the effects of NA on their expressions may explain FFA rebound during NA treatment. First, PEPCK1 was downregulated whereas the other 120 genes were all upregulated. The decrease in the expression was 20-fold, and this fold change was reliable as the PEPCK1 signal on the gene chip was one of the strongest ones, and after the 20-fold decrease, the signal was still reliably detectable. In a separate study, PEPCK protein expression in adipose tissue decreased by 60% (or 2.5-fold) after a 24-h NA infusion (P<0.01 vs. saline, n=5 each), confirming the change in PEPCK mRNA expression detected in the present study. PEPCK is the key enzyme involved in glyceroneogenesis in adipocytes (37), which is an important metabolic pathway that provides glycerol 3-phosphate required for FFA reesterification (or triglyceride synthesis). FFA release from adipose tissue is determined by the balance between lipolysis and FFA reesterification. Transgenic mice that overexpress PEPCK in white adipose tissue are obese likely due to enhanced FFA reesterification and decreased FFA release (38). In addition, the antidiabetic thiazolidinedione class of compounds increase PEPCK expression in adipocytes and reduce the release of FFA from adipocytes (40). In contrast, glucocorticoids are known to decrease the expression of PEPCK in adipocytes, and this may contributes to the action of the hormone to promote FFA release from adipocytes (37). Also, interferon gamma was shown to promote FFA release from adipose tissue by decreasing PEPCK expression without affecting lipolysis (39). Taken together, these data suggest that PEPCK expression in adipocytes may be an important regulator of FFA release from these cells. In this context, our finding that NA profoundly decreases PEPCK1 expression in adipose tissue suggests the intriguing possibility that FFA rebound during long-term NA treatment may result, at least in part, from decreased PEPCK expression in adipocytes. Second, LITAF, which mediates TNF-α transcription (22, 23), was profoundly upregulated by NA. This change would subsequently induce TNF-α, which would in turn induce other cytokines, including IL-6 (24, 25). TNF-α and IL-6 are known to increase lipolysis (26), and therefore, such changes in TNF-α and/or IL-6 expression may also potentially explain FFA rebound during long-term NA treatment.
When we attempted to identify genes whose expression was altered commonly by NA and insulin, many genes involved in lipid metabolism were detected. In particular, we found that LPL was upregulated in skeletal muscle. Increased LPL expression in this major tissue would increase the rate of VLDL removal and thereby lower circulating lipid levels. Thus, the effect of NA on LPL expression (or activity) may contribute to the lipid-lowering effects of NA treatment as previously suggested (4, 6). Such an effect may explain lipid-lowering effects of NA during FFA rebound, if it occurs independent of plasma FFA or in temporal patterns different from those for plasma FFA. We also found that ATP-binding cassette A1 transporter, which plays a major role in the modulation of HDL particles (48), was upregulated in liver. This effect may be a major mechanism for the effect of NA treatment to increase in plasma HDL levels.
In conclusion, NA infusion in rats resulted in profound effects on Akt and FOXO1 phosphorylation and gene expression in insulin sensitive tissues. These data indicate that NA does more than merely decreasing plasma FFA (or suppressing lipolysis in adipocytes) and causes many changes in cellular signaling and function. Therefore, data from studies in which the role of plasma FFA is evaluated using NA should be carefully interpreted. Our microarray analysis provided potential mechanisms for wanted and unwanted effects of NA treatments, and further studies are warranted to directly test these new ideas.
Acknowledgments
This study was supported by NIH DK 080233 (to JHY) and the Basic Science Research Program through the National Research Foundation of Korea (NRF) funded by the Ministry of Education, Science and Technology (2009-0075674; to SC).
Footnotes
We have no conflicts of interest to disclose in connection with the manuscript.
Publisher's Disclaimer: This is a PDF file of an unedited manuscript that has been accepted for publication. As a service to our customers we are providing this early version of the manuscript. The manuscript will undergo copyediting, typesetting, and review of the resulting proof before it is published in its final citable form. Please note that during the production process errors may be discovered which could affect the content, and all legal disclaimers that apply to the journal pertain.
References
- 1.Karpe F, Frayn KN. The nicotinic acid receptor--a new mechanism for an old drug. Lancet. 2004;363:1892–1894. doi: 10.1016/S0140-6736(04)16359-9. [DOI] [PubMed] [Google Scholar]
- 2.Bodor ET, Offermanns S. Nicotinic acid: an old drug with a promising future. Br J Pharmacol. 2008;153:S68–S75. doi: 10.1038/sj.bjp.0707528. [DOI] [PMC free article] [PubMed] [Google Scholar]
- 3.Walldius G, Wahlberg G. Effects of nicotinic acid and its derivatives on lipid metabolism and other metabolic factors related to atherosclerosis. Adv Exp Med Biol. 1985;183:281–293. doi: 10.1007/978-1-4613-2459-1_22. [DOI] [PubMed] [Google Scholar]
- 4.Drood JM, Zimetbaum PJ, Frishman WH. Nicotinic acid for the treatment of hyperlipoproteinemia. J Clin Pharmacol. 1991;31:641–650. doi: 10.1002/j.1552-4604.1991.tb03750.x. [DOI] [PubMed] [Google Scholar]
- 5.Carlson LA, Oro L. The effect of nicotinic acid on the plasma free fatty acid; demonstration of a metabolic type of sympathicolysis. Acta Med Scand. 1962;172:641–645. doi: 10.1111/j.0954-6820.1962.tb07203.x. [DOI] [PubMed] [Google Scholar]
- 6.Capurso A. Drugs affecting triglycerides. Cardiology. 1991;78:218–225. doi: 10.1159/000174788. [DOI] [PubMed] [Google Scholar]
- 7.Kelly JJ, Lawson JA, Campbell LV, Storlien LH, Jenkins AB, Whitworth JA, O'Sullivan AJ. Effects of nicotinic acid on insulin sensitivity and blood pressure in healthy subjects. J Hum Hypertens. 2000;14:567–572. doi: 10.1038/sj.jhh.1001099. [DOI] [PubMed] [Google Scholar]
- 8.Poynten AM, Gan SK, Kriketos AD, O'Sullivan A, Kelly JJ, Ellis BA, Chisholm DJ, Campbell LV. Nicotinic acid-induced insulin resistance is related to increased circulating fatty acids and fat oxidation but not muscle lipid content. Metabolism. 2003;52:699–704. doi: 10.1016/s0026-0495(03)00030-1. [DOI] [PubMed] [Google Scholar]
- 9.Franke TF. Intracellular signaling by Akt: bound to be specific. Sci Signal. 2008;1(24):29. doi: 10.1126/scisignal.124pe29. [DOI] [PubMed] [Google Scholar]
- 10.New DC, Wu K, Kwok AW, Wong YH. G protein-coupled receptor-induced Akt activity in cellular proliferation and apoptosis. FEBS J. 2007;274:6025–6036. doi: 10.1111/j.1742-4658.2007.06116.x. [DOI] [PubMed] [Google Scholar]
- 11.Tran H, Brunet A, Griffith EC, Greenberg ME. The many forks in FOXO's road. Sci STKE. 2003;172:RE5. doi: 10.1126/stke.2003.172.re5. [DOI] [PubMed] [Google Scholar]
- 12.Duronio V. The life of a cell: apoptosis regulation by the PI3K/PKB pathway. Biochem J. 2008;415:333–344. doi: 10.1042/BJ20081056. [DOI] [PubMed] [Google Scholar]
- 13.Nakae J, Kitamura T, Silver DL, Accili D. The forkhead transcription factor Foxo1 (Fkhr) confers insulin sensitivity onto glucose-6-phosphatase expression. J Clin Invest. 2001;108:1359–1367. doi: 10.1172/JCI12876. [DOI] [PMC free article] [PubMed] [Google Scholar]
- 14.Puigserver P, Rhee J, Donovan J, Walkey CJ, Yoon JC, Oriente F, Kitamura Y, Altomonte J, Dong H, Accili D, Spiegelman BM. Insulin-regulated hepatic gluconeogenesis through FOXO1-PGC-1. Nature. 2003;423:550–555. doi: 10.1038/nature01667. [DOI] [PubMed] [Google Scholar]
- 15.Farmer SR. The forkhead transcription factor Foxo1: a possible link between obesity and insulin resistance. Mol Cell. 2003;11:6–8. doi: 10.1016/s1097-2765(03)00003-0. [DOI] [PubMed] [Google Scholar]
- 16.Kim JK, Wi JK, Youn JH. Metabolic impairment precedes insulin resistance in skeletal muscle during high fat feeding in rats. Diabetes. 1996;45:651–658. doi: 10.2337/diab.45.5.651. [DOI] [PubMed] [Google Scholar]
- 17.Kim JK, Youn JH. Prolonged suppression of glucose metabolism causes insulin resistance in rat skeletal muscle. Am J Physiol. 1997;272:E288–E296. doi: 10.1152/ajpendo.1997.272.2.E288. [DOI] [PubMed] [Google Scholar]
- 18.Lee FN, Zhang L, Zheng D, Choi WS, Youn JH. Insulin suppresses PDK-4 expression in skeletal muscle independently of plasma FFA. Am J Physiol Endocrinol Metab. 2004;287:E69–E74. doi: 10.1152/ajpendo.00461.2003. [DOI] [PubMed] [Google Scholar]
- 19.Choi CS, Kim YB, Lee FN, Zabolotny JM, Kahn BB, Youn JH. Lactate induces insulin resistance in skeletal muscle by suppressing glycolysis and impairing insulin signaling. Am J Physiol Endocrinol Metab. 2002;283:E233–E240. doi: 10.1152/ajpendo.00557.2001. [DOI] [PubMed] [Google Scholar]
- 20.Lam EW, Francis RE, Petkovic M. FOXO transcription factors: key regulators of cell fate. Biochem Soc Trans. 2006;34:722–726. doi: 10.1042/BST0340722. [DOI] [PubMed] [Google Scholar]
- 21.Porstmann T, Griffiths B, Chung YL, Delpuech O, Griffiths JR, Downward J, Schulze A. PKB/Akt induces transcription of enzymes involved in cholesterol and fatty acid biosynthesis via activation of SREBP. Oncogene. 2005;24:6465–6481. doi: 10.1038/sj.onc.1208802. [DOI] [PubMed] [Google Scholar]
- 22.Myokai F, Takashiba S, Lebo R, Amar S. A novel lipopolysaccharide-induced transcription factor regulating tumor necrosis factor alpha gene expression: molecular cloning, sequencing, characterization, and chromosomal assignment. Proc Natl Acad Sci USA. 1999;96:4518–4523. doi: 10.1073/pnas.96.8.4518. [DOI] [PMC free article] [PubMed] [Google Scholar]
- 23.Tang X, Marciano DL, Leeman SE, Amar S. LPS induces the interaction of a transcription factor, LPS-induced TNF-alpha factor, and STAT6(B) with effects on multiple cytokines. Proc Natl Acad Sci USA. 2005;102:5132–5137. doi: 10.1073/pnas.0501159102. [DOI] [PMC free article] [PubMed] [Google Scholar]
- 24.Stephens JM, Butts MD, Pekala PH. Regulation of transcription factor mRNA accumulation during 3T3-L1 preadipocyte differentiation by tumour necrosis factor-alpha. J Mol Endocrinol. 1992;9:61–72. doi: 10.1677/jme.0.0090061. [DOI] [PubMed] [Google Scholar]
- 25.Fasshauer M, Klein J, Lossner U, Paschke R. Interleukin (IL)-6 mRNA expression is stimulated by insulin, isoproterenol, tumour necrosis factor alpha, growth hormone, and IL-6 in 3T3-L1 adipocytes. Horm Metab Res. 2003;35:147–152. doi: 10.1055/s-2003-39075. [DOI] [PubMed] [Google Scholar]
- 26.Ryden M, Arvidsson E, Blomqvist L, Perbeck L, Dicker A, Arner P. Targets for TNF-alpha-induced lipolysis in human adipocytes. Biochem Biophys Res Commun. 2004;318:168–175. doi: 10.1016/j.bbrc.2004.04.010. [DOI] [PubMed] [Google Scholar]
- 27.Borst SE. The role of TNF-alpha in insulin resistance. Endocrin. 2004;23:177–182. doi: 10.1385/ENDO:23:2-3:177. [DOI] [PubMed] [Google Scholar]
- 28.Kim HJ, Higashimori T, Park SY, Choi H, Dong J, Kim YJ, Noh HL, Cho YR, Cline G, Kim YB, Kim JK. Differential effects of interleukin-6 and -10 on skeletal muscle and liver insulin action in vivo. Diabetes. 53:1060–1067. doi: 10.2337/diabetes.53.4.1060. [DOI] [PubMed] [Google Scholar]
- 29.Nisoli E, Vettor R, Tonello C, Macor C, Federspil G, Carruba MO. Nutrient channeling-regulated peroxisome proliferator-activated receptor-gamma-2 (PPARgamma-2) and leptin gene expression in human subcutaneous fat. Diabetologia. 1999;42:495–497. doi: 10.1007/s001250051186. [DOI] [PubMed] [Google Scholar]
- 30.Samec S, Seydoux J, Dulloo AG. Skeletal muscle UCP3 and UCP2 gene expression in response to inhibition of free fatty acid flux through mitochondrial beta-oxidation. Pflugers Arch. 1999;438:452–457. doi: 10.1007/s004249900080. [DOI] [PubMed] [Google Scholar]
- 31.Tunaru S, Kero J, Schaub A, Wufka C, Blaukat A, Pfeffer K, Offermanns S. PUMA-G and HM74 are receptors for nicotinic acid and mediate its anti-lipolytic effect. Nat Med. 2003;9:352–355. doi: 10.1038/nm824. [DOI] [PubMed] [Google Scholar]
- 32.Wise A, Foord SM, Fraser NJ, Barnes AA, Elshourbagy N, Eilert M, Ignar DM, Murdock PR, Steplewski K, Green A, Brown AJ, Dowell SJ, Szekeres PG, Hassall DG, Marshall FH, Wilson S, Pike NB. Molecular identification of high and low affinity receptors for nicotinic acid. J Biol Chem. 2003;278:9869–9874. doi: 10.1074/jbc.M210695200. [DOI] [PubMed] [Google Scholar]
- 33.Watt MJ, Southgate RJ, Holmes AG, Febbraio MA. Suppression of plasma free fatty acids upregulates peroxisome proliferator-activated receptor (PPAR) alpha and delta and PPAR coactivator 1alpha in human skeletal muscle, but not lipid regulatory genes. J Mol Endocrinol. 2004;33:533–544. doi: 10.1677/jme.1.01499. [DOI] [PubMed] [Google Scholar]
- 34.O'Neill M, Watt MJ, Heigenhauser GJ, Spriet LL. Effects of reduced free fatty acid availability on hormone-sensitive lipase activity in human skeletal muscle during aerobic exercise. J Appl Physiol. 2004;97:1938–1945. doi: 10.1152/japplphysiol.01135.2003. [DOI] [PubMed] [Google Scholar]
- 35.Pereira JN. The plasma free fatty acid rebound induced by nicotinic acid. J Lipid Res. 1967;8:239–244. [PubMed] [Google Scholar]
- 36.O'Brien RM, Streeper RS, Ayala JE, Stadelmaier BT, Hornbuckle LA. Insulin-regulated gene expression. Biochem Soc Trans. 2001;29:552–558. doi: 10.1042/bst0290552. [DOI] [PubMed] [Google Scholar]
- 37.Forest C, Tordjman J, Glorian M, Duplus E, Chauvet G, Quette J, Beale EG, Antoine B. Fatty acid recycling in adipocytes: a role for glyceroneogenesis and phosphoenolpyruvate carboxykinase. Biochem Soc Trans. 2003;31:1125–1129. doi: 10.1042/bst0311125. [DOI] [PubMed] [Google Scholar]
- 38.Franckhauser S, Muñoz S, Pujol A, Casellas A, Riu E, Otaegui P, Su B, Bosch F. Increased fatty acid re-esterification by PEPCK overexpression in adipose tissue leads to obesity without insulin resistance. Diabetes. 2002;51:624–630. doi: 10.2337/diabetes.51.3.624. [DOI] [PubMed] [Google Scholar]
- 39.Khazen W, Distel E, Collinet M, Chaves VE, M'Bika JP, Chany C, Achour A, Benelli C, Forest C. Acute and selective inhibition of adipocyte glyceroneogenesis and cytosolic phosphoenolpyruvate carboxykinase by interferon gamma. Endocrinology. 2007;148:4007–4014. doi: 10.1210/en.2006-1760. [DOI] [PubMed] [Google Scholar]
- 40.Tordjman J, Chauvet G, Quette J, Beale EG, Forest C, Antoine B. Thiazolidinediones block fatty acid release by inducing glyceroneogenesis in fat cells. J Biol Chem. 2003;278:18785–18790. doi: 10.1074/jbc.M206999200. [DOI] [PubMed] [Google Scholar]
- 41.Kwon HS, Huang B, Unterman TG, Harris RA. Protein kinase B-alpha inhibits human pyruvate dehydrogenase kinase-4 gene induction by dexamethasone through inactivation of FOXO transcription factors. Diabetes. 2004;53:899–910. doi: 10.2337/diabetes.53.4.899. [DOI] [PubMed] [Google Scholar]
- 42.Furuyama T, Kitayama K, Yamashita H, Mori N. Forkhead transcription factor FOXO1 (FKHR)-dependent induction of PDK4 gene expression in skeletal muscle during energy deprivation. Biochem J. 2003;375:365–371. doi: 10.1042/BJ20030022. [DOI] [PMC free article] [PubMed] [Google Scholar]
- 43.Wu P, Inskeep K, Bowker-Kinley MM, Popov KM, Harris RA. Mechanism responsible for inactivation of skeletal muscle pyruvate dehydrogenase complex in starvation and diabetes. Diabetes. 1999;48:1593–1599. doi: 10.2337/diabetes.48.8.1593. [DOI] [PubMed] [Google Scholar]
- 44.Sugden MC, Bulmer K, Holness MJ. Fuel-sensing mechanisms integrating lipid and carbohydrate utilization. Biochem Soc Trans. 2001;29:272–278. doi: 10.1042/0300-5127:0290272. [DOI] [PubMed] [Google Scholar]
- 45.Majer M, Popov KM, Harris RA, Bogardus C, Prochazka M. Insulin downregulates pyruvate dehydrogenase kinase (PDK) mRNA: potential mechanism contributing to increased lipid oxidation in insulin-resistant subjects. Mol Genet Metab. 1998;65:181–186. doi: 10.1006/mgme.1998.2748. [DOI] [PubMed] [Google Scholar]
- 46.Daitoku H, Yamagata K, Matsuzaki H, Hatta M, Fukamizu A. Regulation of PGC-1 promoter activity by protein kinase B and the forkhead transcription factor FKHR. Diabetes. 2003;52:642–649. doi: 10.2337/diabetes.52.3.642. [DOI] [PubMed] [Google Scholar]
- 47.Altomonte J, Richter A, Harbaran S, Suriawinata J, Nakae J, Thung SN, Meseck M, Accili D, Dong H. Inhibition of Foxo1 function is associated with improved fasting glycemia in diabetic mice. Am J Physiol Endocrinol Metab. 2003;285:E718–E728. doi: 10.1152/ajpendo.00156.2003. [DOI] [PubMed] [Google Scholar]
- 48.Marcil M, O'Connell B, Krimbou L, Genest J., Jr High-density lipoproteins: multifunctional vanguards of the cardiovascular system. Expert Rev Cardiovasc Ther. 2004;2:417–430. doi: 10.1586/14779072.2.3.417. [DOI] [PubMed] [Google Scholar]