

Abstract
A commercially available spectrometer has been modified to perform plasmon waveguide resonance (PWR) spectroscopy over a broad spectral bandwidth. When compared to surface plasmon resonance (SPR), PWR has the advantage of allowing measurements in both s- and p-polarizations on a waveguide surface that is silica or glass rather than a noble metal. Here the waveguide is a BK7 glass slide coated with silver and silica layers. The resonance wavelength is sensitive to the optical thickness of the medium adjacent to the silica layer. The sensitivity of this technique is characterized and compared with broadband SPR both experimentally and theoretically. The sensitivity of spectral PWR is comparable to that of spectral SPR for samples with refractive indices close to that of water. The hydrophilic surface of the waveguide allows supported lipid bilayers to be formed spontaneously by vesicle fusion; in contrast, the surface of an SPR chip requires chemical modification to create a supported lipid membrane. Broadband PWR spectroscopy should be a useful technique to study biointerfaces, including ligand binding to transmembrane receptors and adsorption of peripheral proteins on ligand-bearing membranes.
Index Headings: Planar waveguide, Plasmon waveguide resonance, PWR, Planar supported lipid bilayer, Surface plasmon resonance, SPR
INTRODUCTION
Planar integrated optical waveguides have been widely used in a variety of experimental configurations for optical characterization of organic thin films.1–5 Typically both the waveguide and cladding are composed of dielectric materials.6–8 Lawall and Knoll9 described a configuration in which guided modes are launched into a mica waveguiding layer through a 50 nm Au cladding layer using the Kretschmann configuration.10 A difference of one monolayer (approximately 1 nm) in the thickness of the mica planar waveguide could be detected by measuring shifts in incidence angles at which the guided modes were excited.11 Salamon et al.12 have developed silica planar waveguides clad with Ag on one side for measuring the optical properties (thickness, complex refractive index) of thin organic films coated on the opposite side. This technique, known as plasmon waveguide resonance (PWR) spectroscopy, has been used to detect mass density and conformational changes in artificial lipid membranes, including protein–ligand binding and conformational changes in reconstituted transmembrane proteins.13–18 Several other groups have fabricated metal-clad planar waveguides and utilized them for detection of a variety of different types of chemical and biological events at waveguide surfaces.19–22
Plasmon waveguide resonance is similar to surface plasmon resonance (SPR) spectroscopy, another label-free technique that has been widely used for measuring optical parameters of thin films on noble metal surfaces.23–25 SPR has been employed extensively for studies of model biointerfaces, e.g., monitoring binding of soluble ligands to surface-bound receptors.26,27 In terms of instrumental configuration, two major types of SPR are practiced: (1) In angular mode, the shift of the incidence angle at which surface plasmons are excited at the noble metal/dielectric interface is monitored using a monochromatic light source. (2) In spectral mode, the resonant wavelength at which surface plasmons are excited is monitored using a polychromatic light source incident at a fixed angle. Unlike SPR, PWR has been implemented nearly exclusively in the angular mode. The exception is a recent paper by Qi et al.,28 who coated a porous TiO2 guiding layer on Au and measured the resonance wavelengths of the leaky modes using a broadband light source. They showed that refractive index differences in solutions adjacent to the TiO2 could be sensitively detected as shifts in the resonant wavelengths.
In this paper, we describe the modification of a commercially available waveguide spectrometer to perform spectral PWR using a single-mode SiO2 waveguide coated on a thin Ag layer. Broadband reflectance is monitored for both bulk solutions and thin film samples, and these results are compared to theoretical predictions of sensitivity. Spectral PWR is also compared experimentally and theoretically to spectral SPR. The use of spectral PWR to probe biointerfaces, in this case vesicle fusion to form a lipid bilayer, is demonstrated.
EXPERIMENTAL
Materials
L-α-phosphatidylcholine (egg, chicken) (EggPC) and 1-palmitoyl-2-[6-[(7-nitro-2–1,3-benzoxadiazol-4-yl)ami-no]hexanoyl]-sn-glycero-3-phosphocholine (NBD-PC) were purchased from Avanti Polar Lipids. The deionized water used in experiments, hereafter referred to as DI water, was obtained from a Barnstead Nanopure system with a measured resistivity of 18.0 MΩ·cm or higher. Calibration solutions of varying refractive index were prepared by dissolving sucrose in DI water at weight percents of 0.0%, 1.0%, 2.0%, 4.0%, and 5.0% (refractive indices are 1.3330, 1.3344, 1.3359, 1.3388, and 1.3403, respectively).29
Substrates
Waveguides were fabricated by coating BK7 glass slides (1 sq. inch × 1 mm; Esco Products) with 55 nm ± 10 nm of Ag and then 450 nm ± 50 nm of silicon dioxide by electron beam induced deposition (Evaporated Coatings Inc., Willow Grove, PA). The waveguides were cleaned by bath sonication (Branson 2210) in 2% Micro 90® cleaning solution (International Products Corporation) for 45 min, followed by sonication in water for 30 min, thorough rinsing with DI water, and then drying under a N2 stream. This cleaning procedure was carried out immediately before use. Glass slides (plain, precleaned, 25 × 75 × 1 mm, VWR) for fluorescence recovery after photobleaching (FRAP) studies were cleaned as follows: slides were rubbed with 1% Liqui-Nox (Alconox) using a cotton pad, then bath sonicated for 15 minutes in absolute ethanol, 15 minutes in 2% Micro 90® solution, and then 15 minutes in DI water. They were blown dry with N2 and then cleaned in an air plasma (Harrick PDC-3XG) at 30 W at room temperature for 45 seconds immediately before use.
Supported Lipid Bilayers
Chloroform solutions of EggPC were dried under flowing Ar, followed by vacuum drying for four hours, and then resuspension at 0.5 mg/mL in DI water. For FRAP experiments, ~5 mol % NBD-PC was added to the EggPC before drying. The solutions were briefly vortexed and then ultrasonicated (Branson Sonifier 450 or Heat Systems Ultrasonics W-380 processor) until they were clear, at 25 °C for PWR experiments and 25–35 °C for FRAP experiments, forming small unilamellar vesicles (SUVs). Vesicle fusion was used to deposit supported lipid bilayers on waveguides and glass slides. For PWR experiments, 9 mL of SUV solution was introduced into the PWR cell at a flow rate of 1 mL/min and incubated in the cell for 30 minutes. DI water was then pumped through the cell at 0.4 mL/min to remove unfused vesicles. For FRAP experiments, the substrate (glass slide or waveguide) was exposed to an SUV solution for 30 min and then rinsed with DI water to remove unfused vesicles without exposing the substrate to air.
Spectral Plasmon Waveguide Resonance
Spectral PWR was performed by modification of a SIS-5000 spectrometer (System Instruments, Tokyo, Japan). Figure 1 shows a schematic diagram of the instrument configuration and the waveguide structure; the latter is similar to that used by Salamon et al.12 The waveguide is coupled to a BK7 right-angle prism (Edmund Optics) using index-matching fluid (RI = 1.515) (Cargille Laboratories). Light from a halogen lamp is launched into waveguide modes using the Kretschmann configuration.10 Optical fibers are used to direct light from the lamp to the prism and collect the reflected light, which is spectrally dispersed and detected at a charge-coupled device (CCD). A polarizer is used to select either s- or p- polarization. The optical fibers are attached to arms that can be individually adjusted over an angular range of 0 to 55 degrees relative to the waveguide surface plane. A custom-fabricated flow cell with a total volume of 0.5 mL is attached to the prism hypotenuse and the entire assembly is mounted in the spectrometer. Changes in the optical parameters of thin films coated on the silica waveguide (or bulk solutions in contact with the waveguide) alter the effective indices of the guided modes, which are measured as a shift in the wavelength of minimum reflectance. The minimum wavelength shift that can be measured with the SIS-5000 spectrometer is 0.2 nm.
Fig. 1.

Schematic diagram of (top) the spectral PWR instrument and (bottom) the waveguide structure (not to scale). The optical fibers used to direct light to the prism and collect reflected light are not shown. The polychromator used to spectrally disperse light onto the CCD is also not shown.
Measurements on the series of sucrose solutions were performed by pumping each solution through the cell while monitoring the reflectivity spectrum. Calibration spectra were acquired after the resonance minimum ceased shifting to longer wavelengths (i.e., a steady-state was reached). The experiment was then repeated for successively higher concentration solutions. A similar procedure was followed in experiments involving supported lipid bilayers. Spectra were acquired at steady state, which was reached after a volume of DI water sufficient to remove unfused lipid vesicles was pumped through the flow cell.
Atomic Force Microscopy Imaging and Fluorescence Recovery After Photobleaching Measurements
A Digital Instruments Dimension 3100 was used in tapping mode to acquire 5 μm × 5 μm images in air of a cleaned waveguide. MikroMasch tips (NSC15/no Al) with an average resonance frequency of 325 kHz and an average force constant of 40 N/m were used.
The FRAP measurements were performed using a Nikon Eclipse TE2000-U microscope. Glass slides were mounted in a custom epi-fluorescence cell with two solution compartments. NBD-PC doped and undoped supported lipid bilayers were formed in the two compartments to allow for background subtraction. Measurements on waveguides were performed with the bilayer facing the objective because the Ag cladding layer is not transparent. Samples were photobleached in an epi-illumination geometry using the 488 nm line of a Coherent Innova 70 Ar+ at a power of ~100 mW, measured before the objective, for a period of <1 s. Pre- and post-bleach emission intensities were measured by epi-fluorescence excited with a mercury arc lamp and detected with a Princeton Instruments CCD camera controlled by an ST-133 controller using Winspec/32 software. 40× and 20× DIC objectives were used for glass slides and waveguides, respectively. The laser intensity profile was Gaussian with a half-width at 1/e2 of 19–40 μm that was calculated from the first image after photobleaching. Regions of interest (ROIs) inside (Iin) and outside (Iout) the bleached spot were monitored before and after photobleaching to determine the diffusion coefficients and percent recoveries of the lipid bilayers. To normalize recovery curves, the intensity ratio (F = Iin/Iout) immediately before bleaching was set to 1 and the intensity ratio immediately after bleaching was set to zero. Intensity ratio versus time curves (t = 0 at bleach time) were fit using least squares regression to a single exponential of the form
| (1) |
where F(t) is the intensity ratio of the bleached ROI/unbleached ROI, A and B are fit parameters (% recovery = [A/(1 − B)]100), t is time, and τ is the time constant. The diffusion coefficient D was determined from30
| (2) |
where γD is a correction factor incorporating the bleach depth (determined to be 1.1 in all cases), ω is the beam half-width at 1/e2, and τ1/2 is the half-time for recovery as fit to an exponential (τ1/2 = ln 2/τ).
RESULTS AND DISCUSSION
Sensitivity of Spectral Plasmon Waveguide Resonance
Plasmon waveguide resonance spectroscopy of bulk sucrose solutions with known refractive indices was performed to assess instrument response and sensitivity. Resonance curves were acquired at an incident angle of 62.39° in p-polarization and 65.73° in s-polarization (relative to the waveguide surface normal) because it was found that these angles yielded bands with the smallest full width at half-maximum (FWHM), respectively. In Figs. 2a and 2b are shown typical p- and s-polarized PWR spectra of 2% and 4% sucrose solutions. The shifts in the spectral resonance minima result from the refractive index difference (from 1.3359 to 1.3388). Measured resonance wavelengths of sucrose solutions are plotted versus respective refractive indices in Figs. 2c and 2d. The sensitivities (slopes) were found to be 3860 nm/RIU in p-polarization and 998 nm/RIU in s-polarization (RIU = refractive index units). In addition to smaller shifts per RIU, s-polarized spectra exhibited smaller changes in reflectivity across the spectral region of interest. These sensitivity values, along with calculated values and literature data (described below), are listed in Table I.
Fig. 2.

(a) Experimental PWR spectra for 2% sucrose (n = 1.3359, curve 1) and 4% sucrose (n = 1.3388, curve 2) in p-polarization. (b) Sensitivity curve in p-polarization (y = 3860.4x − 4499.4, R2 = 0.9953). In (c) and (d) are shown the corresponding plots in s-polarization (y = 998.39x − 694.8, R2 = 0.9454). The s-polarized spectra exhibit smaller changes in reflectivity across the spectral region of interest, which makes the noise (i.e., the fluctuations in the spectral regions of higher reflectivity) appear greater than that in the p-polarized spectra; however, the noise levels in s and p are actually equivalent.
TABLE I.
Comparison of PWR and SPR spectral sensitivities.
| Technique | Experimental sensitivity (nm/RIU) | Calculated sensitivity (nm/RIU) |
|---|---|---|
| Spectral PWR | ||
| p-polarization | 3860a | 5342a |
| s-polarization | 998a | 1585a |
| Spectral SPR | ||
| p-polarization | 3100–8800b, 3450c | 882–6625a,d |
| s-polarization | NA | NA |
This work. Input parameters for calculated values are given in the text.
From Ref. 41. Measured using bulk samples with refractive indices ranging from approximately 1.33 to 1.37 within the wavelength range of 680–930 nm. The range of values indicates that the slope of the sensitivity curve is lower (3100) at indices near 1.33 and higher (8800) at indices near 1.37.
From Ref. 41. Measured using bulk samples with refractive indices close to that of water (range of 1.33 ± 0.00015).
The range of values indicates that the slope of the sensitivity curve is lower (882) at indices near 1.33 and higher (6625) at indices near 1.34.
Theoretical responses were calculated for comparison to the experimental measurements. The Pascal® program NPhase Fresnel, developed by Corn and co-workers for calculating angular SPR curves,31 was modified according to Hansen32 to calculate PWR responses in spectral mode. PWR spectra were calculated over 500–800 nm for a semi-infinitely thick BK7 substrate coated with 55 nm Ag (n = 0.0666 + 4.045i at 632.8 nm16) and 450 nm SiO2 layers (n = 1.457 at 632.8 nm33) with collimated light incident at a fixed angle of 62.39° in p-polarization and 65.73° in s-polarization. These angles matched those used in the measurements on sucrose solutions described above. To simplify the calculations, the dispersion of the refractive index across 500–800 nm was not considered, meaning that n of each phase at 632.8 nm was assumed to be constant over the wavelength range.
Spectra were calculated for bulk solutions with refractive indices varying from 1.3330 to 1.3403. Plots of resonance wavelength versus refractive index are shown in Fig. 3. The theoretical sensitivity in p-polarization is 5342 nm/RIU while in s-polarization it is 1585 nm/RIU. Thus, the experimental sensitivity is 60–75% of that predicted theoretically. In addition, the spectral profiles differ: for example, the FWHM of the measured PWR spectra of 2% sucrose (Fig. 2) was 20.9 nm in p-polarization and 9.0 nm in s-polarization, whereas for the corresponding theoretical spectra (not shown) they were 7.6 nm in p-polarization and 1.4 nm in s-polarization.
Fig. 3.

Calculated sensitivity curves for spectral PWR in (a) p-polarization and (b) s-polarization.
Several factors are likely contributors to these differences: (1) The nominal thicknesses of the waveguide layers (55 nm for Ag, 450 nm for SiO2) and bulk values for the refractive indices of these materials were used in the calculations. The actual values may be different. (2) The calculations assume that the incident light beam is truly collimated. (3) The calculations do not account for surface roughness at interfaces in the waveguide structure. Surface roughness causes scattering, which can broaden the spectral bands and attenuate sensitivity.34,35 AFM was performed on the waveguides used here to assess surface morphology. A typical image of a 5 μm × 5 μm scan area (Fig. 4) shows that the surface is composed of granule-like structures having an apparent average diameter and height of 70–120 nm and 2–3 nm, respectively. The root mean square roughness averaged over three scans is 2.0 ± 0.6 nm, considerably greater than the sub-nm surface roughness characteristic of ultra low-loss planar waveguides.36
Fig. 4.
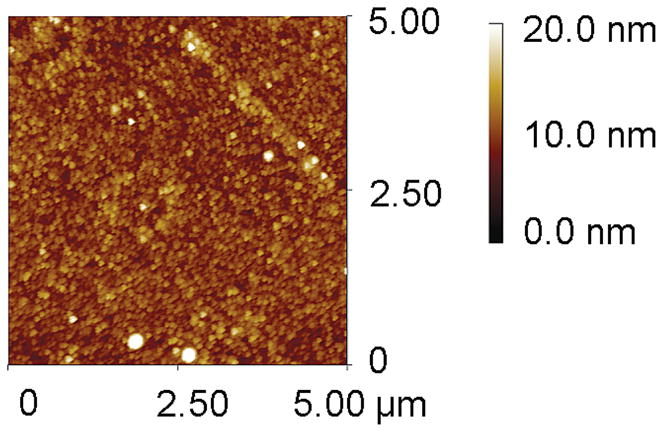
AFM image of the surface of a SiO2 waveguide. The image area is 5 μm by 5 μm and the scale bar is 20 nm.
The sensitivity of spectral PWR can be compared to that of spectral SPR. In the latter case, the response is nonlinear for bulk solutions with refractive indices near that of water. This effect is well known.37–41 For example, Jung et al.41 measured SPR spectra of bulk solutions with n = 1.33–1.37 in a Kretschmann configuration using a 50 nm Au layer coated on glass. Their measured sensitivity curve was nonlinear with a slope of 3100 nm/RIU at the low end of the refractive index range, increasing to a slope of 8800 nm/RIU at the higher end of the range. A linear fit to a small range near n = 1.33 yielded a slope of 3400 nm/RIU, which is slightly less than that of p-polarized spectral PWR as implemented in this work.
For comparison, p-polarized SPR spectra were calculated for bulk solutions with refractive indices varying from 1.3344 to 1.3403 over the range of 500–800 nm. The following parameters were assumed: a semi-infinitely thick fused silica substrate coated with a 45 nm thick Au layer (n = 0.1726 + 3.4218i at 632.8 nm31) and collimated light incident at a fixed angle of 56.8°, which is the calculated resonance angle at 632.8 nm and a commonly used wavelength for SPR measurements that lies close to the center of the wavelength range. To simplify the calculations, the dispersion of the refractive index across 500–800 nm was not considered. Consistent with prior theoretical and experimental work,37–41 the calculated sensitivity curve is nonlinear (data not shown), with a slope of 882 for refractive indices near 1.33 and a slope of 6625 for refractive indices near 1.34. Overall these calculations are consistent with prior work and support the experimental finding that the sensitivity of spectral PWR is comparable to that of spectral SPR for samples having a refractive index close to that of water.
Biomembrane Formation Monitored with Spectral Plasmon Waveguide Resonance
Surface sensitive spectroscopic techniques have been used frequently to study artificial lipid membranes.42,43 In SPR, modification of the metal substrate surface or the lipid itself is usually needed to form a planar supported lipid bilayer.44–46 In PWR, the SiO2 layer functions both as the waveguide and as a hydrophilic material on which vesicle fusion occurs to form a supported lipid bilayer. Lipid membranes have been prepared for angular mode PWR studies by “painting” a solution of lipid dissolved in organic solvents across an aperture suspended above the waveguide.47 In contrast, vesicle fusion is a solvent-free method and was used here to form supported membranes.
In Fig. 5a are shown experimental p-polarized PWR spectra before and after fusion of an EggPC lipid bilayer. Membrane formation caused a 3.0 nm ± 0.32 nm (n = 3) shift in the resonance minimum. Assuming a bilayer thickness of 5 nm and n = 1.45, the theoretically calculated spectral shift is 6.3 nm (Fig. 5b). The FWHM of the measured spectra was 18 ± 2 nm, whereas for the theoretical spectra it was 7.1 nm (water) and 7.3 nm (lipid bilayer). The factors that are likely contributors to the differences between the experimental and theoretical spectra were discussed above. For comparison, the calculated spectral SPR shift for a bilayer is 27.1 nm using the parameters given above. The greater shift for spectral SPR is due to the fact that its sensitivity increases as the refractive index of the sample increases.41
Fig. 5.

(a) Experimental p-polarized PWR spectra before (curve 1) and after (curve 2) fusion of a planar supported lipid membrane on the waveguide. (b) Theoretical spectra corresponding to formation of a 5 nm thick lipid bilayer (n = 1.45) on the waveguide.
The 3 nm shift measured using PWR indicates that a lipid film was deposited on the SiO2 waveguide surface but does not confirm formation of an extended, fluid membrane. FRAP was therefore used to determine whether lateral diffusion of fluorescent lipids occurs in membranes formed on waveguide surfaces. Typical recovery curves for supported bilayers on waveguides and glass microscope slides (a reference substrate) are shown in Fig. 6. On waveguides, the diffusion coefficient D was 1.1 ± 0.57 μm2/s with a recovery of 79 ± 9.6% (n = 5). The observation of significant lipid mobility shows that waveguide-supported lipid films are not composed predominately of adsorbed vesicles (for which the percent recovery would be minimal).48 For supported bilayers on glass slides, D was 2.7 ± 0.60 μm2/s with 93 ± 6.4% recovery (n = 9), which is within the range of values for glass-supported lipid bilayers reported in the literature.44,48–50 The smaller D on the waveguide surface is likely due to its surface roughness, which is about 5–10 times greater than that of glass.50–51 Taken together, the spectral PWR and FRAP results indicate that vesicle fusion to form a supported fluid lipid bilayer occurs on the waveguide substrates.
Fig. 6.

Typical FRAP curves for planar supported lipid bilayers of EggPC containing 0.5 mol % NBD-PC on a waveguide (◆) and glass (▲). The solid lines indicate least squares fits of the data to Eq. 1.
CONCLUSION
Plasmon waveguide resonance spectroscopy has been developed on a commercially available waveguide spectrometer. Unlike SPR, measurements can be made in both p- and s-polarizations, a property that may be useful for probing optically anisotropic samples. Spectral PWR has sensitivity comparable to that of spectral SPR for samples having a refractive index close to that of water. Fluid lipid bilayers can be formed by vesicle fusion directly on PWR substrates, in contrast to the noble metals used in SPR. Thus, broadband PWR spectroscopy should be useful for studying interactions at model biomembranes, such as protein–ligand binding.
Acknowledgments
This material is based upon work supported by the National Science Foundation under Grant No. CHE-0518702 and the National Institutes of Health under Grant No. EB007047. Any opinions, findings, and conclusions or recommendations expressed in this material are those of the authors and do not necessarily reflect the views of the National Science Foundation or the National Institutes of Health. H.Z. was partially supported by a TRIF Photonics Initiative Graduate Fellowship.
References
- 1.Rabolt JF, Schlotter NE, Swalen JD. J Phys Chem. 1981;85:4141. [Google Scholar]
- 2.Rabolt JF, Swalen JD. Structure and Orientation in Thin Films: Raman Studies with Integrated Optical Techniques. In: Clark RJH, Hester RE, editors. Spectroscopy of Surfaces. Chap 1 Wiley; Chichester: 1988. [Google Scholar]
- 3.Saavedra SS, Reichert WM. Langmuir. 1991;7:995. [Google Scholar]
- 4.Bohn PW. Prog Anal Spectrosc. 1989;12:41. [Google Scholar]
- 5.Lukosz W. Sens Actuators, B. 1995;29:37. [Google Scholar]
- 6.Saavedra SS, Reichert WM. Appl Spectrosc. 1990;44:1210. [Google Scholar]
- 7.Skrdla PJ, Saavedra SS, Armstrong NR, Mendes SB, Peyghambarian N. Anal Chem. 1999;71:1332. doi: 10.1021/ac980795g. [DOI] [PubMed] [Google Scholar]
- 8.Bradshaw JT, Mendes SB, Saavedra SS. Anal Chem. 2002;74:1751. doi: 10.1021/ac011112r. [DOI] [PubMed] [Google Scholar]
- 9.Lawall R, Knoll W. J Appl Phys. 1994;76:5764. [Google Scholar]
- 10.Kretschmann E. Z Physik. 1971;241:313. [Google Scholar]
- 11.Knoll W. Annu Rev Phys Chem. 1998;49:569. doi: 10.1146/annurev.physchem.49.1.569. [DOI] [PubMed] [Google Scholar]
- 12.Salamon Z, Tollin G. Spectroscopy. 2001;15:161. [Google Scholar]
- 13.Alves ID, Salgado GFJ, Salamon Z, Brown MF, Tollin G, Hruby VJ. Biophys J. 2005;88:198. doi: 10.1529/biophysj.104.046722. [DOI] [PMC free article] [PubMed] [Google Scholar]
- 14.Salamon Z, Cowell S, Varga E, Yamamura HI, Hruby VJ, Tollin G. Biophys J. 2000;79:2463. doi: 10.1016/S0006-3495(00)76489-7. [DOI] [PMC free article] [PubMed] [Google Scholar]
- 15.Subramaniam V, Alves ID, Salgado GFJ, Lau PW, Wysocki RJ, Salamon Z, Tollin G, Hruby VJ, Brown MF, Saavedra SS. J Am Chem Soc. 2005;127:5320. doi: 10.1021/ja0423973. [DOI] [PubMed] [Google Scholar]
- 16.Salamon Z, Macleod HA, Tollin G. Biophys J. 1997;73:2791. doi: 10.1016/S0006-3495(97)78308-5. [DOI] [PMC free article] [PubMed] [Google Scholar]
- 17.Salamon Z, Tollin G. Biophys J. 1996;71:848. doi: 10.1016/S0006-3495(96)79286-X. [DOI] [PMC free article] [PubMed] [Google Scholar]
- 18.Salamon Z, Tollin G. Biophys J. 2001;80:1557. doi: 10.1016/S0006-3495(01)76128-0. [DOI] [PMC free article] [PubMed] [Google Scholar]
- 19.Osterfeld M, Franke H, Feger C. Appl Phys Lett. 1993;62:2310. [Google Scholar]
- 20.Zourob M, Mohr S, Fielden PR, Goddard NJ. Sens Actuators, B. 2003;94:304. [Google Scholar]
- 21.Lau KHA, Tan LS, Tamada K, Sander MS, Knoll W. J Phys Chem B. 2004;108:10812. [Google Scholar]
- 22.Zourob M, Simonian A, Wild J, Mohr S, Fan X, Abdulhalim I, Goddard NJ. Analyst. Vol. 132. Cambridge, U.K: 2007. p. 114. [DOI] [PubMed] [Google Scholar]
- 23.Phillips KS, Wilkop T, Wu JJ, Al-Kaysi RO, Cheng Q. J Am Chem Soc. 2006;128:9590. doi: 10.1021/ja0628102. [DOI] [PubMed] [Google Scholar]
- 24.Fujii N, Hisano T, Fujii N. Biochim Biophys Acta, Proteins Proteomics. 2008;1784:1507. doi: 10.1016/j.bbapap.2008.06.010. [DOI] [PubMed] [Google Scholar]
- 25.Fonfria ES, Vilarino N, Campbell K, Elliott C, Haughey SA, Ben-Gigirey B, Vieites JM, Kawatsu K, Botana LM. Anal Chem. 2007;79:6303. doi: 10.1021/ac070362q. [DOI] [PubMed] [Google Scholar]
- 26.Mandenius CF, Wang RH, Alden A, Bergstrom G, Thebault S, Lutsch C, Ohlson S. Anal Chim Acta. 2008;623:66. doi: 10.1016/j.aca.2008.06.005. [DOI] [PubMed] [Google Scholar]
- 27.Phillips KS, Cheng Q. Anal Bioanal Chem. 2007;387:1831. doi: 10.1007/s00216-006-1052-7. [DOI] [PubMed] [Google Scholar]
- 28.Qi ZM, Honma I, Zhou HS. Appl Phys Lett. 2007;90:011102. [Google Scholar]
- 29.Lide DR, editor. Handbook of Chemistry and Physics. 89 Taylor & Francis Group; Boca Raton, FL: 2008–2009. [Google Scholar]
- 30.Axelrod D, Koppel DE, Schlessinger J, Elson E, Webb WW. Biophys J. 1976;16:1055. doi: 10.1016/S0006-3495(76)85755-4. [DOI] [PMC free article] [PubMed] [Google Scholar]
- 31.Corn R. NPhase Calculation Program. http://corninfo.ps.uci.edu/calculations.html.
- 32.Hansen WN. J Am Chem Soc. 1968;58:380. [Google Scholar]
- 33.Malitson IH. J Opt Soc Am. 1965;55:1205. [Google Scholar]
- 34.Afifi S, Dusseaux R. Opt Commun. 2008;281:4663. [Google Scholar]
- 35.Marcuse D. Theory of Dielectric Optical Waveguides. Academic; London: 1974. [Google Scholar]
- 36.Yang L, Saavedra SS, Armstrong NR, Hayes J. Anal Chem. 1994;66:1254. doi: 10.1021/ac00080a010. [DOI] [PubMed] [Google Scholar]
- 37.Homola J, Yee SS, Gauglitz G. Sens Actuators, B. 1999;54:3. [Google Scholar]
- 38.Homola J. Sens Actuators, B. 1997;41:207. [Google Scholar]
- 39.Homola J, Koudela I, Yee SS. Sens Actuators, B. 1999;54:16. [Google Scholar]
- 40.Pfeifer P, Aldinger U, Schwotzer G, Diekmann S, Steinrucke P. Sens Actuators, B. 1999;54:166. [Google Scholar]
- 41.Jung LS, Campbell CT, Chinowsky TM, Mar MN, Yee SS. Langmuir. 1998;14:5636. [Google Scholar]
- 42.Kasemo B. Surf Sci. 2002;500:656. [Google Scholar]
- 43.Heyse S, Stora T, Schmid E, Lakey JH, Vogel H. Biochim Biophys Acta, Rev Biomembr. 1998;1376:319. doi: 10.1016/s0304-4157(98)00020-3. [DOI] [PubMed] [Google Scholar]
- 44.Munro JC, Frank CW. Langmuir. 2004;20:10567. doi: 10.1021/la048378o. [DOI] [PubMed] [Google Scholar]
- 45.Lahiri J, Kalal P, Frutos AG, Jonas ST, Schaeffler R. Langmuir. 2000;16:7805. [Google Scholar]
- 46.Han JH, Taylor JD, Phillips KS, Wang XQ, Feng PY, Cheng Q. Langmuir. 2008;24:8127. doi: 10.1021/la800484k. [DOI] [PubMed] [Google Scholar]
- 47.Alves ID, Ciano KA, Boguslavski V, Varga E, Salamon Z, Yamamura HI, Hruby VJ, Tollin G. J Biol Chem. 2004;279:44673. doi: 10.1074/jbc.M404713200. [DOI] [PubMed] [Google Scholar]
- 48.Hamai C, Yang TL, Kataoka S, Cremer PS, Musser SM. Biophys J. 2006;90:1241. doi: 10.1529/biophysj.105.069435. [DOI] [PMC free article] [PubMed] [Google Scholar]
- 49.Wagner ML, Tamm LK. Biophys J. 2000;79:1400. doi: 10.1016/S0006-3495(00)76392-2. [DOI] [PMC free article] [PubMed] [Google Scholar]
- 50.Seu KJ, Cambrea LR, Everly RM, Hovis JS. Biophys J. 2006;91:3727. doi: 10.1529/biophysj.106.084590. [DOI] [PMC free article] [PubMed] [Google Scholar]
- 51.Weng KC, Stalgren JJR, Duval DJ, Risbud SH, Frank CW. Langmuir. 2004;20:7232. doi: 10.1021/la049940d. [DOI] [PubMed] [Google Scholar]