Abstract
The objective was to synthesize prodrugs of niacin and ketoprofen that target the human apical sodium-dependent bile acid transporter (ASBT) and potentially allow for prolonged drug release. Each drug was conjugated to the naturally occurring bile acid chenodeoxycholic acid (CDCA) using lysine as a linker. Their inhibitory binding and transport properties were evaluated in stably transfected ASBT-MDCK monolayers, and the kinetic parameters Ki, Kt, normJmax, and Pp were characterized. Enzymatic stability of the conjugates was evaluated in Caco-2 and liver homogenate. Both conjugates were potent inhibitors of ASBT. For the niacin prodrug, substrate kinetic parameter Kt was 8.22 μM and normJmax was 0.0917. In four hours, 69.4% and 26.9% of niacin was released from 1 μM and 5 μM of the conjugate in Caco-2 homogenate, respectively. For the ketoprofen prodrug, Kt was 50.8 μM and normJmax was 1.58. In four hours, 5.94% and 3.73% of ketoprofen was released from 1 μM and 5 μM of the conjugate in Caco-2 homogenate, and 24.5% and 12.2% of ketoprofen was release in liver homogenate, respectively. In vitro results showed that these bile acid conjugates are potential prolonged release prodrugs with binding affinity for ASBT.
Keywords: Bile acid transporter, MDCK cells, Prolonged release, Ketoprofen, Niacin, Stability
1. Introduction
The human Apical Sodium-dependent Bile Acid Transporter (ASBT, SLC10A2) is expressed at high levels in the terminal ileum where it mediates bile acid recovery (Dawson et al., 2003). ASBT is critical for intestinal reabsoption of bile acid in the enterohepatic recirculation. ASBT’s high affinity and capacity for native bile acids affords it to be a potential prodrug target for intestinal drug absorption (Balakrishnan and Polli, 2006; Tolle-Sander et al., 2004), as well as a contributing factor to prolong drug release via enterohepatic recirculation. Previously, bile acid conjugates or bile acid derived compounds showed potential to provide sustained systemic concentrations of the drug after oral administration (Gallop and Cundy, 2002a; Gallop and Cundy, 2002b). Prolonged drug release from the drug conjugated to a bile acid may be achieved via enterohepatic recirculation, where parent drug is slowly released into the systemic circulation from the bile acid conjugate.
Niacin (nicotinic acid) has been used in the management of hyperlipidemia for over 50 years. Clinical use of niacin has been limited by a relatively high incidence of cutaneous flushing. Niacin undergoes extensive first-pass metabolism in the liver via the conjugation and the amidation pathways (Menon et al., 2007; Piepho, 2000; Stern et al., 1992). The conjugation metabolic pathway has low affinity and high capacity and results in the formation of glycine conjugates of niacin which has been associated with flushing. The cutaneous flushing is mediated by a G-protein–coupled receptor (GPR109A) effect involves release of prostaglandin (PGE2, PGD2) (Benyo et al., 2005; Pike, 2005). The amidation pathway has high affinity and low capacity. When the amidation pathway is saturated, niacin is mainly metabolized by the conjugative pathway, resulting in flushing. The pharmacokinetic and pharmacodynamic profiles of different niacin formulations reflect differences in their absorption rates and metabolic depositions. Slower niacin absorption causes lower flushing as most of the drug undergoes amidation (Pieper, 2002; Pieper, 2003). Extended-release niacin has demonstrated reduced rates of flushing with a tmax of 4–5 hr, compared to the immediate-release niacin of 30–60 min (Knopp et al., 1998; Morgan et al., 1998).
Ketoprofen is a potent non-steroidal anti-inflammatory drug (NSAID). It is associated with higher gastrointestinal (GI) bleeding/perforation compared to other NSAIDs (Gonzalez et al., 2010). It has a short half-life of 2 hr, requiring frequent doses to maintain therapeutic efficacy (Kantor, 1986).
The objective of this study is to design respective prodrugs of niacin and ketoprofen by conjugating them with bile acid and targeting ASBT for absorption. Prolonged availability of the parent drug may be expected if prodrug is slowly hydrolyzed during enterohepatic circulation. This approach could reduce flushing from niacin and extend the pharmacological effect of ketoprofen. Moreover, the approach could minimize ketoprofen GI side effects by preventing the parent drug direct contact with the GI tract. In this study, niacin and ketoprofen were conjugated with the naturally occurring bile acid chenodeoxycholate (CDCA) via lysine as a linker. CDCA was chosen due to its high ASBT binding affinity (Balakrishnan et al., 2006b). In vitro results indicated that both conjugates were potential prodrugs with affinity for ASBT.
2. Materials and methods
2.1. Materials
[3H]-Taurocholic acid was purchased from Perkin Elmer (Waltham, MA). Taurocholic acid, nicotinoyl chloride hydrochloride, and ketoprofen were purchased from Sigma (St. Louis, MO). Protected lysine analogs were from Novabiochem (Gibbstown, NJ). Fetal bovine serum (FBS), trypsin, and Dulbecco’s modified Eagle’s medium (DMEM) were purchased from Invitrogen Corporation (Carlsbad, CA). CDCA was obtained from TCI America (Portland, OR). Pooled IGS Sprague-Dawley male rat liver S9 fraction was purchased from Xenotech (Lenexa, KS).
2.2. Synthetic Procedures
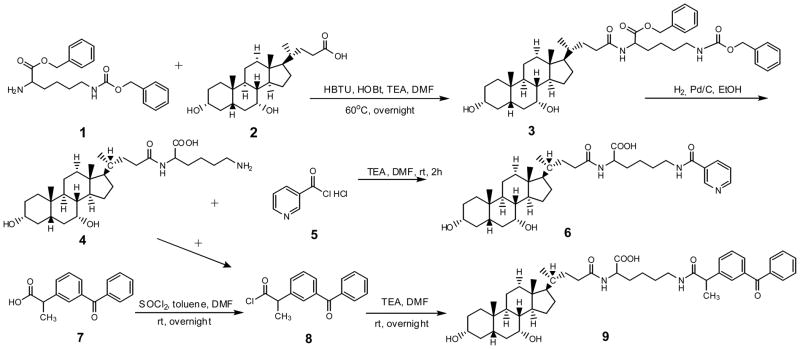
Among the native bile acids, CDCA was selected on the basis of its favorable transport across ASBT-MDCK monolayers.(Balakrishnan et al., 2006b) Pyridine-3-carboxylic acid and ketoprofen were conjugated to CDCA using lysine as the linker. Synthetic approaches of both prodrugs are shown in Scheme 1.
Scheme 1.
General synthetic approach to obtain CDCA-lysine-niacin (6) and CDCA-lysine-ketoprofen (9).
2.2.1. Synthesis of CDCA-lysine (4)
First, 5g of CDCA 2 were coupled to 0.5 eq of H-lys(Z)-OBzl HCl 1 using HBTU (1.1 eq) and HOBT (0.5 eq) as the coupling reagent in 10 mL of anhydrous DMF, along with 2.2 eq of triethylamine (TEA), at 60 °C for overnight. The reaction was terminated by adding 30 mL of water. The reaction mixture was extracted with ethyl acetate (EtOAc) (3x). The combined organic layer was washed with 1N HCl (3×), 1 N NaOH (3×), and brine (1×). The organic extract was dried with anhydrous sodium sulfate, filtered, and evaporated under vacuum to yield orange oil. The crude product was further purified by silica gel column chromatography using a mobile phase of EtOAc and hexane (80:20). Fractions were collected. Mass spectrometry (MS) showed an appropriate peak, [M+H]+ 745.3. Solvent of fractions in TLC and MS that contained the product were collected and evaporated to give a white fluffy solid compound 3.
The neutral compound 3 was subjected to catalytic hydrogenation for the removal of the benzyl and CBZ protection groups using 10% Pd/charcoal in ethanol at 50 psi overnight. Suspension was filtered through Celite® and solvent was evaporated under vacuum to give white solid intermediate 4. MS showed an appropriate peak, [M+H]+ 521.4.
2.2.2. Synthesis of CDCA-lysine-niacin (6)
Compound 4 (0.5g) was coupled to 2.0 eq of nicotinoyl chloride hydrochloride 5 in 5 mL of anhydrous DMF along with 3.0 eq of TEA. The reaction was conduct at 4°C for 4 hr. The reaction was terminated by adding 30 mL of water. The reaction mixture was extracted with EtOAc (3×). The combined organic layer was washed with 1N HCl (3×) and water (3×). Then organic layer was extracted with 1N NaOH (3×). The combined water layer was washed with EtOAc (3×). HCl solution (37%) was added drop by drop to the aqueous layer until the pH was about 2. Then the solution was extracted with EtOAc (3×) again and the organic layer was washed with brine (1×). The organic extract was dried with anhydrous sodium sulfate, filtered, and evaporated under vacuum to yield the final compound 6. MS showed an appropriate peak, [M+H]+ 626.3.
2.2.3. Synthesis of CDCA-lysine-ketoprofen (9)
Ketoprofen 7 (5 g) was activated using 20% thionyl chloride in 10 mL of toluene with a few drop of DMF as the catalyst at RT for 30 min. The reaction was terminated by evaporating the solvent under vacuum to yield a white solid 8. The resulting compound 8 was coupled to 0.5 eq of 6 in anhydrous DMF along with 3.0 eq of TEA at RT overnight. The reaction was terminated by adding 30 mL of water. The reaction mixture was extracted and purified as described above (see synthesis of CDCA-lysine-niacin). The organic extract was dried with anhydrous sodium sulfate, filtered, and evaporated under vacuum to yield the final compound 9. MS showed an appropriate peak, [M+H]+ 757.5.
2.3. Characterization of the Prodrugs
Identity and purity were characterized by TLC, LC-MS, 1H-NMR (proton, COSY), and LC-MS/MS. The mass spectra gave a molecular ion in agreement with the calculated mass of the prodrug. No CDCA impurity was detected in any final conjugate (Gonzalez and Polli, 2008). 1H-NMR results are compiled in Table 1. The chemical shifts are reported in parts per million (ppm) relative to tetramethylsilane (TMS) (δ=0.0 ppm). 1H-NMR spectra were recorded on a Varian Inova 500 MHz (Varian Inc., Palo Alto, CA).
Table 1.
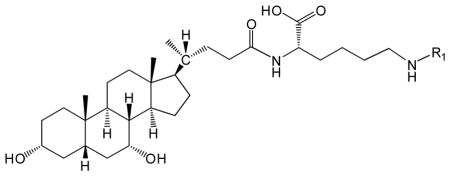
Structure and NMR results of CDCA-lysine-niacin and CDCA-lysine-ketoprofen.
 | ||
|---|---|---|
| Conjugate | R1 | 1H-NMR (DMSO-d6)a |
| CDCA-lysine-niacin |  |
11.95 (1H, s, γ), 8.99 (1H, s, α), 8.69 (1H, d, α), 8.64 (1H, t, β), 8.17 (1H, d, α), 7.92 (1H, d, β), 7.48 (1H, t, α), 4.30 (1H, m, θ), |
| CDCA-lysine-ketoprofen |
 O O
|
11.65 (1H, s, γ), 7.98 (1H, d, β) 8.04 (4, t, β) 7.78-7.58 (9H, α), 4.13(1H, m, γ) 3.68 (1H, m, α), 1.37 (3H, s, α) |
Only characteristic peaks are shown. CDCA and methylene peaks are not shown.
Values are in ppm relative to TMS. α indicates assignment to proton peaks in R1; β indicates assignment to protons in amide; γ indicates assignment to protons in carboxylic acid region; θ indicates the proton in α carbon.
2.4. Cell Culture
Stably transfected ASBT-MDCK were cultured as described (Balakrishnan et al., 2005). Briefly, cells were grown at 37 °C, 90% relative humidity, and 5% CO2 atmosphere and fed every two days by the DMEM supplemented with 10% FBS, 50 units/mL penicillin, and 50 μg/mL streptomycin. Geneticin was used at 1 mg/mL to maintain selection pressure. Cells were passaged every 4 days or after reaching 90% confluence.
Caco-2-cells were maintained in DMEM with 10% fetal bovine serum, 1% nonessential amino acid solution, 1% antibiotic solution (penicillin/streptomycin), and 1% glutamine solution and grown in flasks. Cells were incubated at 37 °C with 5% CO2. The medium was changed every two days.
2.5. Enzymatic Stability Study
Prodrug was subjected to Caco-2 homogenate and liver S9 fraction. Intact prodrug and the liberated drug were quantified.
2.5.1. Caco-2 Homogenate
Caco-2 cells grown in 225-cm2 culture flask for 21–25 days were washed twice with ice-cold phosphate-buffered saline (PBS). The cells were scraped off in 12 mL ice-cold PBS and the scraped cells were transferred to a centrifuge tube. Tubes were stored at −80°C overnight. The next day, tubes were quickly thaw at 37°C (leave some ice), sonicated the cells twice at 1 s pulses with a sonicator probe (F60 Sonicator, Thermo Fisher Scientific Inc., Waltham, MA). The cell homogenate (protein content = 0.63 mg/mL) was stored at −80 °C.(Tantishaiyakul et al., 2002)
2.5.2. Stability Study
To begin the stability assay, prodrug was added into a centrifuge tube containing 1000 μL Caco-2 cell homogenate or liver S9 fraction (20 mg/mL) to yield a prodrug concentration of 1 μM or 5 μM. Tubes were placed in a 37°C incubator and shaken. Samples (100 μL) were removed at selected time points over 4 hr and immediately added to a new centrifuge tube prefilled with 100 μL ice cold acetonitrile to precipitate cellular protein and stop enzymatic activity. Samples were centrifuged at 12,000 rpm for 30 min at 4°C. The supernatant was carefully transferred to another centrifuge tube. The samples were stored at −80 °C until further analysis.
2.6. ASBT Biological Activity Assessment
Each prodrug was subjected to ASBT inhibition and uptake studies.
2.6.1. Inhibition of Taurocholate Uptake by Prodrugs
To characterize prodrug binding affinity to ASBT, cis-inhibition studies of taurocholate uptake by prodrugs were conducted as previously described (Zheng et al., 2009). Briefly, cells were exposed to donor solution containing 2.5 μM taurocholate (including [3H]-taurocholate) in the presence of a prodrug at eight concentrations (1–100 μM) for 10 min at 37°C. At the end of the study, cell lysate was counted for taurocholate radioactivity using a liquid scintillation counter (Beckmann Instruments, Inc., Fullerton, CA).
2.6.2. Uptake of Prodrug into ASBT-MDCK
To characterize prodrug substrate properties across ASBT, uptake studies of prodrugs were conducted as described (Zheng et al., 2009). Briefly, cells were exposed to donor solution containing eight different prodrug concentrations (1–500 μM) for 10 min at 37°C. The studies were conducted in both HBSS buffer or modified HBSS buffer (i.e. sodium-free). Since ASBT is a sodium-dependent transporter, studies using sodium-free buffer enabled passive permeability measurement of the prodrug. Subsequently, to quantify uptake, cells were lysed as pervious described by adding 0.25 mL acetonitrile to each well (Rais et al., 2008). Following evaporation at RT, 1 mL solution containing 50% water and 50% acetonitrile was added to each well for 10 min. Sample was stored in −80°C until analyzed by LC-MS/MS.
2.7. Analytical Methods
Samples from uptake studies were quantified by LC–MS/MS on a Thermo Finnigan Surveyor HPLC system, equipped with a Thermo Finnigan Surveyor autosampler and a Thermo TSQ quantum mass spectrometer (Thermo Fisher Scientific Inc., Waltham, MA). For both prodrugs and parent ketoprofen, the column was a Phenomenex Luna C8 (50×2.0 mm, 3 μ; Phenomenex; Torrance, CA). For parent niacin, the column was a Thermo Aquasil C18 (50×2.1mm, Thermo Fisher Scientific, MA). Columns were heated to 45°C. The mobile phase was A, 0.1% formic acid in water; and B, 0.1% formic acid in acetonitrile, with a flow rate of 0.4 mL/min. The injection volume was 10 μL. Detection was achieved under positive ion electrospray [M+H]+ tandem mass spectrometry, as positive mode provided the greatest sensitivity. The mobile phase and retention time for both conjugates and parent drugs are detailed in Table 2.
Table 2.
LC-MS/MS methods of analyzing CDCA-lysine-niacin and CDCA-lysine-ketoprofen and the parent drugs niacin and ketoprofen.
| Compound | Exact Mass a | Q1 Mass (m/z) b | Q3 Mass (m/z) | Retention Time (min) | Gradient Timetable (B%)c |
|---|---|---|---|---|---|
| CDCA-lysine-niaicn | 625.41 | 626.40 | 189.12 | 1.26 | 0–0.2 (45%), 0.2–3.0 (45–95%), 3.0–4.0 (95%), 4.0–4.2 (95-45%), and 4.2–7.0 min (45%) |
| Niacin | 123.03 | 124.06 | 80.15 | 1.02 | 0–3.1 (5%), 3.1–3.2 (5–90%), 3.2–4.2 (90%), 4.2–4.5 (90%-5%), and 4.5–8.0 min (5%) |
| CDCA-lysine-ketoprofen | 756.47 | 757.50 | 485.30 | 4.77 | 0–0.2 (40%), 0.2–3.0 (40–95%), 3.0–4.0 (95%), 4.0–4.2 (95-40%), and 4.2–7.0 min (40%) |
| Ketoprofen | 254.09 | 255.10 | 198.36 | 2.36 | 0–0.2 (40%), 0.2–3.0 (40–95%), 3.0–4.0 (95%), 4.0–4.2 (95-40%), and 4.2–7.0 min (40%) |
Calculated monoisotopic mass.
Q1 and Q3 mass are experimental mass [M+H]+.
The mobile phase was A, 0.1% formic acid in water; and B, 0.1% formic acid in acetonitrile. The gradient times were listed as the percent organic phase, B%.
2.8. Kinetic Analysis
Inhibition data was analyzed in terms of inhibition constant Ki as previous described (Zheng et al., 2009), where a modified Michaelis–Menten competitive inhibition model that consider aqueous boundary layer (ABL) resistance was used (Balakrishnan et al., 2007).
| (1) |
where J is taurocholate uptake, Jmax and Kt are the Michaelis-Menten constants for ASBT-mediated transport, S is taurocholate concentration, Pp is the passive taurocholate permeability, I is the inhibitor concentration, Ki is the inhibition constant, and PABL is the aqueous boundary layer permeability (i.e. 150 × 10−6cm/s) (Balakrishnan et al., 2007). Kt was 5.03 μM, obtained from a pooled data analysis approach. Jmax was measured from taurocholate uptake studies using 200 μM of taurocholate; Pp was estimated from taurocholate uptake studies in absence of sodium. Ki was calculated using WinNonlin Professional (Pharsight Corporation; Mountain View, CA). Jmax and Pp of taurocholate were measured on each study occasion.
For uptake studies, uptake data into monolayers was analyzed in terms of substrate affinity Kt and was fitted to a previously developed modified Michaelis–Menten model (eqn 2, eqn 3).(Balakrishnan et al., 2007)
| (2) |
| (3) |
where J is prodrug uptake. Equations 2 and 3 were applied simultaneously to data measured with sodium and without sodium to estimate Kt, Jmax, and Pp. Data were analyzed using WinNonlin Professional.
3. Results
3.1. Prodrug Synthesis
Bile acid conjugates CDCA-lysine-niacin and CDCA-lysine-ketoprofen were successfully synthesized. Their structures are depicted in Table 1. For each, the synthetic strategy was based on coupling the carboxyl group at the C-24 position of CDCA (Scheme 1) to the carboxyl group of ketoprofen or niacin using lysine as a linker. Prodrug properties were characterized using NMR and LC-MS, and the resulting data are shown in Table 1 and Table 2, respectively. Both LC-MS and NMR data were consistent with the target structures. TLC showed a single spot.
3.2. ASBT Inhibition and Uptake
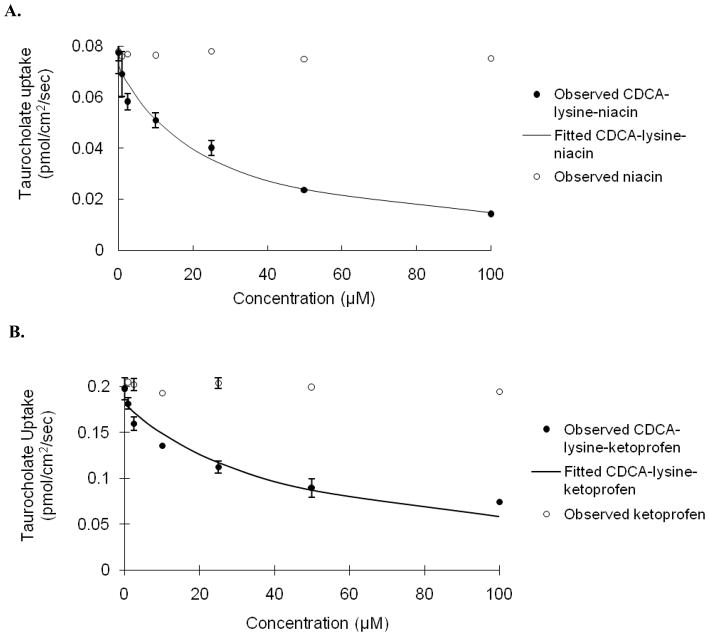
Inhibition of taurocholate uptake was carried out for each prodrug using stably transfected ASBT-MDCK monolayers. Fig. 1 illustrates the concentration-dependent inhibition profile by CDCA-lysine-niacin and niacin (Fig. 1A), and CDCA-lysine-ketoprofen and ketoprofen (Fig. 1B), respectively. Taurocholate uptake was reduced over 2-fold in the presence of 50 μM of each prodrug. Neither ketoprofen nor niacin was ASBT inhibitor. The Ki value indicated that each prodrug was a potent inhibitor and is listed in Table 3, with Ki of 12.9 μM for niacin prodrug and 15.6 μM for ketoprofen prodrug, respectively. Compare to the Ki range of native bile acids from 0.427 to 22.6 μM, with taurocholate Ki = 4.96 μM, both prodrugs were potent inhibitors and within the range of native bile acids (Balakrishnan et al., 2006b).
Fig. 1.
Concentration-dependent inhibition of taurocholate uptake into ASBT-MDCK monolayers by (A) CDCA-lysine-niacin (●) and niacin (○) (B) CDCA-lysine-ketoprofen (●) and ketoprofen (○) for 10 min. Circles indicate observed data points, while the solid line indicates model fit. Taurocholate uptake into ASBT-MDCK cells was reduced significantly by both conjugates, where Ki was 12.9 μM for niacin prodrug and 15.6 μM for ketoprofen prodrug. Taurocholate uptake was not reduced by niacin or ketoprofen.
Table 3.
ASBT inhibition and uptake kinetics of CDCA-lysine-niacin and CDCA-lysine-ketoprofen.
| Conjugate | Ki (μM) | Kt (μM) | normJmaxa | Pp ×106(cm/s) |
|---|---|---|---|---|
| CDCA-lysine-niacin | 12.9 (±2.6) | 8.22 (±3.63) | 0.0917 (±0.0102) | 0.367(±0.023) |
| CDCA-lysine-ketoprofen | 15.6 (±2.7) | 50.8 (±23.2) | 1.87 (±0.36) | 6.38(±0.44) |
Data were summarized as mean (±SEM) of three measurements.
To accommodate variation in ASBT expression levels across studies, Jmax of each bile acid was normalized against taurocholate Jmax from the same study yielding normJmax.
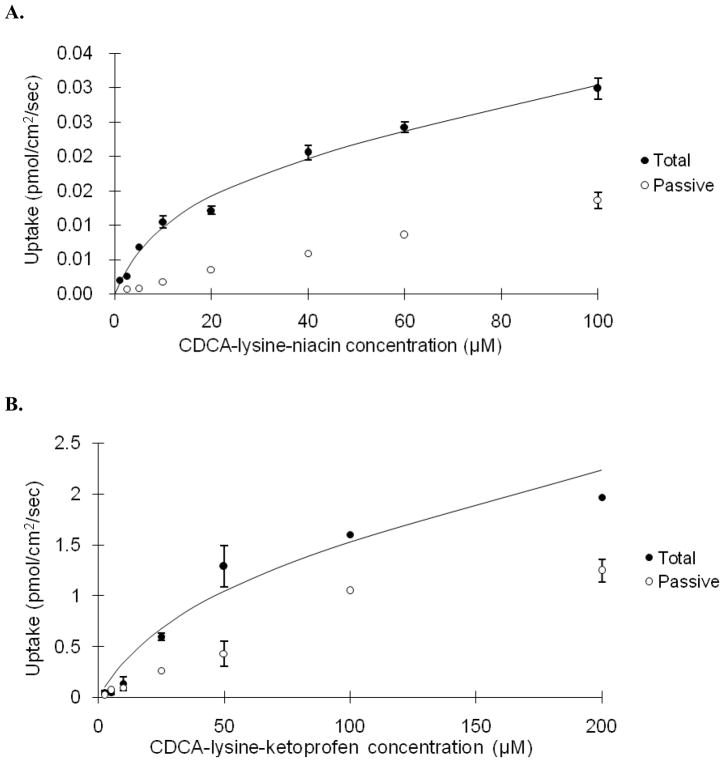
Given favorable binding affinity for ASBT, prodrugs were evaluated for ASBT-mediated uptake. Fig. 2 illustrates the concentration-dependent transport of CDCA-lysine-niacin and CDCA-lysine-ketoprofen into ASBT-MDCK monolayers. Table 3 lists the kinetic uptake parameters for both compounds. Niacin prodrug had a high substrate binding affinity with a Kt = 8.22 μM, but the transport capacity is significantly reduced compared to taurocholate, such that normJmax of niacin prodrug was only 0.0917. normJmax was obtained by dividing prodrug Jmax by taurocholate Jmax. Therefore, ASBT’s capacity to transport niacin prodrug is only about 9% of that of taurocholate.
Fig. 2.
Concentration-dependent uptake of CDCA-lysine-niacin (A) and CDCA-lysine-ketoprofen (B) into ASBT-MDCK monolayers for 10 min. The conjugate was measured at varying concentrations in the presence and absence of sodium to delineate ASBT-mediated and passive uptake components. Data indicate total uptake in the presence of sodium (●) and passive uptake in the absence of sodium (○), while the solid line indicates model fit of the total uptake.
Ketoprofen exhibited a more modest substrate binding affinity of Kt = 50.8 μM, which is 10-fold higher than the taurocholate Kt = 5.03 μM. However, the transport capacity of this prodrug was 1.87-fold of the capacity for taurocholate. The passive permeability of CDCA-lysine-ketoprofen was 6.38×10⁻⁶cm/s, which was 20-fold higher compared to CDCA-lysine-niacin of 0.367×10⁻⁶cm/s. This difference reflects the greater lipophilicity afforded by the ketoprofen moiety (Log P = 3.31), compared to the niacin moiety (Log P = 0.25). When [S] = ½ Kt, passive permeability account for 10.3% for total niacin prodrug uptake, and 44.1% for ketoprofen prodrug.
3.3. Enzymatic Stability of Prodrugs and Drug Release
Each prodrug was designed with the employment of two amide linkages, which are stable in acid and base. Chemical stability of prodrugs was evident from successful synthesis, which entailed extracting prodrug using strong acidic and basic solutions; no breakdown to potential degradants was observed in MS. Therefore, general chemical stability of the prodrugs was concluded.
Prodrug hydrolysis can occur in many locations during enterohepatic circulation. In order to assess prodrug hydrolysis, enzymatic stability was conducted in Caco-2 homogenate and rat liver homogenate, using prodrugs concentrations of 1 μM and 5 μM. Time-dependent prodrug degradation and corresponding parent drug release were monitored. Table 4 summarizes the percentage of conversion of prodrug to the parent drug after 4 hr.
Table 4.
Niacin and ketoprofen released from CDCA-lysine-niacin and CDCA-lysine-ketoprofen, respectively in Caco-2 and liver S9 after 4 hours.
| Caco-2 | Liver S9 | |
|---|---|---|
| Percent niacin released in 1 μM CDCA-lysine-niacin | 69.4% | -a |
| Percent niacin released in 5 μM CDCA-lysine-niacin | 26.9% | - |
| Percent ketoprofen released from 1μM CDCA-lysine-ketoprofen | 5.94% | 24.5% |
| Percent ketoprofen released from 5 μM CDCA-lysine-ketoprofen | 3.73% | 12.2% |
Cannot be measured due to a high baseline niacin level in rat liver S9 fraction.
3.3.1. Niacin Prodrug
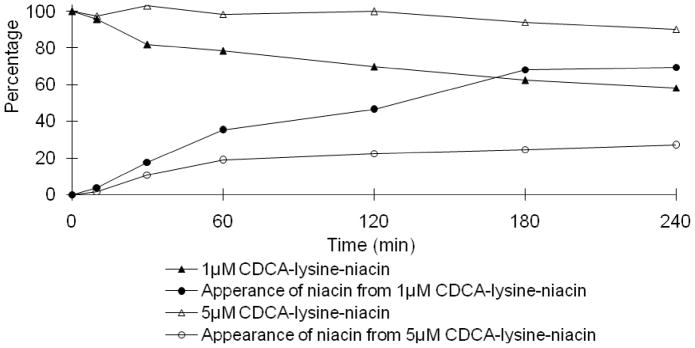
In Fig. 3, the niacin prodrug decreased with time in Caco-2 homogenate, while niacin increased with time. Under the same conditions, 5 μM prodrug displayed a slower hydrolysis profile compared to 1 μM, with 26.9% and 69.4% of niacin released in 4 hr, respectively. The mass balance during niacin prodrug hydrolysis was over 100% for the last two sample times (i.e. 180 min and 240 min). The error was possibly caused by evaporation via incubation at 37 °C over this time frame, which involved several sample withdraws.
Fig. 3.
Hydrolysis of CDCA-lysine-niacin in Caco-2 homogenate. Data indicate the time course of disappearance of 1 μM (▲) and 5 μM (△) of CDCA-lysine-niacin and appearance of niacin from 1 μM (●) and 5 μM CDCA-lysine-niacin (○).
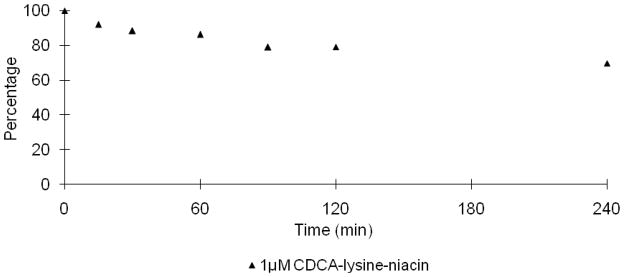
LC-MS/MS showed a high baseline level of niacin (i.e. nicotinic acid) in rat liver S9 fraction. Therefore, the generation profile of niacin in liver homogenate was not able to be measured. Fig. 4 shows hydrolysis profile of 1 μM niacin prodrug in liver homogenate. About 30.3% of the prodrug was degraded after 4 hr, which was slightly less than the 41.7% degradation in Caco-2 homogenate.
Fig. 4.
Hydrolysis of CDCA-lysine-niacin in rat liver S9 fraction. Data indicate the time course of the disappearance of 1 μM of CDCA-lysine-niacin (▲).
3.3.2. Ketoprofen Prodrug
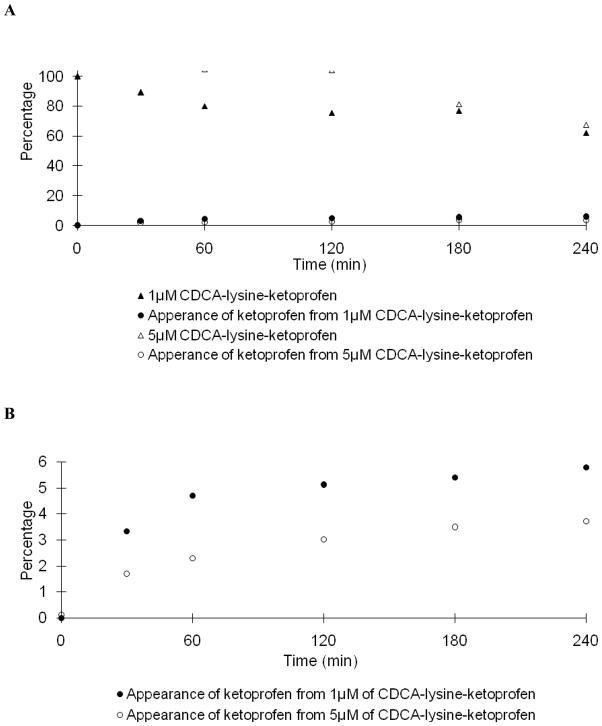
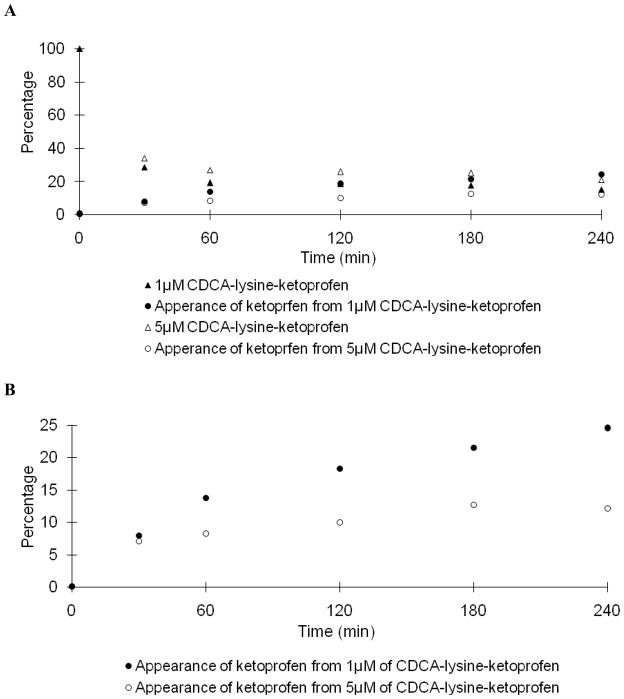
Fig. 5A and 6A shows the stability profile of the ketoprofen prodrug in Caco-2 and liver homogenate, respectively. Like the niacin prodrug, under identical conditions, the hydrolysis rate of 5 μM prodrug was slower than that of 1 μM prodrug. Table 4 shows only 5.94% and 3.73% of ketoprofen was released from 1 μM and 5 μM of prodrug in Caco-2 homogenate after 4 hr; while 24.5% and 12.2% was released in liver homogenate. The time dependent appearance of ketoprofen is re-plotted using a smaller scale in Fig. 5B and Fig. 6B. The prodrug demonstrated high metabolic stability in Caco-2 homogenate. Similarly, conversion of prodrug to ketoprofen rate was slower in liver homogenate.
Fig. 5.
Hydrolysis of CDCA-lysine-ketoprofen in Caco-2 homogenate. In panel A, data indicate the time course of the disappearance of 1 μM (▲) and 5 μM (△) of CDCA-lysine-ketoprofen and the appearance of ketoprofen from 1 μM (●) and 5 μM (○) CDCA-lysine-ketoprofen. In panel B, ketoprofen appearance from 1 μM (●) and 5 μM (○) prodrug is re-plotted on a smaller scale.
Fig. 6.
Hydrolysis of potential prodrug CDCA-lysine-ketoprofen in rat liver homogenate. In panel A, data points indicate the time course of the disappearance of 1 μM (▲) and 5 μM (△) of CDCA-lysine-ketoprofen and the appearance ketoprofen from 1 μM (●) and 5 μM (○) CDCA-lysine-ketoprofen. In panel B, ketoprofen appearance from of 1 μM (●) and 5 μM (○) prodrug is re-plotted on a smaller scale.
4. Discussion
4.1. Enterohepatic Circulation of Bile Acid Conjugates
The prodrugs were designed to be absorbed at the terminal ileum by the high capacity and high affinity transporter ASBT, followed by a slow release of the parent drug via enzymatic hydrolysis during enterohepatic circulation. Bile acid enterohepatic circulation is a very efficient system where 3–5 g bile acid pool cycles six times daily and results in a turnover of 12–18 g of bile acid each day in humans. Only less than 0.5 g bile acid is lost in feces each day, with a recovery efficiency over 97% (Dawson et al., 2009; Dawson and Oelkers, 1995; Wong et al., 1996).
In order to be efficiently enterohepatically recycled, high hepatic uptake and high secretion into bile are also critical which also involve transporters. Hepatic bile acid uptake is mainly mediated by sodium/taurocholate co-tranporting polypeptide (NTCP), as well as members of the sodium independent organic anion transporting polypeptides (OATP) family (i.e. OATP-A, OATP-C, OATP-8) (St-Pierre et al., 2001). Bile salt export pump (BSEP) and multidrug resistance protein (MRP2) transport bile acid into the bile canaliculus (Alrefai and Gill, 2007). MPR4 and MPR3 are able to remove bile acid through the sinusoidal surface (Alrefai and Gill, 2007). These bile acid transporters generally possess broader substrate specificity than ASBT. As a result, a bile acid conjugate that is well recognized by ASBT has high potential to be a substrate of liver bile acid transporters.
Although numerous transporter proteins are involved in the bile acid transport system, ASBT knockout mice exhibit 10–20 fold elevated fecal bile acid levels and a 80% decrease in bile acid pool size (Dawson et al., 2003). In humans, some inherited ASBT mutations cause primary bile acid malabsorption (Montagnani et al., 2001; Oelkers et al., 1997; Wong et al., 1995). These results indicate ASBT is critical for bile acid intestinal reabsoprtion. Bile acid-drug conjugates that utilize ASBT have potential to be absorbed from the intestine to the liver and excreted into the bile, to achieve a circulating reservoir of conjugated drugs. The reservoir may slowly release drug to provide sustained systemic drug concentrations.
4.2. Advantage to Target ASBT
The conventional approaches for prolonged drug release are formulations or devices which provide a slow release/dissolution of drug within the intestine. Such approaches require the drug to be well absorbed in the large intestine where formulations will largely reside for 12–24 hr after oral administration. Drugs that are amenable to conventional sustained release approaches must be highly permeable. Moreover, it is difficult to control drug release, and dose dumping can cause toxicity. Previously, prodrug approaches for the oral delivery of ketoprofen have employed polymer and dextran (Larsen et al., 1991; Wang et al., 2002). Prodrug approaches for niacin have entailed dextran and diacylglycerol esters (Cordi et al., 1995; Filip et al., 2003). Extended-release formulations of ketoprofen and niacin have been marketed.
The carrier used in the prodrug approach here was CDCA, with lysine as the linker. Lysine was selected since it is a natural amino acid and allows for CDCA and drug to be incorporated via amide linkages. It also provided a negative charge, which is critical for ASBT substrate translocation (Balakrishnan et al., 2006a). As a targeting moiety for ASBT as well as transporters involved in enterohepatic recirculation, CDCA is an endogenous compound, as is lysine, such that the prodrug has the potential advantage of low toxicity. In addition, as bile acids are distinctive physiological molecules and are poorly metabolized, a bile acid conjugate may show metabolic stability (Kramer and Wess, 1996).
Several other intestinal influx transporters have been proposed as prodrug targets, such as such as nucleoside transporters (ENTs), organic cation transporters (OCTs), organic anion-transporting polypeptide (OATPs), and peptide transporter (Pept1). Pept1 translocates valacyclovir and increase acyclovir bioavailability 3-fold (Burnette and de, 1994). Ki of valacyclovir is 4.08 mM in Xenopus laevis oocytes (Balimane et al., 1998) and 1.10 mM in CHO-PepT1 (Han et al., 1998). In comparison to this peptide prodrug, the bile acid prodrug approach that targets ASBT has the advantage of higher binding affinity (i.e. micromolar range).
4.3. Bile Acid Prodrugs
Several bile acid conjugates were previously designed to provide site-directed liver and gallbladder delivery (Kramer et al., 1994; Kramer et al., 1992; Petzinger et al., 1995; Petzinger et al., 1999). For example, bile acid conjugates of a HMG-CoA reductase inhibitor were active against HMG-CoA reductase in rat liver after an oral administration (Kramer et al., 1994). Also, a bile acid conjugate increased acyclovir bioavailability by 2-fold in rat (Tolle-Sander et al., 2004).
In the present study, both prodrugs were ASBT substrates, with high affinity and low capacity for the niacin prodrug and moderate affinity and high capacity for the ketoprofen prodrug. Transporter-mediated translocation is a complex process. It minimally requires substrate binding to the transporter, translocation of substrate via transporter conformation changes, dissociation of substrate, and transporter conformation restoration. Additional steps involve ASBT cotransport of sodium. Regarding the marked difference in transport capacity between two prodrugs, any step in the transporting process could be rate-limiting, and consequently limit transporter capacity. However, since both prodrugs were potent inhibitors, substrate binding to the transporter was not the rate limiting step, even for the niacin prodrug, for which ASBT exhibited a lower capacity.
An appropriate hydrolysis rate would be critical for prolonged release of drug from prodrug. If hydrolysis is too rapid, then prolonged release is not achieved. If hydrolysis is too slow, therapeutic concentrations of drug are not obtained. In vitro results suggest slow hydrolysis of niacin prodrug in Caco-2 and liver homogenates. Considering niacin’s half-life of 20–45 min (Porter and Kaplan, 2009), the prodrug showed potential to target ASBT and yield a prolonged pharmacokinetic profile, which may cause levels of the flushing side effect. Compared to the niacin prodrug, the ketoprofen prodrug was a weaker substrate for ASBT and exhibited greater metabolic stability in Caco-2 homogenate. The conversion of prodrug to ketoprofen was achieved slowly in liver homogenate. Enzymatic stability results suggest that the prodrugs may be hydrolyzed gradually in vivo after absorption via ASBT.
For both prodrugs, further examination is warranted, in terms of these bile acid conjugates being substrates for other transporters that contribute to enterohepatic recirculation, as well as in vivo studies to assess potential for extended pharmacokinetic drug profile after prodrug administration.
4. Conclusions
Bile acid conjugates of each niacin and ketoprofen were synthesized. Both prodrugs exhibited binding affinity for ASBT. Niacin prodrug showed higher ASBT substrate binding affinity, but lower substrate capacity compared to taurocholate. Ketoprofen prodrug was a weaker substrate. Stability results suggest that each prodrug exhibits potential enzymatic stability for the conjugates to provide sustained drug release. Overall, in vitro results showed that these bile acid conjugates are potential prolonged release prodrugs with binding affinity for ASBT. Future in vivo pharmacokinetic assessment of the conjugates is warranted.
Acknowledgments
This work was support in part by National Institutes of Health grants DK67530. The author gratefully acknowledges Dr. Gasirat Tririya for her assistance in chemical synthesis and Dr. Guoyun Bai for NMR assignment assistance.
Footnotes
Publisher's Disclaimer: This is a PDF file of an unedited manuscript that has been accepted for publication. As a service to our customers we are providing this early version of the manuscript. The manuscript will undergo copyediting, typesetting, and review of the resulting proof before it is published in its final citable form. Please note that during the production process errors may be discovered which could affect the content, and all legal disclaimers that apply to the journal pertain.
Reference List
- Alrefai WA, Gill RK. Bile acid transporters: structure, function, regulation and pathophysiological implications. Pharm Res. 2007;24:1803–1823. doi: 10.1007/s11095-007-9289-1. [DOI] [PubMed] [Google Scholar]
- Balakrishnan A, Hussainzada N, Gonzalez P, Bermejo M, Swaan PW, Polli JE. Bias in estimation of transporter kinetic parameters from overexpression systems: Interplay of transporter expression level and substrate affinity. J Pharmacol Exp Ther. 2007;320:133–144. doi: 10.1124/jpet.106.107433. [DOI] [PubMed] [Google Scholar]
- Balakrishnan A, Polli JE. Apical sodium dependent bile acid transporter (ASBT, SLC10A2): a potential prodrug target. Mol Pharm. 2006;3:223–230. doi: 10.1021/mp060022d. [DOI] [PMC free article] [PubMed] [Google Scholar]
- Balakrishnan A, Sussman DJ, Polli JE. Development of stably transfected monolayer overexpressing the human apical sodium-dependent bile acid transporter (hASBT) Pharm Res. 2005;22:1269–1280. doi: 10.1007/s11095-005-5274-8. [DOI] [PubMed] [Google Scholar]
- Balakrishnan A, Wring SA, Coop A, Polli JE. Influence of charge and steric bulk in the C-24 region on the interaction of bile acids with human apical sodium-dependent bile acid transporter. Mol Pharm. 2006a;3:282–292. doi: 10.1021/mp0600135. [DOI] [PMC free article] [PubMed] [Google Scholar]
- Balakrishnan A, Wring SA, Polli JE. Interaction of native bile acids with human apical sodium-dependent bile acid transporter (hASBT): influence of steroidal hydroxylation pattern and C-24 conjugation. Pharm Res. 2006b;23:1451–1459. doi: 10.1007/s11095-006-0219-4. [DOI] [PMC free article] [PubMed] [Google Scholar]
- Balimane PV, Tamai I, Guo A, Nakanishi T, Kitada H, Leibach FH, Tsuji A, Sinko PJ. Direct evidence for peptide transporter (PepT1)-mediated uptake of a nonpeptide prodrug, valacyclovir. Biochem Biophys Res Commun. 1998;250:246–251. doi: 10.1006/bbrc.1998.9298. [DOI] [PubMed] [Google Scholar]
- Benyo Z, Gille A, Kero J, Csiky M, Suchankova MC, Nusing RM, Moers A, Pfeffer K, Offermanns S. GPR109A (PUMA-G/HM74A) mediates nicotinic acid-induced flushing. J Clin Invest. 2005;115:3634–3640. doi: 10.1172/JCI23626. [DOI] [PMC free article] [PubMed] [Google Scholar]
- Burnette TC, de MP. Metabolic disposition of the acyclovir prodrug valaciclovir in the rat. Drug Metab Dispos. 1994;22:60–64. [PubMed] [Google Scholar]
- Cordi A, Lacoste JM, Duhault J, Espinal J, Boulanger M, Broux O, Husson B, Volland JP, Mahieu JP. Synthesis of 1,2-diacyl-3-nicotinoyl glycerol derivatives and evaluation of their acute effects on plasma lipids in the rat. Arzneimittelforschung. 1995;45:997–1001. [PubMed] [Google Scholar]
- Dawson PA, Haywood J, Craddock AL, Wilson M, Tietjen M, Kluckman K, Maeda N, Parks JS. Targeted deletion of the ileal bile acid transporter eliminates enterohepatic cycling of bile acids in mice. J Biol Chem. 2003;278:33920–33927. doi: 10.1074/jbc.M306370200. [DOI] [PubMed] [Google Scholar]
- Dawson PA, Lan T, Rao A. Bile acid transporters. J Lipid Res. 2009 doi: 10.1194/jlr.R900012-JLR200. [DOI] [PMC free article] [PubMed] [Google Scholar]
- Dawson PA, Oelkers P. Bile acid transporters. Curr Opin Lipidol. 1995;6:109–114. doi: 10.1097/00041433-199504000-00009. [DOI] [PubMed] [Google Scholar]
- Filip C, Ungureanu D, Gheorghita N, Ghitler N, Mocanu G, Nechifor M. Hypolipidemic effect of a prodrug containing nicotinic acid in rats. Correlation with plasmatic levels. Rev Med Chir Soc Med Nat Iasi. 2003;107:179–183. [PubMed] [Google Scholar]
- Gallop MA, Cundy KC. Bile-acid conjugates for providing sustained systemic concentrations for drugs. PCT/US01/42628. 11-4-2002a. WO 02/28883 A1. 9-10-2001a. Ref Type: Patent.
- Gallop MA, Cundy KC. Bile-acid derived compounds for providing sustained systemic concentrations of drugs after oral administration. PCT/US01/42513. 11-4-2002b. WO 02/28881 A1. Ref Type: Patent.
- Gonzalez EL, Patrignani P, Tacconelli S, Rodriguez LA. Variability of risk of upper gastrointestinal bleeding among nonsteroidal anti-inflammatory drugs. Arthritis Rheum. 2010 doi: 10.1002/art.27412. [DOI] [PubMed] [Google Scholar]
- Gonzalez P, Polli JE. Impact of impurity on kinetic estimates from transport and inhibition studies. J Pharmacol Exp Ther. 2008;326:296–305. doi: 10.1124/jpet.107.135863. [DOI] [PMC free article] [PubMed] [Google Scholar]
- Han H, de Vrueh RL, Rhie JK, Covitz KM, Smith PL, Lee CP, Oh DM, Sadee W, Amidon GL. 5'-Amino acid esters of antiviral nucleosides, acyclovir, and AZT are absorbed by the intestinal PEPT1 peptide transporter. Pharm Res. 1998;15:1154–1159. doi: 10.1023/a:1011919319810. [DOI] [PubMed] [Google Scholar]
- Kantor TG. Ketoprofen: a review of its pharmacologic and clinical properties. Pharmacotherapy. 1986;6:93–103. doi: 10.1002/j.1875-9114.1986.tb03459.x. [DOI] [PubMed] [Google Scholar]
- Knopp RH, Alagona P, Davidson M, Goldberg AC, Kafonek SD, Kashyap M, Sprecher D, Superko HR, Jenkins S, Marcovina S. Equivalent efficacy of a time-release form of niacin (Niaspan) given once-a-night versus plain niacin in the management of hyperlipidemia. Metabolism. 1998;47:1097–1104. doi: 10.1016/s0026-0495(98)90284-0. [DOI] [PubMed] [Google Scholar]
- Kramer W, Wess G. Bile acid transport systems as pharmaceutical targets. Eur J Clin Invest. 1996;26:715–732. doi: 10.1111/j.1365-2362.1996.tb02383.x. [DOI] [PubMed] [Google Scholar]
- Kramer W, Wess G, Enhsen A, Bock K, Falk E, Hoffmann A, Neckermann G, Gantz D, Schulz S, Nickau L. Bile acid derived HMG-CoA reductase inhibitors. Biochim Biophys Acta. 1994;1227:137–154. doi: 10.1016/0925-4439(94)90088-4. [DOI] [PubMed] [Google Scholar]
- Kramer W, Wess G, Schubert G, Bickel M, Girbig F, Gutjahr U, Kowalewski S, Baringhaus KH, Enhsen A, Glombik H. Liver-specific drug targeting by coupling to bile acids. J Biol Chem. 1992;267:18598–18604. [PubMed] [Google Scholar]
- Larsen C, Jensen BH, Olesen HP. Bioavailability of ketoprofen from orally administered ketoprofen-dextran ester prodrugs in the pig. Acta Pharm Nord. 1991;3:71–76. [PubMed] [Google Scholar]
- Menon RM, Gonzalez MA, Adams MH, Tolbert DS, Leu JH, Cefali EA. Effect of the rate of niacin administration on the plasma and urine pharmacokinetics of niacin and its metabolites. J Clin Pharmacol. 2007;47:681–688. doi: 10.1177/0091270007300264. [DOI] [PubMed] [Google Scholar]
- Montagnani M, Love MW, Rossel P, Dawson PA, Qvist P. Absence of dysfunctional ileal sodium-bile acid cotransporter gene mutations in patients with adult-onset idiopathic bile acid malabsorption. Scand J Gastroenterol. 2001;36:1077–1080. doi: 10.1080/003655201750422693. [DOI] [PubMed] [Google Scholar]
- Morgan JM, Capuzzi DM, Guyton JR. A new extended-release niacin (Niaspan): efficacy, tolerability, and safety in hypercholesterolemic patients. Am J Cardiol. 1998;82:29U–34U. doi: 10.1016/s0002-9149(98)00732-2. [DOI] [PubMed] [Google Scholar]
- Oelkers P, Kirby LC, Heubi JE, Dawson PA. Primary bile acid malabsorption caused by mutations in the ileal sodium-dependent bile acid transporter gene (SLC10A2) J Clin Invest. 1997;99:1880–1887. doi: 10.1172/JCI119355. [DOI] [PMC free article] [PubMed] [Google Scholar]
- Petzinger E, Nickau L, Horz JA, Schulz S, Wess G, Enhsen A, Falk E, Baringhaus KH, Glombik H, Hoffmann A. Hepatobiliary transport of hepatic 3-hydroxy-3-methylglutaryl coenzyme A reductase inhibitors conjugated with bile acids. Hepatology. 1995;22:1801–1811. [PubMed] [Google Scholar]
- Petzinger E, Wickboldt A, Pagels P, Starke D, Kramer W. Hepatobiliary transport of bile acid amino acid, bile acid peptide, and bile acid oligonucleotide conjugates in rats. Hepatology. 1999;30:1257–1268. doi: 10.1002/hep.510300529. [DOI] [PubMed] [Google Scholar]
- Pieper JA. Understanding niacin formulations. Am J Manag Care. 2002;8:S308– S314. [PubMed] [Google Scholar]
- Pieper JA. Overview of niacin formulations: differences in pharmacokinetics, efficacy, and safety. Am J Health Syst Pharm. 2003;60:S9–14. doi: 10.1093/ajhp/60.suppl_2.S9. [DOI] [PubMed] [Google Scholar]
- Piepho RW. The pharmacokinetics and pharmacodynamics of agents proven to raise high-density lipoprotein cholesterol. Am J Cardiol. 2000;86:35L–40L. doi: 10.1016/s0002-9149(00)01468-5. [DOI] [PubMed] [Google Scholar]
- Pike NB. Flushing out the role of GPR109A (HM74A) in the clinical efficacy of nicotinic acid. J Clin Invest. 2005;115:3400–3403. doi: 10.1172/JCI27160. [DOI] [PMC free article] [PubMed] [Google Scholar]
- Porter RS, Kaplan LJ. The Merck Manuals Online Medical Library. Merck Research Laboratories, Division of Merck & Co., Inc; Whitehouse Station, N.J.: 2009. [Google Scholar]
- Rais R, Gonzalez PM, Zheng X, Wring SA, Polli JE. Method to screen substrates of apical sodium-dependent bile acid transporter. AAPS J. 2008;10:596–605. doi: 10.1208/s12248-008-9069-9. [DOI] [PMC free article] [PubMed] [Google Scholar]
- St-Pierre MV, Kullak-Ublick GA, Hagenbuch B, Meier PJ. Transport of bile acids in hepatic and non-hepatic tissues. J Exp Biol. 2001;204:1673–1686. doi: 10.1242/jeb.204.10.1673. [DOI] [PubMed] [Google Scholar]
- Stern RH, Freeman D, Spence JD. Differences in metabolism of time-release and unmodified nicotinic acid: explanation of the differences in hypolipidemic action? Metabolism. 1992;41:879–881. doi: 10.1016/0026-0495(92)90170-f. [DOI] [PubMed] [Google Scholar]
- Tantishaiyakul V, Wiwattanawongsa K, Pinsuwan S, Kasiwong S, Phadoongsombut N, Kaewnopparat S, Kaewnopparat N, Rojanasakul Y. Characterization of mefenamic acid-guaiacol ester: stability and transport across Caco-2 cell monolayers. Pharm Res. 2002;19:1013–1018. doi: 10.1023/a:1016470523923. [DOI] [PubMed] [Google Scholar]
- Tolle-Sander S, Lentz KA, Maeda DY, Coop A, Polli JE. Increased acyclovir oral bioavailability via a bile acid conjugate. Mol Pharm. 2004;1:40–48. doi: 10.1021/mp034010t. [DOI] [PubMed] [Google Scholar]
- Wang LF, Chiang HN, Wu PC. Kinetics and hydrolysis mechanism of polymeric prodrugs containing ibuprofen, ketoprofen, and naproxen as pendent agents. J Biomater Sci Polym Ed. 2002;13:287–299. doi: 10.1163/156856202320176538. [DOI] [PubMed] [Google Scholar]
- Wong MH, Oelkers P, Dawson PA. Identification of a mutation in the ileal sodium-dependent bile acid transporter gene that abolishes transport activity. J Biol Chem. 1995;270:27228–27234. doi: 10.1074/jbc.270.45.27228. [DOI] [PubMed] [Google Scholar]
- Wong MH, Rao PN, Pettenati MJ, Dawson PA. Localization of the ileal sodium-bile acid cotransporter gene (SLC10A2) to human chromosome 13q33. Genomics. 1996;33:538–540. doi: 10.1006/geno.1996.0233. [DOI] [PubMed] [Google Scholar]
- Zheng X, Ekins S, Raufman JP, Polli JE. Computational models for drug inhibition of the human apical sodium-dependent bile acid transporter. Mol Pharm. 2009;6:1591–1603. doi: 10.1021/mp900163d. [DOI] [PMC free article] [PubMed] [Google Scholar]


