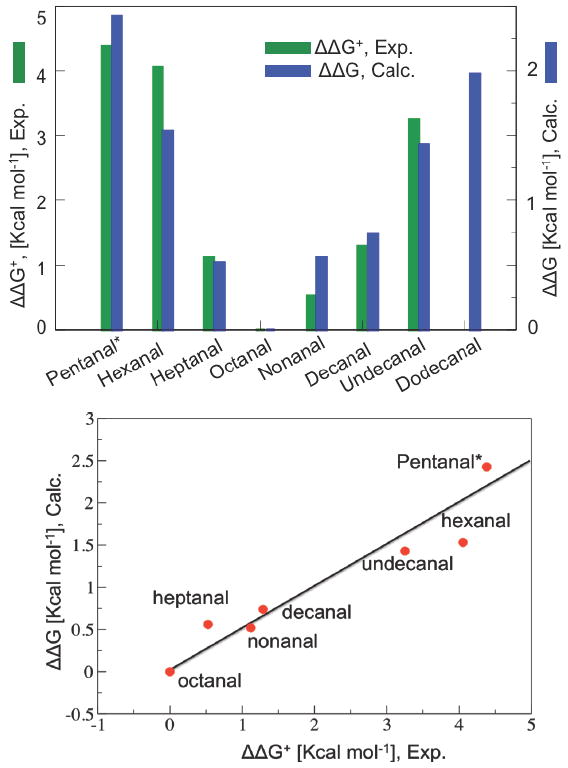
FIGURE 2.

Correlation between calculated changes in binding free energies for saturated n-alkyl aldehydes, relative to octanal binding (ΔΔG in Kcal mol-1) and the experimental values ΔΔG† obtained from the EC50 for C6–C11, and the IC50 for C5 (marked *), including new data for nonanal (4.4±0.4μM); decanal: (16±1.7μM); and undecanal (446±16μM), and earlier data for hexanal (1736±440 μM), heptanal (12±3μM); and octanal 1(.9±0.2 μM).
