Abstract
Arterial-spin-labeling (ASL) MRI provides a non-invasive tool to measure cerebral blood flow (CBF) and is increasingly used as a surrogate for baseline neural activity. However, the power of ASL MRI in detecting CBF differences between patient and control subjects is hampered by inter-subject variations in global CBF, which are associated with non-neural factors and may contribute to the noise in the across-group comparison. Here, we investigated the sensitivity of this technique and proposed a normalization strategy to better detect such a difference. A “model” situation was employed in which two visual stimuli (i.e. cross fixation and flashing checkerboard) were presented to two groups of subjects to mimic “control” and “patient” groups (N=7 for each group), respectively. It was found that absolute CBF (aCBF) in the occipital lobe in the checkerboard group was 26.0% greater compared to the fixation group, but the level of significance was modest (p=0.03). In contrast, when normalizing the CBF with whole-brain CBF or CBF in a reference region (termed relative CBF, rCBF), the statistical significance was improved considerably (p<0.003). For voxel based analysis, the rCBF indices correctly detected CBF differences in the occipital lobe in the across-group comparison, while aCBF failed to detect any significant cluster using the same statistical threshold. We also performed Monte Carlo simulation to confirm the experimental findings and found that the power improvement was most pronounced when SNR is moderate and the underlying CBF difference was small. The simulation also showed that, with the proposed normalization, a detection power of 80% can be achieved using a sample size of about 20. In summary, rCBF is a more sensitive index to detect small differences in CBF, rather than the much-sought-after aCBF, since it reduces data noise caused by inter-subject variations in global CBF.
Keywords: ASL MRI, cerebral blood flow, pCASL, Sensitivity, Perfusion, Group Analysis
1. Introduction
Cerebral blood flow (CBF) is a physiological parameter reflecting blood supply to the brain and is typically written in units of ml blood per 100g tissue per min. It has been shown to be a sensitive marker for cerebrovascular diseases such as stroke, arterial stenosis, and vascular dementia [1–3]. Moreover, CBF measurement has played a major role in non-invasive assessment of neural activity since it can be associated with neural activity via neurovascular coupling [4,5]. This relationship has led to the development and wide application of human brain mapping techniques using Positron Emission Tomography (PET) or functional MRI [6–8]. More recently, much attention was received to assess baseline neural activity between patient and control subject groups, by comparing the resting CBF values [9–12]. Such applications may have great potentials in understanding disease mechanism in neurological and psychiatric disorders.
Traditionally, CBF measurement is conducted by injecting radioactively labeled tracers followed by imaging the signals using Single-Photon-Emission-Computed-Tomography (SPECT) or PET [13,14]. However, the applications of these techniques in brain disorders are limited by the need of exogenous agent as well as the use of radioactive materials. Arterial Spin Labeling (ASL) MRI is a non-invasive technique that has the potential to provide a quantitative assessment of CBF within 5–10 minutes [15–22]. There have been increasing numbers of studies that use ASL MRI in comparing resting CBF between patients and controls, under the assumption that CBF is a surrogate of local neural activity. However, such efforts have encountered a few difficulties, mainly because of large inter-subject variations in CBF. These variations are due to non-neural factors such as breathing pattern, physiologic state and even consumption of caffeine [23–25], which modulate CBF in a global fashion and contribute to the sources of noise in group comparison. Therefore, it is not yet clear how sensitive ASL MRI is in detecting regional neural activity differences between patients and controls and which is the best strategy to detect such differences.
In this work, we conducted experimental measurements and numerical simulation to show that raw CBF values should be normalized against CBF of the whole-brain or a reference region before conducting regional comparison. Normalization is useful for factoring out global modulation effects, thereby increasing the sensitivity of ASL MRI in detecting regional CBF differences between two subject groups. We used a model condition in which we simulated a “patient” group by having the subjects view a flashing checkerboard and compared their CBF to that of a “control” group of subjects viewing a fixation. Group comparison was conducted on the raw CBF values (denoted as absolute CBF, aCBF) and on the CBF values normalized against whole-brain values (denoted as relative CBFWB, rCBFWB) or a central brain region (denoted as relative CBFCR, rCBFCR). In addition, numerical simulation was conducted to confirm the experimental findings and assess the ASL detection power under typical signal-to-noise-ratio (SNR).
2. Materials and methods
2.1 Experiment
Experiments were performed on a 3T MR system (Philips Medical Systems, Best, the Netherlands) using body coil transmission and head coil reception. The protocol was approved by the Institutional Review Board. A total of 14 healthy subjects (10 males, 4 females; 21–54 years of age) participated in the study after informed written consent was obtained. The subjects were divided into two groups, one group (N=7, age 28.9±12.3, 5 males, 2 females) was shown a white cross and the other group (N=7, age 29.3±7.6, 5 males, 2 females) was shown a flashing checkerboard at 4 Hz, to mimic the “control” and “patient” groups, respectively. In addition, the “patient” group was also shown a white cross to serve as an intra-group control.
A balanced pseudo-continuous ASL (pCASL) sequence was used to measure CBF following previous studies by Wu et al. and Wong [26,27]. Imaging parameters for pCASL experiments were: single-shot gradient-echo EPI, field-of-view (FOV)=240×240, matrix=80×80, voxel size=3×3 mm2, 27 slices acquired in ascending order, slice thickness=5 mm, no gap between slices, labeling duration=1650 ms, post labeling delay=1525 ms, TR=4020 ms, TE=14ms, SENSE factor 2.5, time interval between consecutive slice acquisitions=35.5 ms, number of controls/labels= 30 pairs, RF duration=0.5 ms, pause between RF pulses = 0.5 ms, labeling pulse flip angle=18°, bandwidth=2.7 kHz, echo train length=35, and scan duration 4.5 min. In addition to the pCASL scan, a time-of-flight (TOF) angiogram and a phase-contrast (PC) velocity MRI were performed to obtain aCBF values following procedures established previously [28]. The TOF angiogram was performed to visualize the internal carotid arteries (ICA) and vertebral arteries (VA), and to correctly position the PC velocity MRI slice. The imaging parameters were: TR/TE/flip angle=23ms/3.45ms/18°, FOV=160×160×70 mm3, voxel size 1.0×1.0×1.5mm3, number of slices =47, one saturation slab of 60mm positioned above the imaging slab to suppress the venous vessels, duration 1 min 26 sec. The slice of the PC velocity MRI was oriented perpendicular to the ICA and VA and the parameters were: single slice, voxel size=0.45×0.45 mm2, FOV=230×230 mm2, TR/TE=20/7 ms, flip angle=15°, slice thickness=5 mm, maximum velocity encoding=80 cm/s, and scan duration=30 sec.
A high resolution T1 weighted image was also acquired with the following parameters: MPRAGE sequence, TR/TE=8.3ms/3.8ms, flip angle=12°, 160 sagittal slices, voxel size=1×1×1 mm3, FOV=256×256×160 mm3, and duration 4 min.
2.2 Data analysis
The pCASL control and label images were realigned using SPM5 (Wellcome Department of Imaging Neuroscience, London, UK) and the aCBF maps were calculated based on a procedure described previously [28]. Briefly, a difference image was calculated for each pair of the control and label images. The 30 difference images were then averaged. Slice timing correction was conducted to account for different post-labeling delay times for different brain slices. From the PC velocity MRI, the total flux in the four feeding arteries (left/right internal carotid arteries, left/right vertebral arteries) was calculated and this is the blood flow to the entire brain. The volume of the entire brain was estimated from the MPRAGE data, from which the average blood flow per unit brain mass was calculated in units of ml/100g/min. Next, the MPRAGE brain mask was applied to the pCASL difference images and the whole-brain averaged pCASL signal (in units of MR signal) was calculated. Comparing these two averaged values, the conversion constant between pCASL MR signal and the physiologic unit was obtained and was used to calibrate the pCASL signal for individual voxels, yielding aCBF maps. The aCBF maps were spatially normalized to the brain template of Montreal Neurological Institute (MNI). Calculation of rCBF maps was based on two different normalization methods. In the first method, aCBF of each voxel was divided by the whole brain averaged aCBF, yielding a relative map rCBFWB. In the second method, the normalization used a region that is known to be minimally affected by stimuli (or a disease) such as central region in case of visual stimulation, and yielded a map of rCBFCR. The central brain regions contain pre- and post-central gyrus and are defined by a parcellation template in SPM [29].
Region-of-interest (ROI) and Voxel-based analyses (VBA) were conducted using each of the aCBF, rCBFWB and rCBFCR. ROI analysis was conducted by averaging the CBF values in a region (e.g. occipital lobe) defined by a parcellation template in SPM [29], which was then compared across the two subject groups. In VBA, the individual CBF maps were spatially smoothed (with full-width-half-maximum of 10 mm) to account for small differences in sulci/gyri location across subjects. Then we conducted Student t-tests on each voxel in the brain. A voxel level threshold of 0.05 (False Discovery Rate, FDR, corrected) and a cluster size of 100 were used to define activated voxels. False-positive tests using randomization [30] suggested that, with this set of thresholds, the cluster level family-wise error is expected to be less than 0.05.
Signal and noise levels were calculated on a voxel-by-voxel basis as follows. For each voxel, a time course with thirty measurements was obtained from the control/label pairs. The signal level was calculated as the mean of the time course and the noise level as the standard error (i.e. standard deviation divided by ). We then determined SNR for gray matter (GM), white matter (WM), and the whole brain. Four ROIs were drawn on eight axial slices for GM and WM, resulting in a total of 32 GM and 32 WM ROIs. Signal and noise levels were averaged across voxels in the ROIs to yield the respective average values. Their ratio was then defined as the SNR for GM (or WM). The whole brain SNR was measured by drawing an ROI around the boundary of the brain and by conducting similar calculations.
2.3 Simulation
Simulation was conducted to provide a quantitative understanding as to why CBF normalization is beneficial in detecting group differences. The simulation also provides an assessment of the detection power under typical SNR of ASL MRI. The aCBF of a brain region can be written as:
| (1) |
where aCBF(s, r, p) denotes aCBF value of subject “s” in region “r” under physiologic state “p” (diseased or healthy). Conceptually, the equation can be viewed as follows. Each subject has a specific level of CBF, g(s), which is a global factor for all brain regions. Next, different regions have different levels of blood supply and this is also dependent on physiologic state. For example, CBF in frontal lobe may be 80% of the whole brain average and an individual with frontal lobe specific disease may have a CBF that is 70% of the whole brain value. Thus f(r, p) is the region-specific deficit that we aim to detect with ASL MRI. Finally, the measured signal contains a noise component, n, that is randomly distributed.
When normalizing the aCBF values with the whole brain average, g(s), the resulting rCBFWB can be written as:
| (2) |
Monte Carlo simulation was performed with the following parameters. Whole brain averaged CBF, g(s), was assumed to have a Gaussian distribution across individuals, with a mean value of 46 ml/100g/min and a standard deviation (SD) of 6.3 ml/100g/min (based on experimental data from a previous study [28]). It is assumed that the “patient” and “control” groups each contained 20 subjects. The noise term, n, was added with a Gaussian distribution of a mean of 0 and a SD based on SNR values of 2 to 10, which were typical ranges of CBF maps using ASL MRI. Regional CBF index, f(r, p), was assumed to be 1 (i.e. 100%) for the “control” group and the deficit in the “patient” group varied from 10% to 60% in the simulation. The probability of detecting the group difference (using p value threshold of 0.05) was plotted as a function of SNR and true CBF difference. Each simulation was performed 50,000 times. The simulation was performed for one voxel in the brain. Under the above assumptions, the signal behavior of the other voxels is expected to follow the same detection power plot. The threshold of cluster size was not applied in the simulation as only one voxel was considered at a time.
In a second simulation, the detection probability was calculated for different sample sizes and p value thresholds with other assumptions identical to the first simulation. The CBF difference between groups was assumed to be 10% and the SNR was 8.
3. Results
3.1 Experiment
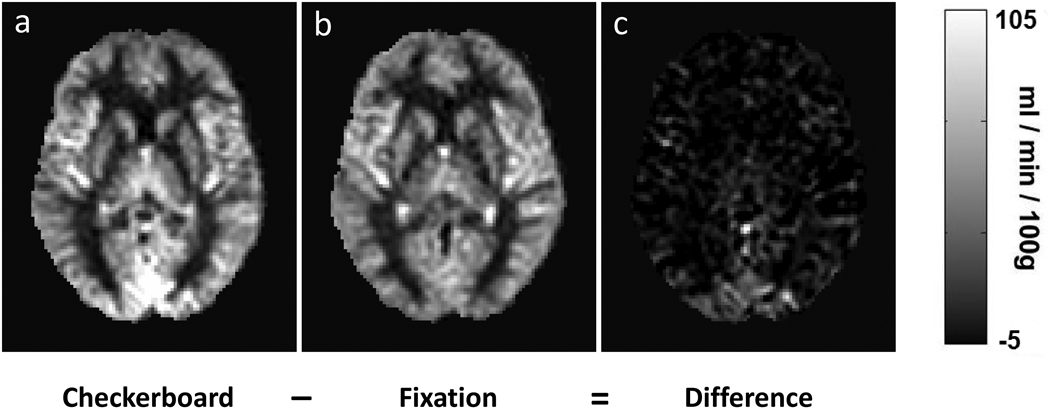
Robust CBF maps were obtained from all subjects. The SNR on a single-voxel level for white matter, gray matter, and whole brain were 0.99±0.27, 4.1±0.55, and 2.6±0.49 (mean±SD), respectively. Group average aCBF maps for fixation and flashing checkerboard groups are shown in Figure 1. ROI analysis in the occipital lobe showed that aCBF in the flashing checkerboard group was 26.0% higher compared to that of the fixation group (Table 1). The p-value was marginal (p=0.03). In contrast, the p-values using rCBFWB or rCBFCR were 10–15 times smaller (Table 1), suggesting a more sensitive comparison. Note that the percentage change observed in the rCBFWB comparison was actually reduced to 16.5%. This is because aCBF increase in the occipital lobe resulted in a higher whole-brain aCBF in the flashing checkerboard group (i.e. large denominator), and thus offset some of the effects in the rCBFWB comparison. On the other hand, when using the central region as a reference, the normalized index, rCBFCR, showed a change (26.4%) comparable to that of aCBF.
Fig. 1.
Averaged aCBF maps from two groups of subjects who viewed a) flashing checkerboard and b) fixation cross, respectively. Their difference is shown in c). The aCBF maps from individual subjects were spatially normalized to the MNI brain template and then averaged. CBF increases can be seen in the occipital lobe.
Table 1.
Summary of comparison of CBF maps between fixation and checkerboard groups based on various CBF indices. The last row in the table is from the VBA comparisons and the other rows are from the occipital lobe ROI comparisons.
| aCBF (ml/100g/min) |
rCBFWB (unitless) |
rCBFCR (unitless) |
|
|---|---|---|---|
| Fixation Group | 49.8±3.9 | 1.15±0.06 | 1.01±0.06 |
| Checkerboard Group | 62.7±12.1 | 1.34±0.10 | 1.28±0.16 |
| Percent Change | 26.0% | 16.5% | 26.4% |
| P-value | 0.03 | 0.002 | 0.003 |
| Number of Significant Voxels |
0 | 1619 | 2024 |
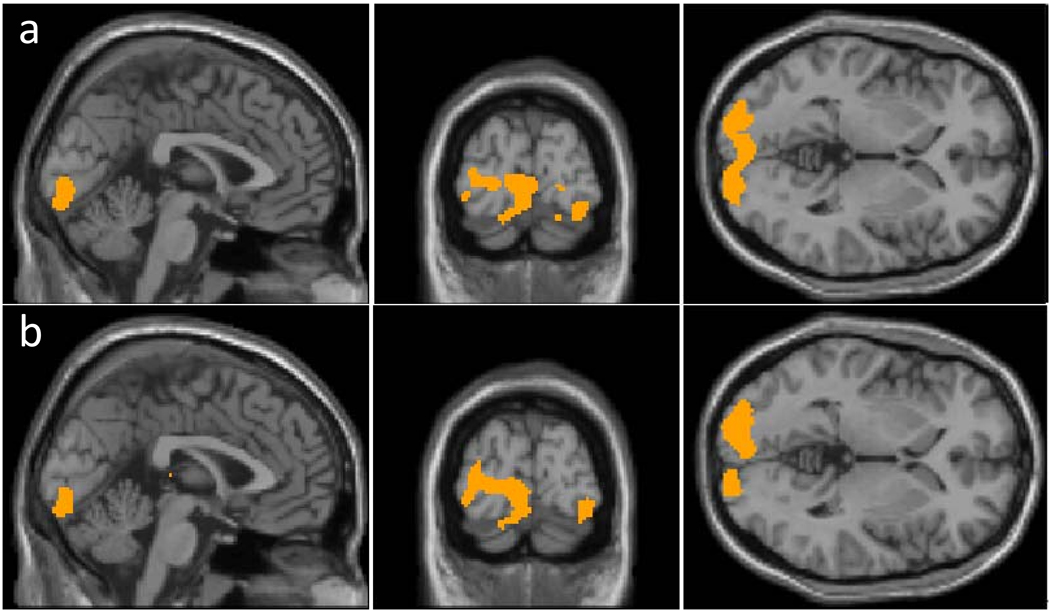
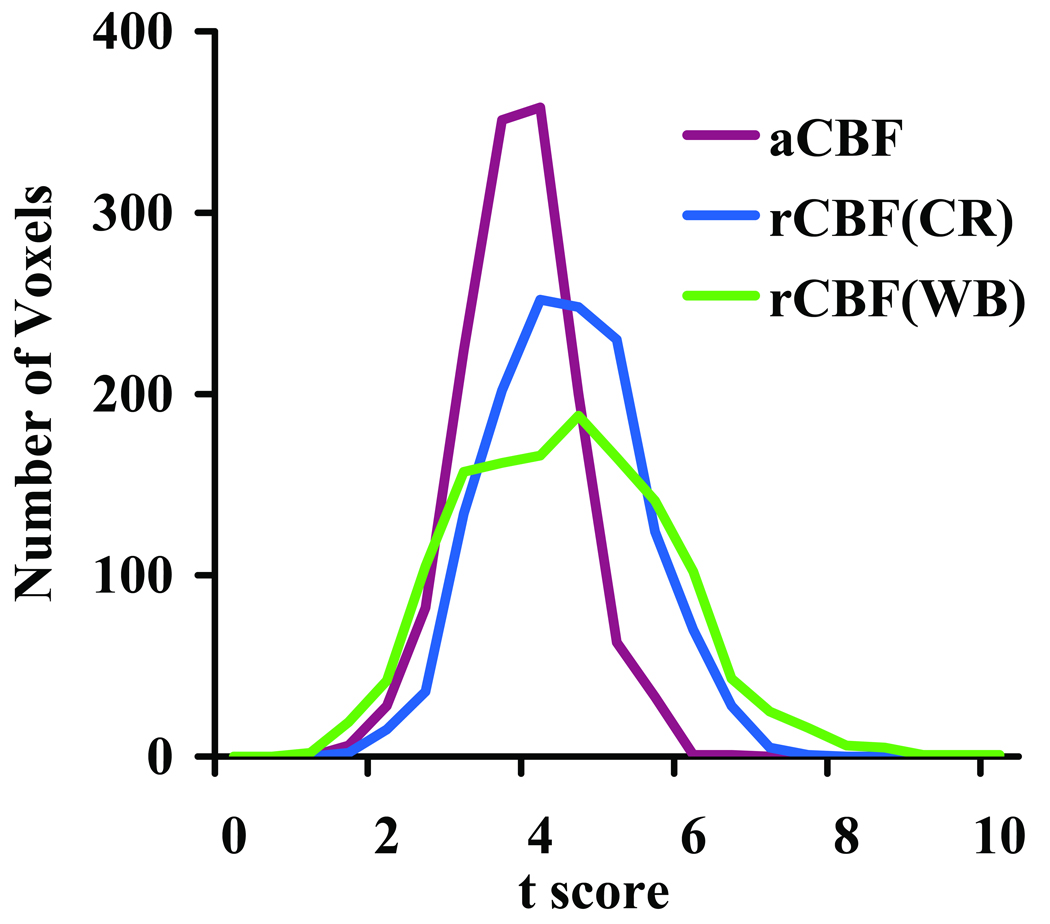
Voxel-wise comparison across groups also revealed advantages of normalization. With a threshold p-value=0.05 (False Discovery Rate (FDR) Corrected) and a cluster size of 100 voxels, comparison on aCBF data yielded no significant voxels. On the other hand, comparison on rCBFWB correctly identified the visual cortex as having significant differences (Fig. 2a). The central-region-normalized map, rCBFCR, yielded similar activation clusters (Fig. 2b). We have also investigated the histogram of t scores of voxels in the visual cortex (Fig. 3). It can be seen that the histogram shifted toward the right-hand side comparing the rCBF to aCBF results, suggesting that normalization improved statistical significance of the voxels.
Fig. 2.
Results of voxel based comparison across groups using a) CBF normalized by whole brain blood flow (rCBFWB); and b) CBF normalized by central region blood flow (rCBFCR). The analyses were performed using an unpaired Student t-test with a threshold of p<0.05 (False Discovery Rate corrected) and cluster size of 100 voxels. The results of aCBF comparison were not shown because no significant cluster was detected.
Fig. 3.
Histograms of t scores from individual voxels. The voxels were delineated from the intra-subject comparison of aCBF to avoid bias in selection criteria. A total of 1375 voxels were included. The histograms shown are from inter-subject comparisons using aCBF, rCBFWB, and rCBFCR. Since the voxels were from the visual cortex, their t scores tend to be positive. It can be seen that the histograms of rCBFWB and rCBFCR were shifted to the right.
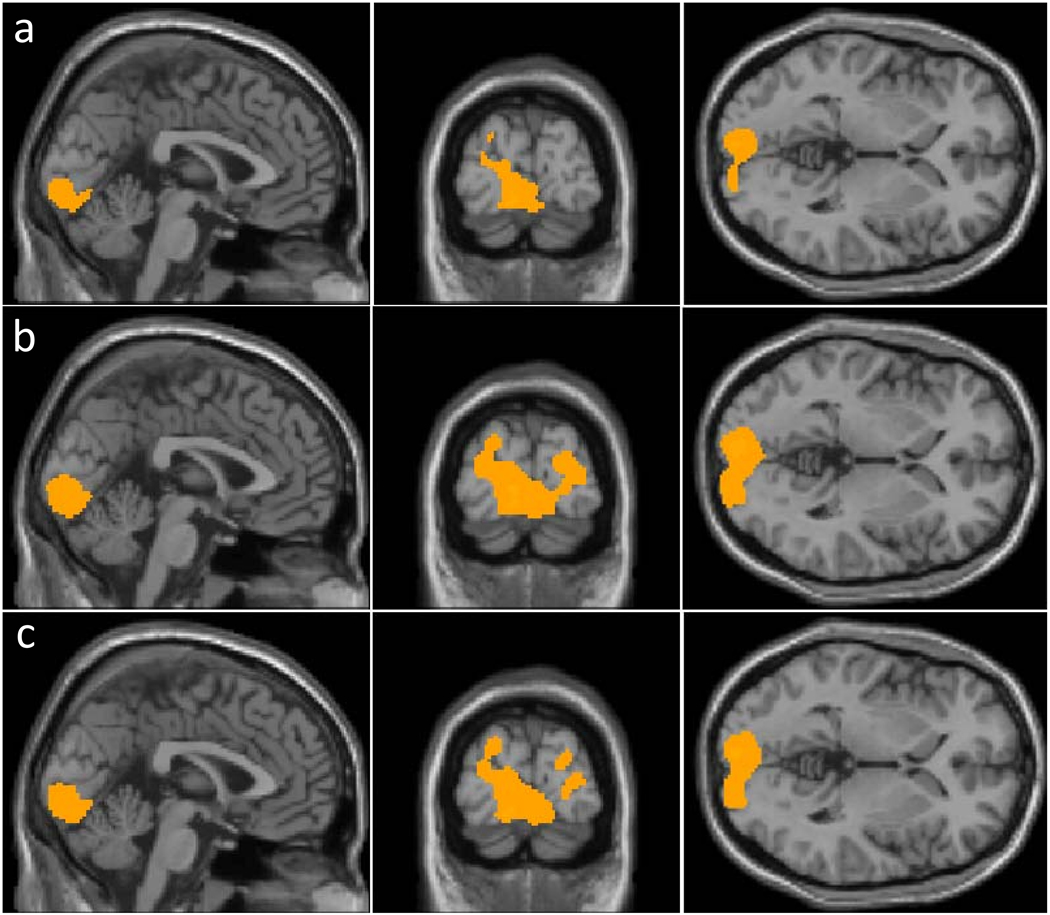
Similar analysis was conducted on the intra-subject comparison, in which CBF maps under the flashing checkerboard condition were compared to CBF maps under fixation condition from the SAME group of subject. Paired comparisons using aCBF maps identified visual cortices as regions with significant CBF changes (Fig. 4a). Normalization with whole brain CBF or central region CBF modestly improved the activation maps (Figs. 4b and 4c). The numbers of significant voxels were 1704, 4214 and 3425 for aCBF, rCBFWB and rCBFCR, respectively.
Fig. 4.
Results of voxel based comparison within the same group but under different conditions using a) absolute CBF (aCBF); b) CBF normalized by whole brain blood flow (rCBFWB); and c) CBF normalized by central region blood flow (rCBFCR). The analyses were performed using a paired Student t-test with a threshold of p<0.05 (False Discovery Rate corrected) and cluster size of 100 voxels.
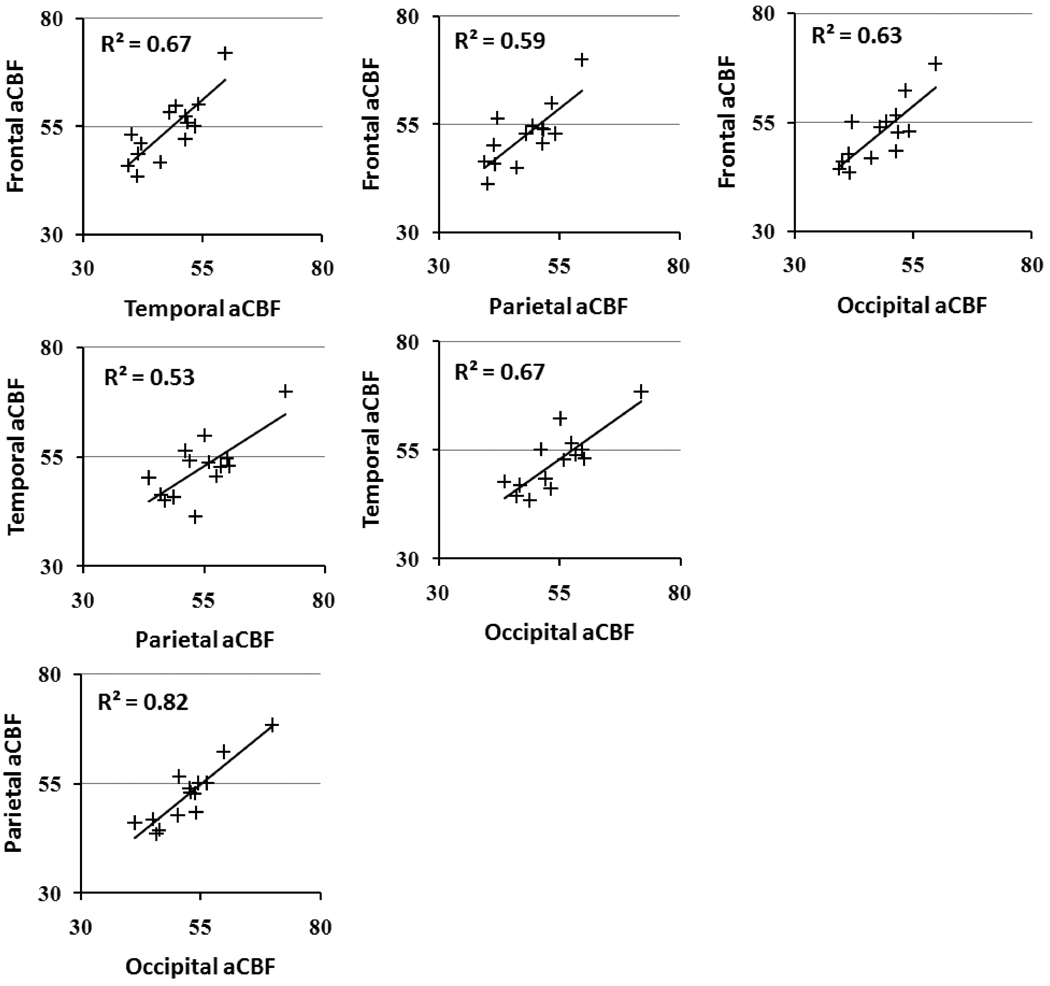
Figure 5 shows the inter-correlation of aCBF in the frontal, parietal, temporal and occipital lobes across subjects. A significant correlation was observed for all paired comparisons (p<0.005). The results showed that, despite global CBF differences across subjects, regional aCBF appeared to be correlated. That is, a person with higher frontal CBF tended to have a higher CBF in the temporal, parietal and occipital lobes. Therefore, normalization of CBF as proposed above is useful in removing this global modulation.
Fig. 5.
Scatter plots of regional aCBF values across subjects. All comparisons had a significant correlation (p<0.005).
3.2 Simulation
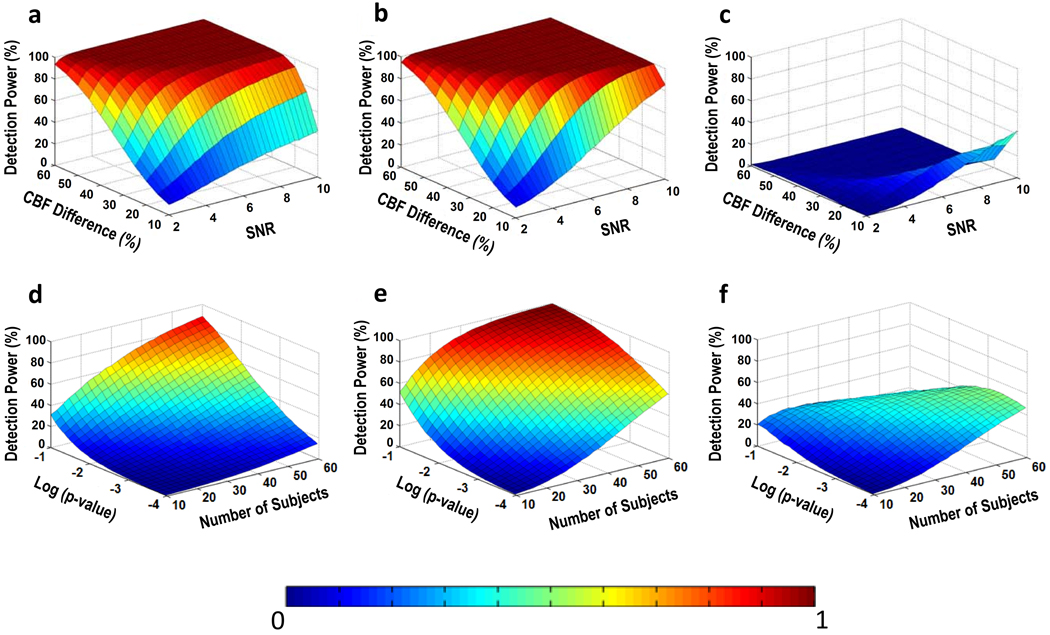
Figures 6a–b show the probability of detection as a function of SNR and amount of CBF deficit using aCBF and rCBF, respectively. It can be seen that the rCBF plot has a higher power compared to the aCBF plot. Figure 6c shows the difference in detection power comparing aCBF and rCBF. It can be seen that the improvement is particularly pronounced when the SNR is relatively high and the expected CBF difference is moderate.
Fig. 6.
Results of Monte Carlo simulation for across-group comparison. Top row: Detection power as a function of SNR and CBF difference between the control and patient groups. The simulation was conducted for a) aCBF and b) rCBF. Their difference is shown in c). Bottom row: Detection power as a function of sample size and statistical threshold. Relative CBF offers a greater power in detection of group differences. The simulation was conducted for d) aCBF and e) rCBF. Their difference is shown in f).
Figures 6d–e show the probability of detection as a function of sample size and p-value threshold. Again, rCBF showed higher power of detection compared to aCBF.
4. Discussion
In this study, we assessed the sensitivity of ASL MRI in detecting CBF differences across subject groups and demonstrated in a “model” situation that normalization of regional CBF using whole-brain CBF or CBF in a reference region could improve detection power. The improvement was observed in both ROI based analysis and VBA. Monte Carlo simulation confirmed the experimental findings and showed that the improvement was due to an accounting of the global variations across subjects.
ASL MRI, as a biomarker for baseline neural activity, has great potentials in clinical applications. However, questions remained as to whether ASL MRI can detect small CBF differences on the order of 10%, which is the typical range of CBF deficit occurring in many psychiatric and neurological disorders [31–34]. The present study provides a systematic investigation into the detection power of ASL and the optimal strategies for data analysis. We propose normalization of CBF with either global CBF or a region that is known to be unaffected by a disease. Global CBF normalization is straightforward to implement. However, this approach is applicable only when we assume that global CBF is intact, otherwise it will reduce or eliminate the CBF difference that we are seeking. Therefore, a tradeoff strategy would be to first perform a test on the global aCBF to assess whether there is a significant difference between the two groups. If no group difference in whole brain aCBF is detected, the normalization will be applied. An alternative approach is to normalize the aCBF map with a region that is known to be unaffected by the disease or condition. In our model situation, we normalized the aCBF map with central region as visual stimulation is not expected to change blood flow in the somatosensory/motor areas. However, in some neurological or psychiatric disorders, a prior knowledge of unaffected regions may not always be available. Therefore, both of the normalization approaches have advantages and disadvantages. In our study, we observed a drastic improvement in the across-group comparison because normalization of aCBF removed the global CBF variation across subjects, which if not accounted for is a significant source of noise. The improvement in the intra-subject comparison was less pronounced because the paired test conducted for the intra-subject aCBF data uses each subject as his own control and such a test already accounted for the inter-subject variation in global CBF.
In the Monte Carlo simulation, we showed the conditions under which the improvement in detection power is most pronounced (Fig. 6c). When the CBF difference is large and SNR is high, then the detection power is excellent for both aCBF and rCBF thus the normalization procedures do not provide much improvement. Similarly, when the CBF difference is small and SNR is low, everything is buried in noise and no improvement can be made. Only in the intermediate situation where CBF difference is small but SNR is relative high, the rCBF shows a clear advantage. Interestingly, most of neuropsychiatric studies fall into this range (CBF difference between patient and control group is around 10–20%) [31–34]. The gray matter SNR in our experimental data was around 4.1 on a single voxel level. With additional spatial smoothing in the group analysis (typically applied to account for small differences in sulci/gyri location across subjects), a SNR of about 8 to 10 is expected. The benefit of the proposed normalization method also relies on the assumption that the source of estimated CBF variation across subjects is primarily physiologic rather than associated with the ASL technique. We have calculated the technique-related uncertainty in individual CBF estimation and found that it is about one quarter of the variation across subjects.
The findings from the present study is consistent with a previous report by Parkes et al. who showed that a CASL scan of 6 minutes can provide reliable CBF maps with a single-voxel reproducibility (defined as 95% confidence limit) of 26% [35]. On the other hand, the inter-subject variation is 2–3 times greater than this value. For a ROI CBF value where many voxels are spatially averaged, the relative contribution from inter-subject variation is expected to be even greater.
5. Conclusions
ASL MRI is capable of detecting regional CBF changes across subject groups. Relative CBF is a more sensitive index in terms of detection power, rather than the much-sought-after absolute CBF, because it reduces physiologic noise associated with inter-subject variations in global CBF.
Acknowledgements
This study was supported in part by the VA IDIQ contract number VA549-P-0027 awarded and administered by the Dallas, TX VA Medical Center. The content of this paper does not necessarily reflect the position or the policy of the U.S. government, and no official endorsement should be inferred. The authors would like to express gratitude to Jinsoo Uh for technical assistance and Nyaz Didehbani for scientific editing of the manuscript.
Grant Sponsors: NIH R01 MH084021, NIH R21 EB007821, NIH R21 AG034318, Department of Veterans Affairs VA549P0027
Footnotes
Publisher's Disclaimer: This is a PDF file of an unedited manuscript that has been accepted for publication. As a service to our customers we are providing this early version of the manuscript. The manuscript will undergo copyediting, typesetting, and review of the resulting proof before it is published in its final citable form. Please note that during the production process errors may be discovered which could affect the content, and all legal disclaimers that apply to the journal pertain.
References
- 1.Carrera E, Maeder-Ingvar M, Rossetti AO, Devuyst G, Bogousslavsky J. Trends in risk factors, patterns and causes in hospitalized strokes over 25 years: The Lausanne Stroke Registry. Cerebrovasc Dis. 2007;24(1):97–103. doi: 10.1159/000103123. [DOI] [PubMed] [Google Scholar]
- 2.Weiss JS, Sumpio BE. Review of prevalence and outcome of vascular disease in patients with diabetes mellitus. Eur J Vasc Endovasc Surg. 2006;31(2):143–150. doi: 10.1016/j.ejvs.2005.08.015. [DOI] [PubMed] [Google Scholar]
- 3.Nagata K, Maruya H, Yuya H, Terashi H, Mito Y, Kato H, Sato M, Satoh Y, Watahiki Y, Hirata Y, Yokoyama E, Hatazawa J. Can PET data differentiate Alzheimer's disease from vascular dementia? Ann N Y Acad Sci. 2000;903:252–261. doi: 10.1111/j.1749-6632.2000.tb06375.x. [DOI] [PubMed] [Google Scholar]
- 4.Roy CS, Sherrington CS. On the Regulation of the Blood-supply of the Brain. J Physiol. 1980;11(1–2):85–158. 117. doi: 10.1113/jphysiol.1890.sp000321. [DOI] [PMC free article] [PubMed] [Google Scholar]
- 5.Sherrington CS. Further Note on Degenerations following Lesions of the Cerebral Cortex. J Physiol. 1890;11(4–5):399–400. doi: 10.1113/jphysiol.1890.sp000339. [DOI] [PMC free article] [PubMed] [Google Scholar]
- 6.Raichle ME, MacLeod AM, Snyder AZ, Powers WJ, Gusnard DA, Shulman GL. A default mode of brain function. Proc Natl Acad Sci U S A. 2001;98(2):676–682. doi: 10.1073/pnas.98.2.676. [DOI] [PMC free article] [PubMed] [Google Scholar]
- 7.Fox PT, Raichle ME. Focal physiological uncoupling of cerebral blood flow and oxidative metabolism during somatosensory stimulation in human subjects. Proc Natl Acad Sci U S A. 1986;83(4):1140–1144. doi: 10.1073/pnas.83.4.1140. [DOI] [PMC free article] [PubMed] [Google Scholar]
- 8.Ogawa S, Lee TM, Kay AR, Tank DW. Brain magnetic resonance imaging with contrast dependent on blood oxygenation. Proc Natl Acad Sci U S A. 1990;87(24):9868–9872. doi: 10.1073/pnas.87.24.9868. [DOI] [PMC free article] [PubMed] [Google Scholar]
- 9.Eisenberg DP, Sarpal D, Kohn PD, Meyer-Lindenberg A, Wint D, Kolachana B, Apud J, Weinberger DR, Berman KF. Catechol-O-Methyltransferase Valine(158)Methionine Genotype and Resting Regional Cerebral Blood Flow in Medication-Free Patients with Schizophrenia. Biol Psychiatry. 2008 doi: 10.1016/j.biopsych.2009.08.039. [DOI] [PMC free article] [PubMed] [Google Scholar]
- 10.Johnson NA, Jahng GH, Weiner MW, Miller BL, Chui HC, Jagust WJ, Gorno-Tempini ML, Schuff N. Pattern of cerebral hypoperfusion in Alzheimer disease and mild cognitive impairment measured with arterial spin-labeling MR imaging: initial experience. Radiology. 2005;234(3):851–859. doi: 10.1148/radiol.2343040197. [DOI] [PMC free article] [PubMed] [Google Scholar]
- 11.Derejko M, Slawek J, Lass P, Nyka WM. Cerebral blood flow changes in Parkinson's disease associated with dementia. Nucl Med Rev Cent East Eur. 2001;4(2):123–127. [PubMed] [Google Scholar]
- 12.Schuff N, Matsumoto S, Kmiecik J, Studholme C, Du A, Ezekiel F, Miller BL, Kramer JH, Jagust WJ, Chui HC, Weiner MW. Cerebral blood flow in ischemic vascular dementia and Alzheimer's disease, measured by arterial spin-labeling magnetic resonance imaging. Alzheimers Dement. 2009;5(6):454–462. doi: 10.1016/j.jalz.2009.04.1233. [DOI] [PMC free article] [PubMed] [Google Scholar]
- 13.Mintun MA, Raichle ME, Martin WR, Herscovitch P. Brain oxygen utilization measured with O-15 radiotracers and positron emission tomography. J Nucl Med. 1984;25(2):177–187. [PubMed] [Google Scholar]
- 14.Devous MD, Sr, Stokely EM, Chehabi HH, Bonte FJ. Normal distribution of regional cerebral blood flow measured by dynamic single-photon emission tomography. J Cereb Blood Flow Metab. 1986;6(1):95–104. doi: 10.1038/jcbfm.1986.12. [DOI] [PubMed] [Google Scholar]
- 15.Wang J, Zhang Y, Wolf RL, Roc AC, Alsop DC, Detre JA. Amplitude-modulated continuous arterial spin-labeling 3.0-T perfusion MR imaging with a single coil: feasibility study. Radiology. 2005;235(1):218–228. doi: 10.1148/radiol.2351031663. [DOI] [PubMed] [Google Scholar]
- 16.Golay X, Hendrikse J, Lim TC. Perfusion imaging using arterial spin labeling. Top Magn Reson Imaging. 2004;15(1):10–27. doi: 10.1097/00002142-200402000-00003. [DOI] [PubMed] [Google Scholar]
- 17.Detre JA, Leigh JS, Williams DS, Koretsky AP. Perfusion imaging. Magn Reson Med. 1992;23(1):37–45. doi: 10.1002/mrm.1910230106. [DOI] [PubMed] [Google Scholar]
- 18.Williams DS, Detre JA, Leigh JS, Koretsky AP. Magnetic resonance imaging of perfusion using spin inversion of arterial water. Proc Natl Acad Sci U S A. 1992;89(1):212–216. doi: 10.1073/pnas.89.1.212. [DOI] [PMC free article] [PubMed] [Google Scholar]
- 19.Wong EC, Buxton RB, Frank LR. Implementation of quantitative perfusion imaging techniques for functional brain mapping using pulsed arterial spin labeling. NMR Biomed. 1997;10(4–5):237–249. doi: 10.1002/(sici)1099-1492(199706/08)10:4/5<237::aid-nbm475>3.0.co;2-x. [DOI] [PubMed] [Google Scholar]
- 20.Petersen ET, Lim T, Golay X. Model-free arterial spin labeling quantification approach for perfusion MRI. Magn Reson Med. 2006;55(2):219–232. doi: 10.1002/mrm.20784. [DOI] [PubMed] [Google Scholar]
- 21.Edelman RR, Siewert B, Darby DG, Thangaraj V, Nobre AC, Mesulam MM, Warach S. Qualitative mapping of cerebral blood flow and functional localization with echo-planar MR imaging and signal targeting with alternating radio frequency. Radiology. 1994;192(2):513–520. doi: 10.1148/radiology.192.2.8029425. [DOI] [PubMed] [Google Scholar]
- 22.Kim SG. Quantification of relative cerebral blood flow change by flow-sensitive alternating inversion recovery (FAIR) technique: application to functional mapping. Magn Reson Med. 1995;34(3):293–301. doi: 10.1002/mrm.1910340303. [DOI] [PubMed] [Google Scholar]
- 23.Liu TT, Behzadi Y, Restom K, Uludag K, Lu K, Buracas GT, Dubowitz DJ, Buxton RB. Caffeine alters the temporal dynamics of the visual BOLD response. Neuroimage. 2004;23(4):1402–1413. doi: 10.1016/j.neuroimage.2004.07.061. [DOI] [PubMed] [Google Scholar]
- 24.Laurienti PJ, Field AS, Burdette JH, Maldjian JA, Yen YF, Moody DM. Relationship between caffeine-induced changes in resting cerebral perfusion and blood oxygenation level-dependent signal. AJNR Am J Neuroradiol. 2003;24(8):1607–1611. [PMC free article] [PubMed] [Google Scholar]
- 25.Cohen ER, Ugurbil K, Kim SG. Effect of basal conditions on the magnitude and dynamics of the blood oxygenation level-dependent fMRI response. J Cereb Blood Flow Metab. 2002;22(9):1042–1053. doi: 10.1097/00004647-200209000-00002. [DOI] [PubMed] [Google Scholar]
- 26.Wu WC, Fernandez-Seara M, Detre JA, Wehrli FW, Wang J. A theoretical and experimental investigation of the tagging efficiency of pseudocontinuous arterial spin labeling. Magn Reson Med. 2007;58(5):1020–1027. doi: 10.1002/mrm.21403. [DOI] [PubMed] [Google Scholar]
- 27.Wong EC. Vessel-encoded arterial spin-labeling using pseudocontinuous tagging. Magn Reson Med. 2007;58(6):1086–1091. doi: 10.1002/mrm.21293. [DOI] [PubMed] [Google Scholar]
- 28.Aslan SXF, Wang PL, Uh J, Yezhuvath U, van Osch M, Lu H. Estimation of Labeling Efficiency in pseudo-Continuous Arterial Spin Labeling. Magn Reson Med. 2010 doi: 10.1002/mrm.22245. In Press. [DOI] [PMC free article] [PubMed] [Google Scholar]
- 29.Tzourio-Mazoyer N, Landeau B, Papathanassiou D, Crivello F, Etard O, Delcroix N, Mazoyer B, Joliot M. Automated anatomical labeling of activations in SPM using a macroscopic anatomical parcellation of the MNI MRI single-subject brain. Neuroimage. 2002;15(1):273–289. doi: 10.1006/nimg.2001.0978. [DOI] [PubMed] [Google Scholar]
- 30.Ashburner J, Friston KJ. Voxel-based morphometry--the methods. Neuroimage. 2000;11(6 Pt 1):805–821. doi: 10.1006/nimg.2000.0582. [DOI] [PubMed] [Google Scholar]
- 31.Alsop DC, Detre JA, Grossman M. Assessment of cerebral blood flow in Alzheimer's disease by spin-labeled magnetic resonance imaging. Ann Neurol. 2000;47(1):93–100. [PubMed] [Google Scholar]
- 32.Theberge J. Perfusion magnetic resonance imaging in psychiatry. Top Magn Reson Imaging. 2008;19(2):111–130. doi: 10.1097/RMR.0b013e3181808140. [DOI] [PubMed] [Google Scholar]
- 33.Lavy S, Melamed E, Cooper G, Bentin S, Rinot Y. Regional cerebral blood flow in patients with Parkinson's disease. Arch Neurol. 1979;36(6):344–348. doi: 10.1001/archneur.1979.00500420054005. [DOI] [PubMed] [Google Scholar]
- 34.Dousse M, Mamo H, Ponsin JC, Tran Dinh Y. Cerebral blood flow in schizophrenia. Exp Neurol. 1988;100(1):98–111. doi: 10.1016/0014-4886(88)90204-x. [DOI] [PubMed] [Google Scholar]
- 35.Parkes LM, Rashid W, Chard DT, Tofts PS. Normal cerebral perfusion measurements using arterial spin labeling: reproducibility, stability, and age and gender effects. Magn Reson Med. 2004;51(4):736–743. doi: 10.1002/mrm.20023. [DOI] [PubMed] [Google Scholar]


