Abstract
Graphene was utilized for the first time as matrix for the analysis of low-molecular weight compounds using matrix-assisted laser desorption/ionization time-of-flight mass spectrometry (MALDI-TOF MS). Polar compounds including amino acids, polyamines, anticancer drugs and nucleosides could be successfully analyzed. Additionally, nonpolar compounds including steroids could be detected with high resolution and sensitivity. Compared with conventional matrix, graphene exhibited high desorption/ionization efficiency for nonpolar compounds. The graphene matrix functions as substrate to trap analytes, and it transfers energy to the analytes upon laser irradiation, which allowed for the analytes to be readily desorbed/ionized and interference of intrinsic matrix ions to be eliminated. The use of graphene as matrix avoided the fragmentation of analytes and provided good reproducibility and high salt tolerance, underscoring the potential application of graphene as matrix for MALDI-MS analysis of practical samples in complex sample matrices. We also demonstrated that the use of graphene as adsorbent for the solid-phase extraction of squalene could improve greatly the detection limit. This work not only opens a new field for applications of graphene, but also offers a new technique for high-speed analysis of low-molecular weight compounds in areas such as metabolism research and natural products characterization.
Introduction
Matrix-assisted laser desorption/ionization time-of-flight mass spectrometry (MALDI-TOF MS)1 provides a simple analytical approach for high-molecular mass species, such as proteins, DNA/RNA, polysaccharides, synthetic polymers, and so on.2–6 Together with the use of TOF-TOF mass analyzer7–9, it also offers structural information of molecules with high speed, accuracy, and sensitivity.
For low-mass analytes (with molecular weight < 500 Da), matrix ion interference and detector saturation are, however, unavoidable in MALDI-TOF MS, which renders the characterization of small molecules obscured and difficult. Recently, many efforts have been made to eliminate matrix ion interference by using different matrix substances, such as desorption/ionization on porous silicon,10–13 matrix with high molecular weight,14, 15 surfactant-suppressed matrix,16 inorganic materials,17, 18 etc. Different kinds of carbon-based materials, including graphite particles,19 graphite plates17, graphite suspension in different solvents,17, 20 graphite trapped in silicone polymer,21 activated carbon powders,18 and more recently pencil lead22, 23 have been suggested as alternative matrices for MALDI-TOF MS.
Graphene is essentially an isolated atomic plane of graphite. In 2004, Chernogolovka24 discovered graphene planes by using Scotch tape and improved its high electric conductivity. Since then, graphene has stimulated intense interest and has been extensively studied theoretically and experimentally, and graphene may have potential applications as single-molecule sensor25, ballistic transistors24, transparent conducting electrodes26 and selective detection of dopamine27. However, graphene has never been used as matrix for MALDI-TOF MS.
In this study, graphene was used as a novel matrix for MALDI-TOF MS analysis of small molecules. The graphene functions to trap the analyte molecules and acts as an energy receptacle for laser radiation. Due to the large surface area of its nanosheet structure, it can attach to the sample target more tightly. This prevented the detachment of graphene from the sample target under vacuum, which avoids the contamination of the ion source and vacuum system. On the other hand, the efficiency of desorption/ionization for analytes on matrix layer of graphene may be enhanced for its simple monolayer structure and unique electronic properties. It has been found that the utilization of graphene as matrix for small-molecule analysis could greatly simplify sample preparation and eliminate interference from background matrix ions. This new matrix has been tested and demonstrated to be useful for the facile analysis of amino acids, polyamines, anticancer drugs, nucleosides and steroids.
Experimental Section
Chemicals and Materials
Trifluoroacetic acid (TFA) and α-cyano-4-hydroxycinnamic acid (CHCA) were purchased from Fluka (St. Louis, MO). Cholesterol, squalene, cyclophosphamide, cytosine β-D-arabinofuranoside, amino acids of Glu, His and Trp and polyamines of spermine, spermidine and putrescine were all obtained from Sigma (St. Louis, MO). Other reagents were of analytical grade with the exception of ethanol and acetonitrile, which were of HPLC grade. The water used in all experiments was prepared from a Milli-Q water purification system (Millipore, Milford, MA).
Preparation of Graphene
Graphene was prepared using previously described procedures28. The obtained graphene was characterized by TEM analysis using JEM-2010 transmission electron microscope (JEOL, Tokyo, Japan) at an accelerating voltage of 100 kV and by powder X-ray diffraction on a Bruker D8-Advance X-ray powder diffractometer (Madison, WI).
Preparation of Analyte Solutions
Spermine, spermidine, putrescine, cyclophosphamide, cytosine β-D-arabinofuranoside, 2'-deoxyribonucleosides (dA, dG, dC, dT), amino acids of Glu, His, and Trp were all dissolved in water at the concentration of 10 mM as stock solution, and the mixture solutions were prepared by diluting the stock solutions with water until the final concentrations of analytes reached 0.5–1.0 mM each. Cholesterol and squalene were dissolved in ethanol to give a 10-mM stock solution, and sample solutions at other concentrations were obtained by step dilution. All stock solutions were kept at ~4 °C for further use.
Sample Preparation for MALDI-TOF MS
CHCA matrix was prepared as a saturated solution in 0.1% TFA in water/acetonitrile (2/1, vol/vol). Graphene (1 mg) was dispersed in a 1-mL solution of ethanol and sonicated for 3 min, and 1 μL suspension was pipetted onto the sample target quickly. It was left in air at room temperature for 5 to 10 min to form a thin layer, and a 0.5-μL solution of analyte was then pipetted onto the layer of matrix and left in air for 5–10 min for evaporation of the solvent and for further analysis by MALDI-TOF-MS.
Solid-phase Extraction (SPE) prior to MALDI-TOF MS Analysis with Graphene as Adsorbent and Matrix
Two mg graphene was rinsed twice with acetonitrile and water and suspended in 0.3 mL 50% (vol/vol) methanol. After sonication for 3 min, 10 μL of the suspension was pipetted immediately into 100 μL of analyte solution. The mixture was then sonicated for 10 min. After centrifugation at 13,000 rpm for 10 min, the supernatant was removed, and the pellet of graphene on which the analytes were enriched, was resuspended in a 5-μL solution of methanol in H2O (1/1, v/v). Finally, about 1 μL suspension of the graphene was pipetted onto the sample target. The sample target was again left at room temperature for 10–15 min for evaporation of the solvent and for further analysis by MALDI-TOF MS.
Mass Spectrometry
Laser desorption/ionization and matrix-assisted laser desorption/ionization mass spectra were acquired on a Voyager DE STR MALDI-TOF mass spectrometer (Applied Biosystems, Framingham, MA) in positive reflection mode. The mass spectrometer was equipped with a pulsed nitrogen laser operated at 337 nm with 3 ns-duration pulses. The acceleration voltage, grid voltage, and delayed extraction time were set as 20 kV, 65%, and 190 ns, respectively. Each mass spectrum was acquired as an average of 100 laser shots.
Result and Discussion
In this work, graphene was first used as the matrix for MALDI-TOF MS analysis. Graphene is a two-dimensional carbon crystal with only one atom thickness. Because of its unique structure and electronic properties24, graphene has been increasingly used and has attracted more and more attention. Application of graphene in fluorescent sensing technology has been achieved due to its excellent capability in fluorescence resonance energy transfer28. Graphene exhibits maximum UV absorption at 270 nm29, and also absorbs in the wavelength range of 250–350 nm. Thus, we reason that it might serve as a matrix for MALDI-TOF MS analysis on a typical instrument equipped with a N2 laser delivering 337 nm light.
Characterization of Graphene
We first characterized the properties of graphene used in this study. Shown in Figure S1a is the TEM image of graphene. As can be seen, graphene has a nearly transparent flake-like shape with characteristic crumpled silk waves28. This nanosheet structure was further confirmed by XRD characterization (Figure S1b, peak at 2θ = 24.7° revealed the existence of graphene nanosheets30). Evidently, these special monolayer characteristics could provide some unique properties to graphene when it is used in MALDI analysis. First, graphene could be homogenously dispersed in ethanol after sonication. Therefore, on the sample target, it can form a homogenous matrix layer. Moreover, this layer can attach to the sample target tightly and could not be rinsed out easily by water or ethanol. In addition, the monolayer structure can provide high surface area which improves the adsorption ability of the analyte to this matrix layer, thereby enhancing MS signal. Other advantages of single-layer morphology may include the good energy transfer ability, less interference of matrix-related ions due to the simple structure of this material. These properties suggest that graphene may serve as a good matrix for MALDI mass spectrometry.
Analysis of Amino Acids with Graphene
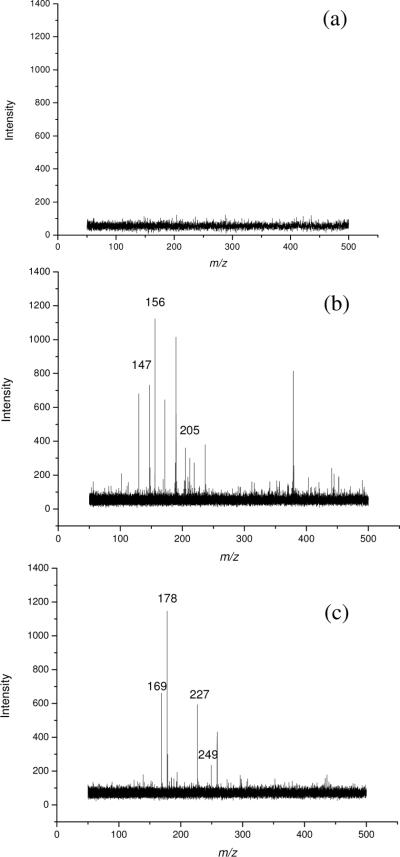
Amino acids were first chosen as representative small molecules for MALDI-TOF MS analysis by employing graphene as matrix. Displayed in Figure 1 are the mass spectra of an amino acid mixture consisting of Glu, His, and Trp in the LDI mode without any matrix (Figure 1a), and with CHCA (Figure 2b) or graphene (Figure 1c) as matrix. The concentration of each compound was 0.5 mM. Not surprisingly, there were no signals of analytes in LDI mode without any matrix (Figure 1a). All 3 amino acids were detected as the [M +H]+ ions (Glu, m/z 147; His, m/z 156; and Trp m/z 205) with conventional CHCA or graphene matrix (Figure 1b&c). However, strong background interferences were present while CHCA was used as matrix, which greatly obscured the detection of low-molecular weight compounds. By using graphene, all 3 amino acids were detected with high peak intensities (Figure 1c) and, more importantly, matrix ion interference was completely eliminated. In addition, very few or no fragment ion peaks of the analytes could be observed, suggesting that graphene was a “soft” matrix for MALDI-TOF MS analysis.
Figure 1.
MALDI-TOF mass spectra of a solution containing Glu (m/z 147, [M+H]+; m/z 169, [M+Na]+), His (m/z 156, [M+H]+; m/z 178, [M+Na]+) and Trp (m/z 205, [M+H]+; m/z 227, [M+Na]+; m/z 249, [M+K]+) in the: (a) LDI mode without matrix, and with matrix of CHCA (b) or graphene (c). A 0.5 μL sample solution was deposited on the target spots and the concentrations of all analytes were at 0.5 mM each.
Figure 2.
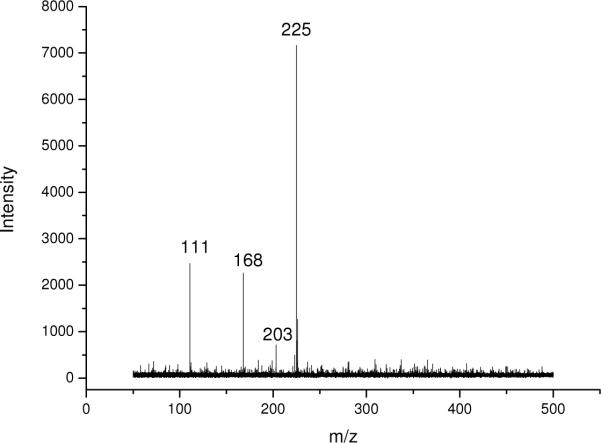
MALDI-TOF mass spectrum of a polyamine mixture containing 1 mM each of spermine (m/z 203, [M+H]+; m/z 225, [M+Na]+), spermidine (m/z 168, [M+Na]+) and putrescine (m/z 111, [M+Na]+). Graphene was used as matrix.
The effect of laser power was also investigated. When the laser power was set at 1500 (arbitrary units), both graphene and CHCA can generate mass spectra with good signal-to-noise (S/N). While the laser power setting was decreased to 1300, there was nearly no signal for any of these 3 amino acids by using CHCA as the matrix. However, good signal could be obtained with graphene as matrix. Evidently, lower laser power was needed while graphene was used as matrix for the desorption/ionization of small molecules. This may be due to its nanosheet structure, which facilitated strong adsorption of analyte and efficient energy transfer to the analyte.
Clearly, analysis of a mixture of small molecules using MALDI MS with an organic matrix could be achieved under suitable conditions, but the matrix interference remains a real problem (Figure 1b). However, this problem can be avoided by desorption/ionization mass spectrometry with graphene as matrix. Moreover, successful MALDI experiments for analysis of different classes of small molecules strongly depend on the choice of matrix and sample preparation methods, yet this continues to be an empirical consideration. In this work with the use of graphene, the analyte solutions were simply deposited onto the graphene layer on the probe, and the graphene acted as a matrix medium to trap the analyte molecules. Therefore, the use of graphene as matrix obviates the needs for optimizing solvent conditions for different analytes and simplifies the sample preparation.
Analysis of Other Types of Small Molecules
The use of graphene for the desorption/ionization of analytes was further investigated using other types of analytes. Polyamines play an important role in DNA synthesis and gene expression31–33, and they are involved in cell migration, proliferation and differentiation in plants and animals34. Spermine, spermidine and putrescine are the three major polyamines in cells. We further analyzed the polyamines using graphene-assisted LDI-TOF MS. Similarly, all components in the mixture were simultaneously desorbed from graphene and ionized as the sodium adducts (i.e., [M + Na]+ ions), while spermidine could also be ionized as the [M + H]+ ion (Figure 2). Interestingly, metal ions were the main chemical adduct for both amino acids and polyamines analyzed by MALDI with graphene as matrix; and [M + H]+ peaks of most of these compounds were not observed in the mass spectra. This is reminiscent of the results obtained from amino acid analysis using the oxidized carbon nanotubes as the matrix35. Graphene-assisted LDI could constitute a facile method for the future analysis of polyamines extracted from tissues or cells.
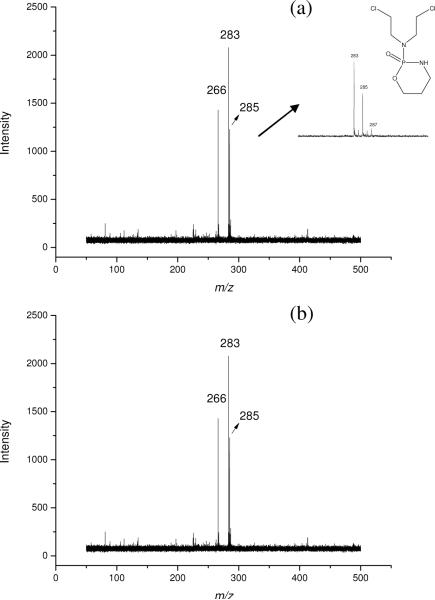
We also analyzed anticancer drugs using graphene-assisted LDI MS. Shown in Figure 3a is the mass spectrum of cyclophosphamide and cytosine β-D-arabinofuranoside. Peaks of m/z at 266 and 283 could be assigned as the [M + Na]+ ions of cytosine β-D-arabinofuranoside and cyclophosphamide, respectively. As cyclophosphamide contains two chloride atoms, the main isotope peaks were assigned to be 283 and 285. We next investigated the detection of these drugs in high salt solution since the drug was often injected into human body with supplement of sodium chloride and the study of its metabolism may also involve analytes present in a matrix containing high concentrations of salts (e.g., urine and plasma samples). Figure 3b displays the analysis of two drugs which were prepared in a solution bearing 500 mM NaCl. Although the signal intensity decreased slightly, both of them could still be clearly detected, which illustrated the potential of this new technique for drug metabolism studies.
Figure 3.
MALDI-TOF mass spectra of cyclophosphamide and cytosine β-D-arabinofuranoside on graphene. The peaks at m/z 283 and 266 correspond to the [M+Na]+ ions of cyclophosphamide and cytosine β-D-arabinofuranoside, respectively: (a) sample in water solution; (b) sample in 500 mM NaCl solution.
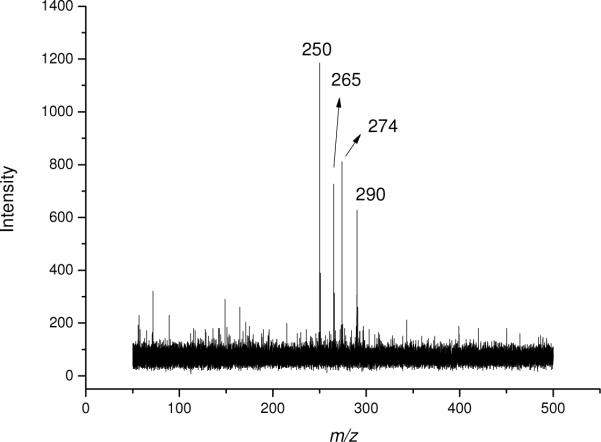
A mixture of four nucleosides was also successfully analyzed by MALDI-TOF MS using graphene as matrix. As depicted in Figure 4, peaks at m/z 250, 265, 274 and 290 can be assigned as the [M + Na]+ ions of dC, dT, dA and dG. The background was clean and no fragment ions were observed.
Figure 4.
MALDI-TOF mass spectrum of a mixture of four 2'-deoxyribonucleosides at 0.5 mM each. Peaks of m/z at 250, 265, 274 and 290 correspond to the [M+Na]+ ions of dC, dT, dA and dG, respectively.
Analysis of Nonpolar Compounds
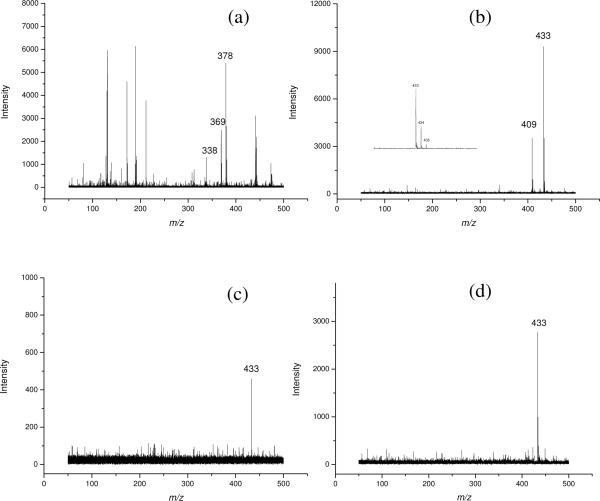
Another example is the analysis of cholesterol and squalene, and the latter is the precursor for cholesterol biosynthesis. Both compounds are highly hydrophobic and not easily protonated and ionized. Cholesterol was previously analyzed using traditional matrix such as 2,5-dihydroxybenzoic acid (DHB), but the interference of matrix ion greatly obscured its detection.36 While using graphene as matrix, these two compounds can be simultaneously desorbed and ionized with high S/N ratio. As revealed in Figure 5b, both of them are ionized as the [M + Na]+ ions with high intensities and clean background due to the absence of matrix interference. The peak intensity of squalene was nearly 3 times higher than that of cholesterol, which may be due to the different desorption/ionization process of squalene and cholesterol from the graphene matrix.
Figure 5.
MALDI-TOF mass spectra of: (a) cholesterol (m/z 369, [M-H2O+H]+) and squalene (m/z 433, [M+Na]+) with the use of CHCA as matrix; (b) cholesterol (m/z 409, [M+Na]+) and squalene (m/z 433, [M+Na]+), with the use of graphene as matrix; (c) graphene as adsorbent for SPE of squalene at 20 μM; (d) graphene as matrix for SPE of squalene at 0.2 μM.
For comparison, CHCA was also employed as the matrix for the analysis of these two compounds. Peak assigned to cholesterol (m/z 369) revealed the loss of H2O and the peaks of m/z at 378 and 338 were attributed to matrix-related ions (Figure 5a). However, cholesterol could be detected as intact sodium adduct ion (m/z 409) in the case of graphene as the matrix (vide supra), indicating that graphene is a soft matrix for MALDI MS. Interestingly, no signal of squalene could be detected with CHCA as matrix under otherwise the same experimental conditions, which might be attributed to the poor ionization of nonpolar compounds with the use of CHCA as matrix; nonpolar compounds are known to be difficult to ionize.37
Silver ion was often added to the solution of nonpolar compounds to assist their ionization37, but it would result in two isotope peaks of target compound (due to the introduction of Ag+) and complicate the sample preparation. In our work, the squalene solution prepared with ethanol was just deposited directly onto the graphene layer on the target plate, and the graphene acted as a matrix medium to trap the analyte molecules. As depicted in Figure 5b, by using graphene as matrix, squalene could be readily detected even at low laser energy (1450) and without the addition of any other assisted solvent. The detailed mechanism is not clear, but we suspect that two factors may contribute to the facile desorption/ionization of squalene on graphene. One is through hydrophobic/hydrophobic interaction between graphene and nonpolar compounds, and the other may be related to the electronic property of graphene28, where streams of conjugated electrons on its nanosheet could function both as the energy receptacle for UV laser radiation and the energy transporter to facilitate the desorption/ionization of analytes. Therefore, graphene's great capability in energy transfer was demonstrated by its usefulness as matrix for the laser-induced desorption/ionization of various types of small molecules.
Graphene as Adsorbent for Solid-phase Extraction
Graphene is an electron-rich hydrophobic material with high surface area. Therefore, it may serve as suitable material for solid-phase extraction. To test this, we used graphene for the solid-phase extraction of squalene from a 20-μM solution. After enrichment, graphene was directly analyzed using MALDI-TOF MS and good signal was obtained (Figure 5c). We further lower the concentration of squalene to 0.2 μM, and it turned out that the analyte could still be readily detected by MALDI-MS after SPE with the use of graphene (Figure 5d). This is especially useful for sample concentration and contaminant removal. Therefore, graphene's dual capability as SPE adsorbent and MALDI matrix offered a powerful and rapid technique for the detection of small molecules in complicated sample matrices. Obviously, MALDI-TOF MS with the use of graphene as matrix has great potential for application in the detection of a variety of low-molecular weight species while simplifying sample preparation.
Reproducibility of Analysis while Using Graphene as Matrix
We compared the reproducibilities of ion peaks of spermine by using the CHCA and graphene matrix. Ten mass spectra were recorded continuously from a discrete location in the probe well where each mass spectrum was obtained by applying 10 laser shots. The graphene matrix produced higher signal intensities and better shot-to-shot reproducibility of the spermine signal than the CHCA matrix. The relative standard deviation (RSD) of peak intensities for spermine within one sample spot by averaging 10 spectra was around 40% with CHCA matrix, while the RSD value was as low as 14% for graphene matrix. This may be due to the homogeneous distribution of analyte molecules on the graphene layer, which contrasts with heterogeneous crystals formed from analyte molecules and conventional organic matrix. Thus, MALDI with graphene as matrix may provide a solid foundation for improving quantitative analysis of small molecules with clean spectral background.
Above results clearly demonstrated that graphene can be used as a new matrix for the high-speed MALDI MS analysis of small molecules. No observable peak signals were obtained if laser light at a power setting of 1400–1800 was irradiated on graphene without any sample molecules, which is similar to the result of sample molecules directly placed on the metal target and indicates that graphene is stable under laser irradiation conditions. Furthermore, the graphene surface activity can be modified via derivatization with other functional groups, which may extend its application in mass spectrometry analysis. However, the mechanism for desorption and ionization of small molecules on the graphene matrix is not well understood, though energy transfer from laser irradiation to the sample molecules through graphene should be one of the most important processes.
Conclusions
In this work, graphene was utilized as a novel matrix for the analysis of small-molecule compounds using MALDI-TOF MS. Compared with conventional matrices such as CHCA, graphene has several advantages, including simple sample preparation, high efficiency in analyte desorption/ionization, improved reproducibility of peak intensities for analytes, etc.
The matrix is successfully used for the analyses of amino acids, polyamines, steroids, anticancer drugs and nucleosides. The high salt tolerance revealed its potential usage in analyzing small molecules present in complicated sample matrices. It also showed great advantages for the analysis of nonpolar compounds. Additionally, we observed that the limit of detection for analytes could be enhanced if graphene was used for solid-phase extraction of analytes in solution prior to MS analysis. Furthermore, graphene as matrix provided a lower laser power threshold for desorption/ionization and higher signal of small molecules than organic matrices. Using graphene as matrix can greatly simplify sample preparation, eliminate interference of matrix background ions, and improve shot-to-shot reproducibility. However, the sensitivity for the measurement is still not too high and it can be potentially improved in future studies through chemical derivatization of graphene. Taken together, our work opens a new field for graphene applications and it provides a new matrix for rapid MALDI-MS analysis of low-molecular weight compounds in areas such as metabolism research and natural products characterization.
Supplementary Material
Acknowledgement
This work was supported by the National Institutes of Health (R01 CA 116522 to Y. W.), the National Natural Science Foundation of China (No. 20975060 to J. L.), and the National Basic Research Program of China (No. 2007CB310500 to J. L.).
Footnotes
Supporting Information Available TEM and XRD characterizations of graphene. This material is available free of charge via the Internet at http://pubs.acs.org.
References
- (1).Karas M, Hillenkamp F. Anal. Chem. 1988;60:2299–2301. doi: 10.1021/ac00171a028. [DOI] [PubMed] [Google Scholar]
- (2).Fenselau C, Demirev PA. Mass Spectrom. Rev. 2001;20:157–171. doi: 10.1002/mas.10004. [DOI] [PubMed] [Google Scholar]
- (3).Harvey DJ. Mass Spectrom. Rev. 1999;18:349–450. doi: 10.1002/(SICI)1098-2787(1999)18:6<349::AID-MAS1>3.0.CO;2-H. [DOI] [PubMed] [Google Scholar]
- (4).Lay JO. Mass Spectrom. Rev. 2001;20:172–194. doi: 10.1002/mas.10003. [DOI] [PubMed] [Google Scholar]
- (5).Tang K, Opalsky D, Abel K, van den Boom D, Yip P, Del Mistro G, Braun A, Cantor CR. Int. J. Mass Spectrom. 2003;226:37–54. [Google Scholar]
- (6).Nielen MWF. Mass Spectrom. Rev. 1999;18:309–344. [Google Scholar]
- (7).Resemann A, Wunderlich D, Rothbauer U, Warscheid B, Leonhardt H, Fuchser J, Kuhlmann K, Suckau D. Anal. Chem. 82:3283–3292. doi: 10.1021/ac1000515. [DOI] [PubMed] [Google Scholar]
- (8).Fagerquist CK, Garbus BR, Williams KE, Bates AH, Harden LA. J. Am. Soc. Mass Spectrom. 21:819–832. doi: 10.1016/j.jasms.2010.01.013. [DOI] [PubMed] [Google Scholar]
- (9).Trimpin S, Clemmer DE, McEwen CN. J. Am. Soc. Mass Spectrom. 2007;18:1967–1972. doi: 10.1016/j.jasms.2007.08.013. [DOI] [PubMed] [Google Scholar]
- (10).Wei J, Buriak JM, Siuzdak G. Nature. 1999;399:243–246. doi: 10.1038/20400. [DOI] [PubMed] [Google Scholar]
- (11).Lewis WG, Shen ZX, Finn MG, Siuzdak G. Int. J. Mass Spectrom. 2003;226:107–116. [Google Scholar]
- (12).Zhang QC, Zou HF, Guo Z, Zhang Q, Chen XM, Ni JY. Rapid Commun. Mass Spectrom. 2001;15:217–223. [Google Scholar]
- (13).Zou HF, Zhang QC, Guo Z, Guo BC, Zhang Q, Chen XM. Angew. Chem. Int. Ed. 2002;41:646–+. [Google Scholar]
- (14).Ayorinde FO, Garvin K, Saeed K. Rapid Commun. Mass Spectrom. 2000;14:608–615. doi: 10.1002/(SICI)1097-0231(20000415)14:7<608::AID-RCM918>3.0.CO;2-4. [DOI] [PubMed] [Google Scholar]
- (15).Ayorinde FO, Hambright P, Porter TN, Keith QL. Rapid Commun. Mass Spectrom. 1999;13:2474–2479. doi: 10.1002/(SICI)1097-0231(19991230)13:24<2474::AID-RCM814>3.0.CO;2-0. [DOI] [PubMed] [Google Scholar]
- (16).Guo Z, Zhang QC, Zou HF, Guo BC, Ni JY. Anal. Chem. 2002;74:1637–1641. doi: 10.1021/ac010979m. [DOI] [PubMed] [Google Scholar]
- (17).Sunner J, Dratz E, Chen YC. Anal. Chem. 1995;67:4335–4342. doi: 10.1021/ac00119a021. [DOI] [PubMed] [Google Scholar]
- (18).Chen YC, Shiea J, Sunner J. J. Chromatogr. A. 1998;826:77–86. doi: 10.1016/s0021-9673(98)00726-2. [DOI] [PubMed] [Google Scholar]
- (19).Zumbuhl S, Knochenmuss R, Wulfert S, Dubois F, Dale MJ, Zenobi R. Anal. Chem. 1998;70:707–715. [Google Scholar]
- (20).Dale MJ, Knochenmuss R, Zenobi R. Anal. Chem. 1996;68:3321–3329. doi: 10.1021/ac960558i. [DOI] [PubMed] [Google Scholar]
- (21).Li XP, Wilm M, Franz T. Proteomics. 2005;5:1460–1471. doi: 10.1002/pmic.200401023. [DOI] [PubMed] [Google Scholar]
- (22).Langley GJ, Herniman JM, Townell MS. Rapid Commun. Mass Spectrom. 2007;21:180–190. doi: 10.1002/rcm.2827. [DOI] [PubMed] [Google Scholar]
- (23).Black C, Poile C, Langley J, Herniman J. Rapid Commun. Mass Spectrom. 2006;20:1053–1060. doi: 10.1002/rcm.2408. [DOI] [PubMed] [Google Scholar]
- (24).Novoselov KS, Geim AK, Morozov SV, Jiang D, Zhang Y, Dubonos SV, Grigorieva IV, Firsov AA. Science. 2004;306:666–669. doi: 10.1126/science.1102896. [DOI] [PubMed] [Google Scholar]
- (25).Schedin F, Geim AK, Morozov SV, Hill EW, Blake P, Katsnelson MI, Novoselov KS. Nat. Mater. 2007;6:652–655. doi: 10.1038/nmat1967. [DOI] [PubMed] [Google Scholar]
- (26).Wang X, Zhi LJ, Mullen K. Nano Lett. 2008;8:323–327. doi: 10.1021/nl072838r. [DOI] [PubMed] [Google Scholar]
- (27).Wang Y, Li YM, Tang LH, Lu J, Li JH. Electrochem. Commun. 2009;11:889–892. [Google Scholar]
- (28).Chang HX, Tang LH, Wang Y, Jiang JH, Li JH. Anal. Chem. 2010;82:2341–2346. doi: 10.1021/ac9025384. [DOI] [PubMed] [Google Scholar]
- (29).Choi EY, Han TH, Hong JH, Kim JE, Lee SH, Kim HW, Kim SO. J. Mater. Chem. 20:1907–1912. [Google Scholar]
- (30).Tang LH, Wang Y, Li YM, Feng HB, Lu J, Li JH. Adv. Funct. Mater. 2009;19:2782–2789. [Google Scholar]
- (31).Celano P, Baylin SB, Casero RA. J. Biol. Chem. 1989;264:8922–8927. [PubMed] [Google Scholar]
- (32).Feuerstein BG, Pattabiraman N, Marton LJ. Nucleic Acids Res. 1990;18:1271–1282. doi: 10.1093/nar/18.5.1271. [DOI] [PMC free article] [PubMed] [Google Scholar]
- (33).Casero RA, Celano P, Ervin SJ, Applegren NB, Wiest L, Pegg AE. J. Biol. Chem. 1991;266:810–814. [PubMed] [Google Scholar]
- (34).Pandey S, Ranade SA, Nagar PK, Kumar N. J. Biosci. 2000;25:291–299. doi: 10.1007/BF02703938. [DOI] [PubMed] [Google Scholar]
- (35).Pan CS, Xu SY, Hu LG, Su XY, Ou JJ, Zou HF, Guo Z, Zhang Y, Guo BC. J. Am. Soc. Mass Spectrom. 2005;16:883–892. doi: 10.1016/j.jasms.2005.03.009. [DOI] [PubMed] [Google Scholar]
- (36).Hidaka H, Hanyu N, Sugano M, Kawasaki K, Yamauchi K, Katsuyama T. Ann. Clin. Lab. Sci. 2007;37:213–221. [PubMed] [Google Scholar]
- (37).Gros M, Borros S, Amabilino DB, Veciana J, Folch I. J. Mass Spectrom. 2001;36:294–300. doi: 10.1002/(SICI)1096-9888(200004)35:4<550::AID-JMS968>3.0.CO;2-R. [DOI] [PubMed] [Google Scholar]
Associated Data
This section collects any data citations, data availability statements, or supplementary materials included in this article.


