

Abstract
The unfolding of wild-type holomyoglobin in the ferric state (metMb) appears to be a simple two-state process, even though hemichrome spectra are often observed and apoMb denaturation involves an intermediate. To resolve these discrepancies, we measured GuHCl-induced, equilibrium unfolding of five sperm whale metMb variants, which were selected to examine the relative importance of apoglobin stability and hemin affinity. Combined analysis of CD, Trp fluorescence, and Soret absorbance titration curves for all the variants requires a 6-state mechanism containing native (N), intermediate (I), and unfolded (U) states of apoMb and their hemin bound counterparts, NH (holoMb), IH, and UH. The unfolding parameters for the apoMbs were obtained in independent experiments and then fixed in the analysis of the holoprotein data, where only the affinities of the apoglobin states for hemin were allowed to vary. This cofactor binding analysis applies generally to all globins and led to three specific conclusions. (1) The stability of holo-metMb is determined primarily by the high affinity (Kd ~10−13 M) of native apoMb (N) for hemin. (2) The partially unfolded intermediate with hemin bound (IH) has a hemichrome spectrum indicative of a bis-histidyl axial coordination and is seen clearly when the stability of the N state or its affinity for hemin are reduced. (3) Although the affinity of the intermediate for hemin (Kd ~10−11 M) is ~100-fold less than that for the native state, free hemin can bind to it, and promote the assembly of holoprotein.
Keywords: Myoglobin, Folding, Unfolding, Assembly, Heme Binding Affinity, Cofactor, Globins
For the past 50 years, mammalian myoglobin (Mb) has served as the key model system for structure/function studies of 3-on-3 helical globins (1–4). The cofactor in native Mb is a type b heme (iron-protoporphyrin IX ring), which is directly coordinated to the protein by the proximal histidine side chain (His93 in Mb). The second axial ligand is either exogenous water in the ferric state or O2 when the iron is reduced, and both of these ligands are indirectly attached to the protein by hydrogen bonding to the distal histidine (His64 in Mb) (5). Studies on Mb folding have focused mainly on characterizing the stabilities and structures of initial, intermediate, and final apoglobin states in the absence of heme. Sperm whale apoMb has been shown to lose a significant amount of secondary structure after heme removal, which involves primarily unfolding of the F helix and surrounding EF and FG loops (6–8). Further perturbation induced by the addition of heat or chemical denaturants (acid, urea, or GuHCl) leads to complete loss of secondary and tertiary structure.
The existence of a folding intermediate (I) for apoMb was first proposed by Balestrieri et al. (9) based on previous steady-state fluorescence experiments by Kirby and Steiner (10), and has since been verified by multiple techniques using acid, urea, and guanidine hydrochloride (GuHCl) denaturation (8, 11–16). Studies involving rapid jumps from high denaturant concentrations to dilute conditions have demonstrated the presence of a kinetic intermediate, formed within a few milliseconds, that already possesses structure in helices A, G, and H (17). Depending on experimental conditions, another kinetic intermediate can be generated along folding pathway (18), which has additional structure occurring mostly in helix B (17, 19, 20). The structures of the equilibrium and kinetic intermediates of apoMb appear to be very similar (8, 17), and only recently have small disparities been found, notably in the E helix (19).
In contrast to apoMb, only a few studies have focused on the holoprotein. Most unfolding analyses on intact Mb have been semi-empirical, assuming an apparent 2-state equilibrium and/or kinetic mechanism (21–27). Attempts were made to correlate melting temperatures of holoMb empirically with surface electrostatics and folding motifs seen in the crystal structures (24–26). Only a small number of studies attempted to look experimentally for correlations between apoglobin stability, hemin affinity, and holoprotein stability (12, 22, 28–30). Determining the link between these factors is also key to understanding how to optimize heterologous expression yields of recombinant holoMbs and holoHbs in E. coli for either research or commercial purposes (11, 12, 31–33).
Our initial studies suggested that resistance of holoMb to unfolding appears to be determined primarily by heme affinity and is little affected by apoMb stability (29); however, the analysis was performed using only a simple 2-state model. In addition, we made no attempt to take into account hemichrome species, which are often seen under partially denaturing conditions (34–36). We have now developed and tested a more complete mechanism for holoMb that allows heme binding to all three of the states observed during the unfolding of apoMb (i.e., Kd values for hemin binding to the N, I, and U forms) as detailed in Culbertson and Olson (37). Hemin affinity for fully folded, native (N) apoMb is too high to measure directly and are normally estimated from association (30, 38) and dissociation rate constants (29, 39). The Kd for hemin binding to the apoMb N state (KNH) is 10−13 to 10−14 M at neutral pH (22, 29). Hargrove and Olson (22) and Robinson et al. (40) suggested that hemin can also bind to the completely unfolded states of apoMb and apocytochrome b562, although very weakly with KUH values of ~10−6 M. However, neither set of authors attempted to measure and characterize heme binding to apoglobin intermediates.
By using a set of five carefully chosen sperm whale metMb variants (i.e., WT, H64F, T67P, V68T and H97D, Fig. 1), we have been able to demonstrate and characterize heme binding to the apoMb unfolding intermediate. The mutations were selected to stabilize the N apoMb state but weaken hemin affinity (H64F), to selectively destabilize the N state without affecting hemin affinity or the stability of the I state (T67P), to destabilize the N state but enhance hemin affinity (V68T), and to decrease hemin affinity without affecting the stabilities of the N and I apo states (H97D). Analysis of GuHCl-induced unfolding of these variants requires a 6-state mechanism containing native (N), intermediate (I), and unfolded (U) apoMb states and their hemin bound counterparts, NH (holo-metMb), IH, and UH. In all of these variants, the apoMb intermediate (I) forms a hemichrome or IH state with a Kd or KIH for hemin binding on the order of ~10−11 M. This 6-state mechanism applies to all monomeric proteins containing non-covalently bound heme with an intermediate regardless of the exact nature of the cofactor bound intermediate, provides a framework for quantifying the factors that contribute to the overall stability of the holoprotein, and allows independent and accurate determination of equilibrium constants for hemin binding to native and intermediate apoprotein states.
Figure 1.

Cartoon representation of sperm whale Mb with residues of interest indicated in sticks: His64 (red), Thr67 (green), Val68 (purple), His97 (cyan), His93 (navy blue), Trp7 and Trp14 (yellow). The other His residues are indicated in black sticks. The A-H helices are labeled in white. Heme is represented in brown sticks. The figure was created using PyMol and PDB structure 1JP6.
MATERIALS AND METHODS
Preparation of proteins
Wild-type sperm whale myoglobin was prepared according to Springer and Sligar (41) as modified by Carver et al. (42). The H64F and V68T mutant genes were constructed using the cassette mutagenesis system developed by Barry A. Springer and Karen Egeberg at the University of Illinois (43). The T67P and H97D mutants were reconstructed at Rice University for this work using oligonucleotide–directed mutagenesis with a pET29 vector containing the gene for WT Mb to increase yields. All variants were expressed and purified at Rice University following the procedures used for WT Mb, except for the T67P and H97D mutants, which were expressed in E. coli BL21-DE3 (Stratagene) and grown at 30 °C for 16–20 hrs post lag phase in Luria-Bertani media with 50 μg/mL kanamycin (Sigma). If needed, the protein was purified further using a Superdex-200 gel filtration column (Amersham Biosciences) attached to an FPLC (Amersham Bio AKTA), and the purity was ≥ 95% as assessed by SDS-PAGE gels and Soret/280 absorbance ratios. The holoMb concentrations were determined spectroscopically using ε409= 157 mM−1 cm−1 for the aquomet forms of WT, T67P, V68T, and H97D Mb (1) and with ε393= 93 mM−1 cm−1 for the ferric pentacoordinate H64F variant (based upon the CO-bound form at 424 nm using ε424= 187 mM−1 cm−1 for all the MbCO samples (1). ApoMb was prepared using a methyl-ethyl ketone extraction method at low pH (39, 44). The resultant apo-protein was then filtered to remove any precipitated protein and used immediately. The concentrations of apoMb variants were determined spectroscopically using ε280= 15.2 mM−1 cm−1 (45).
Sample preparation and spectroscopic measurements
The samples were prepared using 8 M stock guanidine hydrochloride (GuHCl) (Sigma), appropriate amounts of potassium phosphate buffer (Fisher Scientific) to bring the concentration to 10 mM at pH 7, purified milliQ water and concentrated protein. The mixtures were left to equilibrate for 2 hours at 20 °C. Spectroscopic measurements were performed on a Jasco 610 for CD, a Varian Cary Eclipse for fluorescence emission, and a Varian Cary 50 for UV/Visible absorbance spectra. Each sample chamber was equipped with a Peltier temperature regulator. A reference hemichrome spectrum was generated by adding high concentrations of imidazole to the ferric myoglobins using a pH-adjusted 1 M stock solution from the powder form (Sigma). To examine the reversibility of hemichrome formation, metMb samples containing hemichrome intermediates were rapidly reduced anaerobically by addition of sodium dithionite (Fluka).
Fitting of apoMb equilibrium-unfolding data
Equilibrium-unfolding of the apoMb variants was followed by both Far-UV CD and intrinsic fluorescence measurements, and analyzed in terms of the 3-state mechanism represented in Figure 2. The amount of helical content was analyzed by measuring ellipticity at 222 nm. Changes in the environment of the Trp side chains were followed by measuring fluorescence emission at 341 nm, which gives rise to a bell-shaped curve with an increase in fluorescence for the intermediate I state and a decrease for the completely unfolded or U state (see Fig. 2; 12, 15, 16). This rise and fall in fluorescence intensity allows better definition of the 3-state unfolding parameters. The origin of the hyperfluorescence from the intermediate state still remains unclear. Fluorescence of WT apoMb has been suggested to reflect emission from Trp7 centered at 333 nm, which is quenched by Lys79 in the folded state but not in the intermediate, and emission centered at 321 nm from Trp14, which is buried in the apolar region between the A, G, and H helices in both the N and I states and only quenched after unfolding (10, 12, 46–48). Alternatively, the hyperfluorescence of the intermediate could be caused by enhanced flexibility of the fluorophores in the intermediate state (49).
Figure 2.

GuHCl-induced equilibrium-unfolding of apoMb variants. The unfolding curves obtained by normalizing the changes in Far-UV CD at 222 nm to 1.0 for native WT apoMb and assuming that the U states of all five variants have the same CD222nm (left panel) and by normalizing fluorescence emission intensities at 341 nm to 1.0 for the final, completely unfolded state of each mutant (right panel). Global fits to a 3-state mechanism are shown for WT (black), H64F (red), T67P (green), V68T (purple) and H97D (cyan). Conditions: 10 μM protein, 10 mM potassium phosphate buffer pH 7, 20 °C. The 3-state unfolding mechanism is depicted on the right side, with the structures of N, I, and U states. The structures were created using PyMol and the PDB: 1JP6 for WT holo-metMb, taking into account the secondary structure present in the N state (6–8) and in the I state (8, 17). The thick ribbons indicate intact helical secondary structure and the thin lines represent unfolded structures. The U state is considered completely unfolded.
The equilibrium-unfolding curves from Far-UV CD and fluorescence data for apoMb variants were fit to a 2-step/3-state mechanism, allowing the KNI0 and KIU0 equilibrium stability constants for the N-to-I and I-to-U transitions, respectively, to vary. The linear dependences of the corresponding free energies for the N-to-I and I-to-U transitions on GuHCl concentrations are defined by mNI and mIU values.
| (1) |
| (2) |
The observed signal at a given [GuHCl] is the weighted sum of the observable signals, SN, SI and SU, for each state (11, 12, 14, 16), which is expressed as:
| (3) |
The mNI and mIU values for the N-to-I and I-to-U transitions were fixed to 2.35 and 1.36 kcal mol−1 M−1, respectively (11, 16), assuming that the single point mutations do not significantly affect the change in hydrophobic exposure between the N, I, and U states. Therefore, only the unfolding parameters, KNI0 and KIU0, were allowed to modulate the N-to-I, and I-to-U transitions of the apo-variants. The signal intensities of the N, I, and U states were either fit for each variant or fixed to WT values when poorly defined, i.e., for T67P and V68T apoMb where the N state is not completely populated after heme removal.
Fitting of holoMb equilibrium-unfolding data
The equilibrium-unfolding curves for the ferric holoMb variants were also obtained at single wavelengths and analyzed in terms of the 6-state mechanism, which is shown in Scheme 1. The amount of helical content was analyzed using ellipticity at 222 nm. For fluorescence detection, large emission increases were observed at 355 nm and reflect the loss of hemin, which, when bound, quenches all Trp fluorescence. For absorbance detection, the unfolding data were analyzed at the Soret wavelength maximum of the ferric state for each variant: 409 nm for WT, T67P, V68T and H97D, and 393 nm for H64F metMb.
Scheme 1.
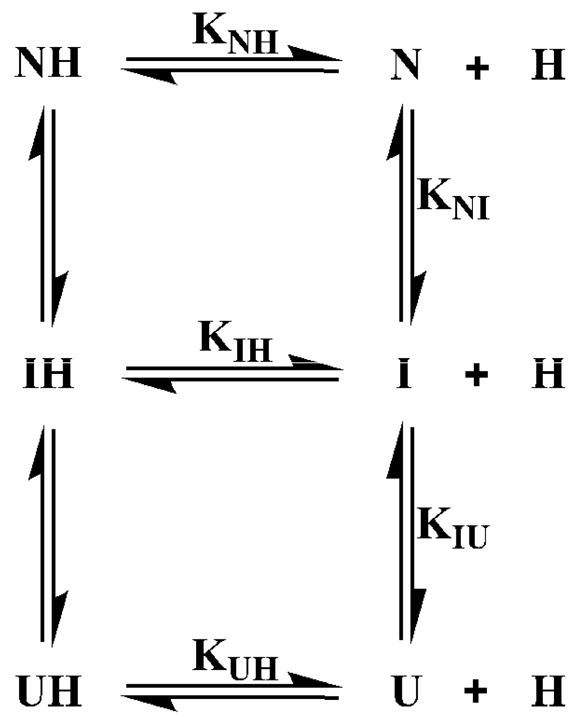
Six-state model for the unfolding of holoMb based upon the 3-state unfolding mechanism of apoMb and the assumption that heme can bind to all three apoMb states.
The 6-state unfolding model was applied to the holoMb unfolding curves. In this equilibrium model, the KNI0 and KIU0 stability constants and mNI and mIU values for the N-to-I, and I-to-U transitions of apoMb were determined independently in separate experiments with the apo-forms and not allowed to vary. The heme dissociation constants from all possible heme-bound states, NH (metMb), IH, and UH were allowed to vary in order to define the equilibrium unfolding curves for holoMb. The three hemin dissociation constants are defined as:
| (4) |
| (5) |
| (6) |
The dependences on GuHCl concentrations are represented by mNH, mIH, and mUH. To our knowledge, m-values for hemin dissociation from globins have never been reported, and our determination of these parameters is discussed in RESULTS.
The population fractions of each species were computed by first obtaining the free concentration of heme [H] by obtaining the following root of a complex quadratic equation:
| (7) |
The fraction of each species was calculated using the free heme concentration [H], the two apoMb stability constants, and the three heme equilibrium dissociation constants:
| (8) |
| (9) |
| (10) |
| (11) |
| (12) |
| (13) |
The fraction of free hemin (YH) is given by the sum of the fractions of apoglobin states (YN+YI+YU). Each of the stability and affinity constants depicted in Equations 8–13 were computed at different [GuHCl] using the m-values: mNI, mIU, mNH, mIH and mUH as defined in Equations 1, 2, and 4–6 to determine the fractions of each species as a function of [GuHCl].
The Soret absorbance, CD, and fluorescence signals were computed from:
| (14) |
The fitted signal parameters (SN through SUH) for the UV-visible absorbance, CD, and fluorescence of the various unfolding states of the Mb variants are given in Supplementary Material for each of the fits shown in Figures 2 and 3, along with detailed interpretations of the differences between the states and mutants. Roughly, the normalized CD222nm signal for all of the NH states was 1.0; the SN(CD) values ranged from 0.7 (H64F) to 0.4 (T67P); SI(CD) and SIH(CD) were both 0.17 to 0.55; and SU(CD) and SUH(CD) were defined as ~0.0 for all the proteins. The Soret absorbance change signal for holo-metMb in the NH state, SNH(Abs), was defined as 1.0 for all the variants; the SIH(Abs) signal was allowed to vary; the SUH(Abs) signal was set to be small; and the S(Abs) values for the apoprotein species were defined as 0.0. The fluorescence change signals were defined based on a normalized value of SU(F) = 1.0 for the unfolded apoMb state. SNH(F) was assigned an initial value of 0.0; SN(F), SI(F) were calculated using the apoMb results, and SIH(F) was allowed to vary. In the holoMb experiments, fluorescence was measured at 355 nm, and as result, the signal coefficients for the N and I states obtained for the apoMb unfolding experiments do not apply directly to the holoMb experiments (see Supplementary Material).
Figure 3.

GuHCl-induced equilibrium unfolding of holoMb variants. The left panels represent the unfolding data from Far-UV CD at 222 nm (blue), fluorescence emission at 355 nm (red), and Soret absorbance (green), with the best fit to the 6-state unfolding model. The right panels depict the population fractions of each species with regards to [GuHCl]. The conditions were: 10 μM protein, 10 mM potassium phosphate pH 7, 20 °C.
In general, holoMb unfolding should depend on total protein concentration because it involves dissociation of heme, which should be facilitated at low concentrations. Hargrove and Olson (22) examined the dependence of holoMb unfolding on total protein concentration and observed very little change in the unfolding curves over the range of 6 to 160 μM. They attributed this lack of dependence to non-specific hemin binding to unfolded Mb. We have verified their calculations, and also examined theoretically the effect of hemin dimerization following dissociation from the protein (37). The addition of a free hemin dimerization step after unfolding greatly complicates the analysis, leading to a cubic equation for the concentration of free monomeric hemin. We are examining this problem experimentally, which requires measuring holoMb unfolding curves over a very wide range of total protein concentrations (1 to 100 μM) and determining independently the dependence of hemin dimerization on [GuHCl]. Our current results indicate that the only significant effects of including the hemin dimerization step are 2- to 4-fold decreases in the fitted hemin dissociation constants for the N and I states. The basic conclusions shown in Tables 1 and 2 and Figures 3–5 remain unchanged when comparing the Mb variants, and the structural interpretation of the IH intermediate is unaffected. Thus, for this paper we neglected the added complexities of hemin dimerization and variation of protein concentration.
Table 1.
Stability parameters for the apoMb variants1
| ApoMb Variant | KNI0 | KIU0 | 1/KNU0 |
|---|---|---|---|
| WT | 0.021 | 0.019 | 2500 |
| H64F | 0.0061 | 0.011 | 15000 |
| T67P | 0.67 | 0.029 | 51 |
| V68T | 0.13 | 0.017 | 450 |
| H97D | 0.013 | 0.061 | 1300 |
The GuHCl-induced unfolding measurements were carried out in 10 mM potassium phosphate pH 7, 20 °C. The KNI0 and KIU0 were obtained by fitting simultaneously both CD and Fluorescence signals for the unfolding of the apoMb variants to the 3-state unfolding mechanism using Equation 3 (see Supplementary Material, Table S1). The values of mNI and mIU were set to 2.35 and 1.36 kcal mol−1 M−1, respectively.
Table 2.
Hemin dissociation constants and m-values for the NH and IH states of holo-metMb variants1.
| HoloMb Variant | KNH0 (M) | mNH kcal mol−1 M−1 | KIH0 (M) | mIH kcal mol−1 M−1 | K-H pH 7–82 (M) | K-H pH 52 (M) |
|---|---|---|---|---|---|---|
| WT | 0.88 × 10⁻¹³ | 4.4 | 1.4 × 10⁻¹¹ | 4.0 | 0.28 × 10⁻¹³ | 28 × 10−13 |
| H64F | 4.1 × 10⁻¹³ | 3.5 | 1.0 × 10⁻¹¹ | 3.3 | 2.2 × 10⁻¹³ | 130 × 10−13 |
| T67P | 1.0 × 10⁻¹³ | 4.3 | 3.6 × 10⁻¹¹ | 2.8 | n.d. | n.d. |
| V68T | 0.016 × 10⁻¹³ | 4.1 | 1.5 × 10⁻¹¹ | 3.2 | ≤0.05 × 10⁻¹³ | 1.1 × 10⁻¹³ |
| H97D | 84 × 10−13 | 3.4 | 8.8 × 10⁻¹¹ | 2.4 | 180 × 10−13 | 1100 × 10−13 |
The unfolding measurements were carried out in 0.01 M potassium phosphate pH 7, 20 °C. KUH0 and mUH were fixed to 1.0 × 10⁻⁶ M and 2.4 kcal mol−1 M−1, respectively, for all five variants as described in DISCUSSION. The CD, fluorescence, and Soret absorbance signal parameters are given in Table S2 of the Supplementary Material.
The values for K-H were computed from the hemin dissociation rate constants assuming that the association rate constant is 1.0 × 10⁸ M−1 s−1 for all five variants, as described in Hargrove et al. (30). The dissociation rate constants were taken from data at pH 7 and pH 5 at 37 °C in 0.45 M sucrose and 0.15 M sodium phosphate or acetate, respectively (22, 29). Unfortunately, the dissociation rate constant for H64F at pH 7 reported in Hargrove et al. (29) is a misprint (i.e., the real value is 0.1 h−1 and not 0.01 h−1). We used the value of 0.08 h−1, which was measured in Hargrove et al. (39). n.d., not determined.
Figure 5.
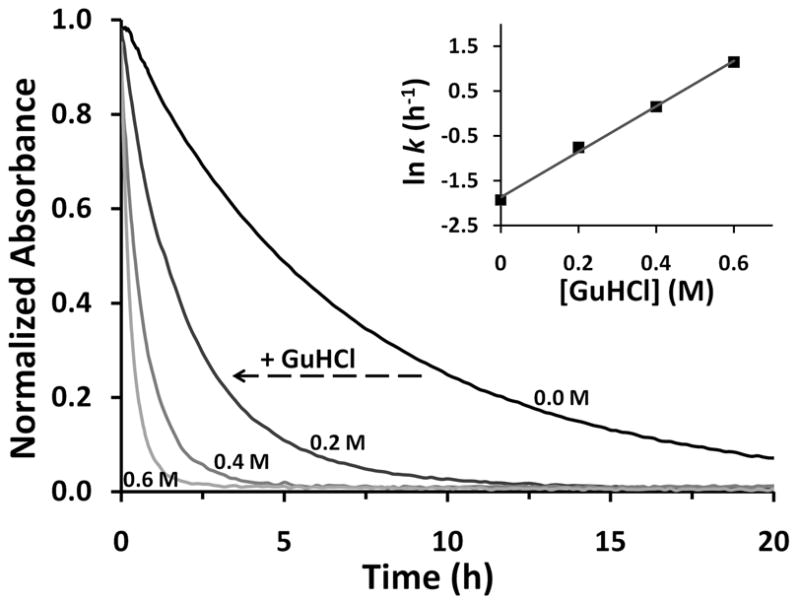
Kinetic traces for hemin loss from H97D aquomet Mb as a function of [GuHCl]. The four traces represent normalized absorbance change time courses at 409 nm as a function of GuHCl concentration, which is listed beside each curve. In these experiments, 4 μM H97D aquometMb was mixed with 40 μM H64Y/V68F apoMb, which acts as a hemin scavenging agent (38), in 10 mM potassium phosphate at pH 7, 20 °C. INSET: The observed hemin dissociation rate constants were obtained from fits to a single exponential process for each trace. A plot of the natural logarithm of these rates versus [GuHCl] is shown in the inset.
RESULTS
Equilibrium-unfolding of apoMb variants
The GuHCl-induced unfolding of each apo-variant was monitored by Far-UV circular dichroism (CD) and tryptophan fluorescence emission. Overlays of both measurements for all variants are shown in Figure 2. In most cases, the CD data reveal an inflection point in the unfolding curves indicative of a populated intermediate; however, the CD data alone are not sufficient to define accurately the stability parameters for the N-to-I, and I-to-U transitions. The fluorescence unfolding curves demonstrate unequivocally the presence of an intermediate, which is characterized by hyperfluorescence centered at a wavelength in between the fluorescence peaks for the native N and unfolded U states, as was observed previously (12, 15, 16). We have assumed that the signals from both CD and fluorescence emission report on the same intermediate, and, as described by Hargrove et al. (12), Scott et al. (16) and Smith (11), the unfolding data were fit simultaneously to a 3-state N-to-I-to-U equilibrium-unfolding mechanism analogous to the one originally developed by Barrick, Baldwin, and colleagues (50–53). For each mutant and WT apoMb, we successfully obtained fitted KNI0 and KIU0 stability constants for the N-to-I, and I-to-U transitions in the absence of denaturant, and the values are listed along with free energy parameters in Table 1.
As expected, the unfolding data for the five apoMb variants were readily interpreted in terms of a 3-state model. The shape of the unfolding curve is directly influenced by the population fraction and respective signals for each of the 3 states, as depicted in Equation 3. The populations of each state are markedly dependent on the stability constants KNI0 and KIU0, which vary between the mutants, whereas the m-values for the two transitions are relatively invariant and were kept constant. The respective signals for the folded (N) and intermediate (I) states of each apoprotein vary due to the structural changes induced by the point mutation. These effects are most noticeable for the hyperfluorescence intensity of the molten globule intermediate in H64F, which is significantly less intense than the one in H97D. This decrease in intermediate fluorescence for H64F could reflect a more compact molten globule due to its increased core hydrophobicity and stability. The CD unfolding curves also reveal a disparity between the higher helical content of the N and I states of H64F when compared to lower helical content of for the same T67P states (see Supplementary Material, Table S1).
The variants show a wide range of stabilities for the N states, with the H64F mutant being the most stable and the T67P variant being the least stable. As expected, KIU0 is much less affected by these distal pocket mutations than KNI0, supporting the view that the heme pocket is melted in the molten globule intermediate I state. The H64F substitution increases the hydrophobicity of the heme pocket, inhibiting its unfolding and decreasing KNI0 3-fold (Table 1). The H97D variant displays stabilities for the N and I states that are similar to those of WT apoMb because the imidazole side-chain of residue 97 is solvent exposed. The V68T substitution increases the polarity of the heme pocket by inserting an additional polar side chain adjacent to the ligand binding site, and causes a marked decrease in the stability of the N state, which is reflected by the 6-fold increase in KNI0 (12). Finally, the T67P variant introduces a “kink” in the E helix lowering its stability and that of the entire heme pocket in the N state, resulting in a dramatic 30-fold increase in KNI0.
Unfolding of WT holoMb
The general scheme for the unfolding of a monomeric heme protein is shown in Scheme 1, and allows heme, H, to bind to all three apoprotein states: N, I, and U. The unfolding equations derived from this mechanism are given in METHODS. In our analysis, the parameters for the unfolding of the apoprotein species were fixed based on independent analysis of the apoglobin data shown in Figure 2. We were able to fit simultaneously the absorbance, far-UV CD, and tryptophan fluorescence unfolding curves for holoMb to the general 6-state unfolding model and obtain estimates of the hemin dissociation constants: KNH0, KIH0, and KUH0 (dissociation constants in the absence of denaturant), for the three apoMb states (Table 2).
The agreement between the observed data and the fitted curves is remarkably good (Fig. 3), considering that the key apoMb unfolding parameters were fixed to the values listed in Table 1. The fractions of each state during unfolding are also shown in Figure 3. The complete set of data for all five variants demonstrates unequivocally that unfolding of holoMb is not a one-step process and involves equilibrium populations of IH and I states at moderate denaturant concentrations. However, as observed previously, the curves for WT holoMb by themselves are not definitive with respect to the presence of an IH state.
The dissociation constant KNH0 for WT holoMb was estimated to be ~0.9 × 10⁻¹³ M at pH 7, 20 °C, which is in reasonable agreement with the equilibrium dissociation constant, K-H ~0.3 × 10⁻¹³ M, computed from the ratio of association and dissociation rate constants for WT metMb at pH 7, but at higher salt concentration in 0.45 M sucrose at 37 °C (Table 2, (22, 30)). In addition, we were able to successfully estimate KIH0, which is ~1.4 × 10⁻¹¹ M, indicating that the hemin affinity of the WT I state is ~100 fold weaker than that of the N state. The value of KUH0 is poorly defined but estimated to be ~10−6 M for all five variants, in agreement with previous estimates of heme binding to unfolding apoMb and apocytochrome b562 (see DISCUSSION and (22, 40)).
H64F, a variant with increased apoMb stability but decreased hemin affinity
The unfolding of the H64F mutant is depicted in Figure 3. This mutant was selected because the Phe substitution increases the stability of the N state of the apo-form by replacing the polar imidazole side chain with a relatively apolar aromatic ring which excludes water from the heme pocket (5, 12). However, removal of the distal histidine eliminates the His64 hydrogen bond to the water molecule that is coordinated to the hemin iron atom. As a result, water is no longer bound to the iron atom, and H64F metMb is pentacoordinate, showing a much weaker Soret band at 393 nm instead of the strong 409 nm band seen for the aquomet form of WT metMb. In addition, the affinity of the N state of H64F apoMb for hemin is ~4-fold smaller than that of WT apoMb. In terms of dissociation equilibrium constants, KNH(H64F) is ~4 × 10⁻¹³ M compared to KNH(WT) is ~0.9 × 10⁻¹³ M.
As is observed for WT holoMb, the unfolding curves for H64F holoMb do not have obvious inflection points; however, the unfolding curves are clearly broadened and the transition midpoints occur at a slightly higher [GuHCl] than those for WT holoMb. Fitting to the 6-state model suggests the presence of a significant population the IH state during unfolding, which causes broadening of the overall unfolding transition. Fitting to a 2-state model would require a significant decrease in the overall unfolding m-value, which is unlikely to be caused by a single point mutation. The lower value of KNH0 for H64F metMb is in agreement with the smaller value estimated from the ratio of the dissociation and association rate constants for hemin binding to this mutant (Table 2, (29)). The equilibrium constant for hemin dissociation from the mutant IH state, KIH0, is estimated to be 1.0 × 10⁻¹¹ M, which is similar to that for the WT Mb intermediate (Table 2).
The presence of an IH state during unfolding of H64F holoMb is suggested by a red-shift of the Soret band to 410 nm at a GuHCl concentration favoring ~50% net unfolding. We deconvoluted the UV-visible absorbance spectra of H64F holoMb/GuHCl mixtures near the unfolding midpoint to obtain the absolute spectrum of the IH state. The result is shown in Figure 4B. Interestingly, the deconvoluted IH spectrum is characteristic of a hemichrome species with a Soret maximum at 415 nm, a major low spin β band at 535 nm, and an α band shoulder at 565 nm (35). Thus, we propose that the IH state in Mb is a hemichrome. Unfolding of the heme pocket of the holoprotein appears to allow formation of a bis-histidyl linkage to the heme iron even in the absence of a distal histidine. Thus, the hemichrome-like IH state may involve bis-His coordination by alternative sets of two histidines in the heme pocket region, and not just His64 and His93 (Fig. 1). Alternatively, the bis-axial coordination could arise from a Met/His pair, and there is one Met side chain in the heme pocket region, Met55(D5).
Figure 4.

Panels A and B, Absorbance spectra for T67P, H64F in the native folded NH, IH, and U + H states. All absorbance values were normalized to the peak absorbance of WT metMb at 409 nm at 10 μM total heme, which was the concentration used for all the samples. The normalized scale for the visible region, 450 to 700 nm, is 0 to 0.15. Deconvoluted spectra, for the IH states were computed assuming the starting NH and final U+H states shown in the panels and then subtracting weighted sums of these spectra from the spectra measured at the midpoint GuHCl concentration where the fraction of IH state is the largest. The fractions of NH, IH, and free H at the intermediate GuHCl concentration were estimated from the fitted parameters in Table 2 and Equations 8–13. Panel C, Overlay of the deconvoluted spectra of the IH states for T67P, H64F, and H97D Mb obtained from the GuHCl titrations and the spectrum of imidazole bound to H97D metMb (at 100 mM free imidazole). Panel D, spectra for H97D holo-metMb in the absence (solid line) and presence (dashed line) of 1.4 M GuHCl, before reduction (black) and after addition of sodium dithionite (grey). The buffer conditions were 10 mM potassium phosphate pH 7, 20 °C.
T67P: a variant with wild-type hemin affinity but an unstable N state
The unfolding of the holo T67P mutant is depicted in Figure 3. This mutant was selected as a variant with a highly destabilized apoglobin N state (Table 1, largest KNI0 value) due to insertion of proline in the middle of the E helix (Fig. 1). However, the affinity of the apoprotein N state for hemin is similar to that of WT Mb. The unfolding curves of T67P holoMb all show well-defined inflection points, which demonstrate unambiguously the presence of an intermediate species. These data were readily fit to the 6-state model, and the major intermediate species is the IH state, which dominates at ~1.4 M GuHCl. The IH state for this mutant is favored because of the instability of the apoMb N state, which facilitates partial unfolding even with the hemin-cofactor bound. Analysis of the UV-visible absorbance spectra during unfolding reveals directly that the IH state is a hemichrome-like species, which is characterized by distinct absorbance bands at 415, 535, and 565 nm (35). For this mutant, the hemichrome spectrum can be observed almost by itself at the midpoint [GuHCl] value because the fraction of IH is ~ 0.90 (Fig. 3). The deconvoluted spectrum of the IH state for T67P metMb is shown in Figures 4A and 4C.
The fitted parameters for T67P metMb unfolding are listed in Tables 1 and 2. As expected, this mutation does not affect heme affinities, and the computed hemin dissociation constants remain similar to those for WT metMb with KNH0 ~1.0 × 10⁻¹³ M and KIH0 ~3.6 × 10⁻¹¹ M (Table 2). Only the apoMb N-to-I unfolding parameters are affected by the T67P substitution (Table 1). However, the large increase in KNI0 causes a marked effect on the holoMb unfolding curves and a dramatic increase in the population of the IH state, allowing its spectral properties to be characterized and assigned unambiguously to a hemichrome species.
V68T: a variant with increased heme affinity but decreased stability of the N state
The V68T mutant was selected as a variant with an unstable N apoMb state (i.e, increased KNI0) but a markedly increased affinity for heme (22). The Thr68 hydroxyl group forms an additional strong hydrogen-bond with coordinated water, which stabilizes bound hemin, reduces its rate of dissociation, and decreases KNH0 markedly (22).
As is observed for WT metMb, the unfolding curves for V68T holoMb appear highly cooperative and indicative of a 2-state mechanism, but the holoprotein unfolding transition is shifted toward a higher [GuHCl], i.e., ~2.0 M (Fig. 3). Fitting of these data to the 6-state unfolding model reveals that the increase in transition midpoint is caused by an ~50 fold increase in heme affinity of the N state (KNH0 decreases from ~0.9 to ~0.02 × 10⁻¹³ M) even though the stability of the N apoprotein state is decreased ~5 fold (KNI0 increases from 0.02 to 0.13, Table 1). The fits do suggest the presence of an IH state during unfolding, but it is present at ≤ 40% at the unfolding midpoint. We were able to deconvolute a hemichrome spectrum at this denaturant concentration, but the noise was considerable due to the smaller population of IH and larger amounts of NH and U+H states. As is the case for the other mutants, the fitted parameters suggest that the affinity of the I state for hemin is similar to that for the WT intermediate with KIH0 ~1.7 × 10⁻¹¹ M (Table 2).
H97D Mb: a variant with markedly decreased heme affinity but wild-type apoMb stability
The H97D mutant has a ~100-fold decreased affinity for hemin while retaining N and I apo-state stabilities similar to those for WT Mb. The H97D substitution disrupts favorable electrostatic interactions between the His97 side chain, the Ser92 hydroxyl group on the F-helix, and the heme-7-propionate (54). This disruption markedly increases the rate of hemin dissociation and the equilibrium dissociation constant (KNH0) but has little or no effect on the unfolding of apoMb (Fig. 2, Table 1 and (22)).
The unfolding curves for H97D metMb (Fig. 3) all show inflection points, demonstrating unambiguously the presence of an intermediate, and the fitted parameters show that that the biphasic nature of the curves is caused by population of the IH state, which reaches a maximum of ~80% at ~1.5 M GuHCl. As is the case for the T67P mutant, the absorbance spectrum of H97D metMb at ~1.5 M GuHCl indicates a hemichrome species (Fig. 4D). The deconvoluted spectrum for the IH state of H97D Mb is shown in Figure 4C, and is identical to that of the IH species for T67P and H64F Mb.
The fitted parameters for H97D holoMb show that the N state has an ~100-fold lower affinity for hemin, with KNH0 at 84 × 10−13 M, which is similar to that estimated previously from association and dissociation, rate constants for hemin binding to this mutant (Table 2, (22)). The affinity of the I state of H97D Mb for hemin is also lower, with KIH0 increasing from ~1.4 to ~8.8 × 10⁻¹¹ M. This ~6-fold decrease in affinity suggests that the unfavorable electrostatic interactions caused by the H97D mutation at the FG corner also weaken the affinity of the I state for hemin even though the heme pocket is unfolded.
The IH state is a hemichrome
All the Mb variants appear to populate an IH state during unfolding of the holoprotein, but the extent varies greatly from ≤ 20% for WT holoMb to ~80 and ~90% for the H97D and T67P mutants, respectively. The deconvoluted absolute spectra of the IH state for the T67P (Fig. 4A) and H64F (Fig. 4B) variants are shown and compared to the starting metMb spectra and the final U state with free hemin. The deconvoluted IH spectra of the three variants showing the highest population of IH states are overlaid in Figure 4C and compared to that for H97D metMb titrated with excess imidazole (100 mM, pH 7) to create a bis-imidazole hemichrome in the NH state. All four spectra are super-imposable and display the low spin peak at 535 nm, the 565 nm shoulder, and the red-shifted Soret band at 415 nm, characteristic of a bis-histidyl or a methionyl-histidyl hemichrome.
Surprisingly, the IH species appears to exhibit ~40% of the fluorescence of the completely unfolded U state even though hemin is still bound. This property is clear for T67P Mb (Fig. 3). At 1.4 M GuHCl, IH is the dominant species with a clear hemichrome UV-visible spectrum, roughly the same CD signal as the I state of T67P apoMb (~30% of completely folded holoMb), and roughly 40% of the fluorescence of the U state of apoMb. Because, hemin is still bound, we expected that the Trp fluorescence would remain almost completely quenched, but it is not. This result suggests that the angle for fluorescence resonance energy transfer is much less favorable than in the native state, expansion of the heme pocket size has moved the porphyrin ring further away from the two Trp side chains positioned along the A helix, and/or the enhanced mobility of the Trp residues in this molten globule state reduces both solvent quenching and resonance energy transfer.
The hemichromes involved in Hb and Mb degradation have often been associated with irreversibility (35). However, the GuHCl-induced unfolding curves for holo-metMb are reversible and independent of how the mixtures are made. We carried out kinetic experiments in which holoMb at high [GuHCl] was rapidly diluted into buffer and vice versa. The same equilibrium state was obtained in each case. For example, upon dilution into buffer, the hemichrome IH state of H97D induced by 1.4 M GuHCl refolds, within the dead time of our stopped-flow apparatus, into the native metMb form with a “normal” Soret maximum at 409 nm and visible absorbance bands at 505 and 630 nm indicative of high-spin aquohemin.
We also tested whether or not the IH hemichrome in H97D could refold into a native-like pentacoordinate deoxyMb state after rapid reduction. As shown in Figure 4D, when H97D metMb in 1.4 M GuHCl is reduced anaerobically with a slight excess of sodium dithionite, a “normal,” pentacoordinate deoxyMb species was formed immediately and showed a broad Soret maximum at 434 nm and a single visible absorbance band centered at 558 nm. No evidence of a hemochrome (bis-imidazole complex with heme iron in the reduced state) spectrum was observed under these conditions at 1.4 M GuHCl, which Hargrove and Olson (1996c) showed is too small to induce any denaturation of WT or H97D deoxyMb. Wittung-Stafshede et al. (55) carried out a similar experiment with native metMb denatured with 2.5 M GuHCl. In their experiment, reduction was induced by photo-excitation of NADH with a nanosecond Nd:YAG laser. Almost completely denatured metMb folded into pentacoordinate, native-like deoxyMb within 2–3 milliseconds (τ ≈ 0.3 ms) after photo-reduction. Thus, the hemichrome IH intermediate appears to be fully reversible and able to fold back rapidly into highly stable ferric or reduced NH states.
m-values for hemin dissociation constants
In our analysis, we have assumed that all three hemin dissociation constants are increased in presence of [GuHCl] and that there is a linear free energy relationship between ΔG° for hemin dissociation and GuHCl concentration, as expressed by Equations 4–6. If KNH were independent of [GuHCl], and the denaturant only affected the apoMb unfolding constants as shown in Figure 2, then the computed [GuHCl]1/2 would be ~3.5 M for WT holoMb, which is markedly greater than the observed value of ~1.8 M (Fig. 3). Thus, it is clear that GuHCl induces hemin dissociation, and the fitted mNH, mIH, mUH values help define the steepness and transition midpoint of the holoMb unfolding curves. The absolute values of mNH and mIH are unexpectedly larger than those for the N-to-I, and I-to-U transitions of apoMb, 4.4–2.4 kcal mol−1 M−1 for hemin dissociation versus 2.3–1.4 kcal mol−1 M−1 for apoglobin unfolding.
To verify the strong dependence of KNH on [GuHCl], we measured the rate of hemin loss from H97D metMb as a function of GuHCl concentration in the range from 0.0 to 0.6 M, and the results are shown in Figure 5. These experiments were carried out under the conditions used for equilibrium unfolding (10 mM phosphate pH 7, 20 °C) and in the absence of sucrose, which is normally added as a stabilizing agent to inhibit precipitation of the resulting apoglobin (39). As result, the observed rate of hemin dissociation from H97D metMb is much slower than that reported previously for this mutant in high salt and sucrose at 37 °C (29). As predicted from the results in Table 2, the rate of hemin dissociation depends strongly on [GuHCl], even at these low concentrations where little or no net equilibrium unfolding occurs (see 0 to 0.6 M [GuHCl] regions in Fig. 3). The observed rate of hemin loss from H97D metMb increases from ~0.15 h−1 at 0 M to ~4 h−1 at 0.6 M GuHCl. A plot of lnk-hemin versus [GuHCl] is linear with an apparent m-value for the kinetic free energy barrier to hemin dissociation of ~3.0 kcal mol−1 M−1. This value is large and on the order of those obtained for equilibrium hemin dissociation from the NH and IH states of this mutant (i.e., mNH ~4 and mIH ~3 kcal mol−1 M−1, Table 2). The agreement between the kinetic and equilibrium m-values for hemin dissociation appears reasonable considering the difference in type of free energy measurement, i.e., equilibrium ΔG° versus kinetic ΔG‡ determinations.
DISCUSSION
Relevance of apoMb unfolding to the assembly and denaturation of the holoprotein
The unfolding of apoMb has been studied in great detail over the past 20 years. The 3-state mechanism is well-established; and the structural nature of the molten globule intermediate or I state has been characterized by both mutagenesis and NMR approaches (14, 17, 19, 56). However the relevance and applicability of these results to understanding both the assembly and denaturation of holoMb had not been established and was the goal of this work. The key problem is that chemical or thermal unfolding of WT holoMb is a highly concerted process, which superficially resembles a 2-state process because of the high affinity of the N apoMb state for hemin (Fig. 3, top panels). In this case, the concentration of denaturant required to dissociate hemin from the N state is higher than that required to unfold the initial apoprotein N state and the partially unfolded molten globule I state. To resolve the role of the apoglobin intermediate in holoprotein unfolding and assembly, we expanded our previous work (22) to include a combined analysis of the unfolding of WT and four holoMb mutants. The mutations were designed to vary the stability of the apoMb N state and its affinity for heme in order to visualize heme binding to the apoglobin folding intermediate. As shown in Figure 3, this mutagenesis approach was successful. Our underlying assumption is that the same basic 6-state mechanism applies to all five variants and that the mutations only affect the hemin dissociation and apoglobin unfolding parameters. The success of the fits and correlations of the parameter changes with expected structural effects imply that this assumption is a good approximation. Thus, one key conclusion is that the well-established mechanism for apoMb unfolding is directly relevant to holoMb unfolding and assembly, particularly when interpreting the effects of mutagenesis on overall stability and the appearance of intermediates.
These results are also relevant to holoprotein assembly in vivo. Graves et al. (31) and others (11, 12, 16) have suggested that expression levels of hologlobins in bacteria are proportional to the stabilities of the corresponding apoproteins because heme insertion is often limiting when high copy number plasmids are used and maximal transcription is induced. Under these conditions, the rate of holoprotein production is determined by the rate of heme synthesis or transport times the fraction of apoglobin that is folded and competent to bind heme (31). One key question in this interpretation is whether heme can bind to the molten globule apoglobin intermediate and facilitate formation of the holoprotein.
The IH hemichrome and holoMb assembly
Hemichromes have long been associated with irreversible degradation of Hb and formation of Heinz bodies in red cells (35), and presumably similar degradation processes occur for Mb in vitro or in myocytes. Our results in Figures 3 and 4 show that sperm whale Mb unfolds via an IH state, which displays the spectrum of a hemichrome with a bis-histidyl linkage. The observation of a hemichrome spectrum for the H64F variant demonstrates that the distal histidine is not needed to produce the low spin IH complex. Thus, the hemichrome spectrum is probably due a mixture of bis-imidazole or methionyl/histidyl complexes involving any two of the histidines located in the region of the heme pocket, His24(B5), His36(C1), His48(CD6), His64(E7), His81(EF corner), His82(EF corner), His93(F8), and His97(FG corner) or one of these histidines and Met55(D5). The proposed flexibility of the molten I and IH states appears to allow different combinations, although the simplest structural interpretation for most of the variants would be axial ligation by the distal and proximal histidines (His64 and His93) when they are both present.
Reversible hemichrome formation is a general phenomenon and observed during either GuHCl or urea-induced denaturation of both sperm whale and horse heart Mb (not shown). Hemichrome formation is fully reversible, and the IH state reverts to the native metMb form with distal water coordinated to the iron atom upon rapid dilution of GuHCl. Similarly, the IH hemichrome does not form a hemochrome when reacted with dithionite. Instead, the IH state rapidly converts to a native pentacoordinate deoxyMb form upon reduction (Fig. 4D), and previous laser induced reduction experiments suggest that this process occurs in milliseconds (55). Our equilibrium results suggest that hemin can bind with reasonably high affinity to the I state, and promote formation of the native holoprotein. This pathway for assembly is even more probable under micro-aerobic conditions similar to those found in E. coli growing in logarithmic phase and, presumably, in respiring myocytes. Under these conditions, free heme still rapidly autooxidizes, but reduction of the ferric IH state leads to rapid formation of very stable deoxy- or oxy-holoMb states.
Hemin binding to the N, I, and U apoMb states
It was difficult to determine the N and I state hemin dissociation equilibrium constants accurately without fixing the value of the equilibrium constant for hemin dissociation from the unfolded state. KUH0 is poorly defined in our experiments at 10 μM initial holoMb concentration because no significant amount of UH occurs at high [GuHCl] (Fig. 3). Separate gel-filtration chromatography experiments suggest complete hemin dissociation upon unfolding of ~10 μM metMb at [GuHCl] ≥ 3 M (not shown). Spectra of the Mb variants equilibrated in 3 M GuHCl resemble that of free hemin in 3 M GuHCl. We fixed KUH0 at 1.0 × 10⁻⁶ M in our model based on the affinity constants measured for non-specific hemin binding to unfolded apo-cytochrome b562 (40) and native bovine serum albumin (30, 57) and on the estimation that non-specific hemin binding to unfolded apoMb is ~106 to 107-fold weaker than binding to the folded N apo-state (22). Fixing KUH0 to 10−6 M, and KNI0 and KIU0 to the values determined in separate experiments with the apoMb variants, allowed determination of the equilibrium dissociation constants for hemin binding to the N and I apoglobin states.
The results in Tables 1 and 2, and the fits in Figure 3 show that distal pocket mutations affect primarily stability of the N state and its affinity for hemin. The variations in KNI0 and KNH0 (~1,000-fold) are markedly greater than those for KIU0 and KIH0 (~6-fold). These results strongly verify Baldwin’s, Barrick’s, Wright’s, and coworkers’ interpretation (14, 17, 19, 56) that the N-to-I, and NH-to-IH transitions involve unfolding of the heme pocket to generate a molten globule intermediate with intact A, G, and H helices.
Another key result is that the variation in KNH0 values determined by analysis of holoMb unfolding curves correspond well with equilibrium hemin dissociation constants, K-H, calculated from the ratio of association and dissociation rate constants for hemin binding to the same set of Mb mutants (Table 2, last two columns, (22, 29, 30)). As shown in Figure 6, there is a strong, linear correlation between −log(KNH0) obtained independently from unfolding curves and the values of −log(K-H) determined from kinetic experiments at both neutral and low pH. The neutral pH values of K-H are poorly defined because the rates of hemin dissociation from WT metMb and the other higher affinity mutants are very small and difficult to measure. At pH 5, hemin dissociation is more readily measured because of increased protonation of the proximal histidine (His93) which promotes breakage of the Fe-imidazole bond (29). Despite the differences in solvent conditions and temperature, both the absolute values of KNH0 and the effects of mutagenesis correlate remarkably well with the K-H values for WT, H64F, V68T, and H97D, determined kinetically at both pH values (Table 2 and Figure 6). Thus, GuHCl-induced unfolding curves of holo-heme proteins represent an alternative assay to measure accurately the affinities of apoproteins for hemin if the mechanism for unfolding of the apoprotein is known.
Figure 6.
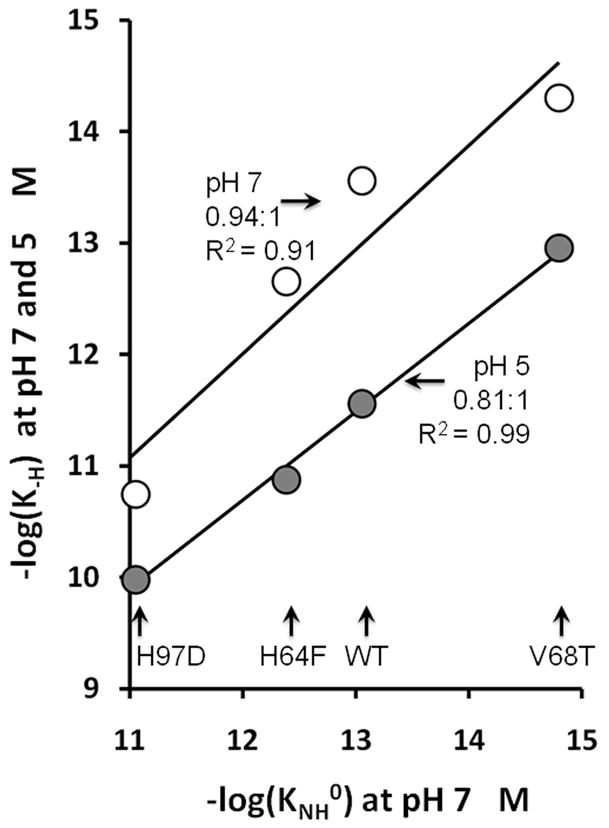
Correlations between the hemin dissociation equilibrium constant, KNH0, obtained from the analysis of the GuHCl unfolding curves shown in Figure 3 with hemin dissociation equilibrium constants, K-H, calculated from the ratio of the association and dissociation rates constants measured independently in kinetic experiments (22, 29, 30). The rate parameters are listed in Table 2. The open circles represent K-H values at pH 7–8 and the closed, gray circles, K-H values at pH 5. The solid lines represent linear fits for −log(KNH0) versus −log(K-H) with the slopes and R2 values listed beside each set of data. The KNH0 values were measured in 0.01 M potassium phosphate, pH 7, 20 °C. Most of the K-H values were obtained from measurements in 0.15 M sodium phosphate, 0.45 M sucrose, pH 7.0 or 0.15 M acetate, 0.45 M sucrose, pH 5 both at 37 °C. The correlations are very strong, despite the differences in conditions.
Supplementary Material
Acknowledgments
We thank Eileen W. Singleton for assistance in expression and purification of the Mb variants.
Abbreviations
- Heme
Fe(II)-protoporphyrin IX or a generic name for both oxidation states of the cofactor
- hemin
Fe(III)-protoporphyrin IX
- Mb
Myoglobin
- metMb
ferric form of Mb
- Hb
Hemoglobin
- GuHCl
guanidine hydrochloride
- WT
wild-type
- sw
sperm whale
- CD
Circular Dichroism
Footnotes
Supported by U.S. Public Health Service Grants GM 35649 (J.S.O.) and HL 47020 (J.S.O.), and Grant C-612 (J.S.O.) from the Robert A. Welch Foundation, Houston, TX. D.S.C. is the recipient of a predoctoral NIH Traineeship from the Atherosclerosis and Vascular Biology Training Grant T32 HL007812-11GM.
Supporting Information Available. The signal parameters for analysis of apoMb unfolding curves using the 3-state mechanism are presented in Table S1. The signal parameters for the fitting of the holoMb variants to the 6-state mechanism are presented in Table S2. This material is available free of charge via the Internet at http://pubs.acs.org.
References
- 1.Antonini E, Brunori M. Hemoglobin and myoglobin in their reactions with ligands. North-Holland Pub. Co; Amsterdam: 1971. [Google Scholar]
- 2.Kendrew JC, Bodo G, Dintzis HM, Parrish RG, Wyckoff H, Phillips DC. A three-dimensional model of the myoglobin molecule obtained by x-ray analysis. Nature. 1958;181:662–666. doi: 10.1038/181662a0. [DOI] [PubMed] [Google Scholar]
- 3.Dintzis HM. Assembly of the peptide chains of hemoglobin. Proc Natl Acad Sci U S A. 1961;47:247–261. doi: 10.1073/pnas.47.3.247. [DOI] [PMC free article] [PubMed] [Google Scholar]
- 4.Rossi-Fanelli A, Antonini E, Caputo A. Hemoglobin and Myoglobin. Advan Protein Chem. 1964;19:73–222. doi: 10.1016/s0065-3233(08)60189-8. [DOI] [PubMed] [Google Scholar]
- 5.Quillin ML, Arduini RM, Olson JS, Phillips GN., Jr High-resolution crystal structures of distal histidine mutants of sperm whale myoglobin. J Mol Biol. 1993;234:140–155. doi: 10.1006/jmbi.1993.1569. [DOI] [PubMed] [Google Scholar]
- 6.Eliezer D, Wright PE. Is apomyoglobin a molten globule? Structural characterization by NMR. J Mol Biol. 1996;263:531–538. doi: 10.1006/jmbi.1996.0596. [DOI] [PubMed] [Google Scholar]
- 7.Cocco MJ, Lecomte JT. Characterization of hydrophobic cores in apomyoglobin: a proton NMR spectroscopy study. Biochemistry. 1990;29:11067–11072. doi: 10.1021/bi00502a008. [DOI] [PubMed] [Google Scholar]
- 8.Hughson FM, Wright PE, Baldwin RL. Structural characterization of a partly folded apomyoglobin intermediate. Science. 1990;249:1544–1548. doi: 10.1126/science.2218495. [DOI] [PubMed] [Google Scholar]
- 9.Balestrieri C, Colonna G, Giovane A, Irace G, Servillo L. Equilibrium evidence of non-single step transition during guanidine unfolding of apomyoglobins. FEBS Lett. 1976;66:60–64. doi: 10.1016/0014-5793(76)80585-6. [DOI] [PubMed] [Google Scholar]
- 10.Kirby EP, Steiner RF. The tryptophan microenvironments in apomyoglobin. J Biol Chem. 1970;245:6300–6306. [PubMed] [Google Scholar]
- 11.Smith L. PhD Thesis. Rice University; Houston, TX: 2003. The effects of amino acid substitution on apomyoglobin stability, folding intermediates, and holoprotein expression. [Google Scholar]
- 12.Hargrove MS, Krzywda S, Wilkinson AJ, Dou Y, Ikeda-Saito M, Olson JS. Stability of myoglobin: a model for the folding of heme proteins. Biochemistry. 1994;33:11767–11775. doi: 10.1021/bi00205a012. [DOI] [PubMed] [Google Scholar]
- 13.Hughson FM, Baldwin RL. Use of site-directed mutagenesis to destabilize native apomyoglobin relative to folding intermediates. Biochemistry. 1989;28:4415–4422. doi: 10.1021/bi00436a044. [DOI] [PubMed] [Google Scholar]
- 14.Barrick D, Baldwin RL. Three-state analysis of sperm whale apomyoglobin folding. Biochemistry. 1993;32:3790–3796. doi: 10.1021/bi00065a035. [DOI] [PubMed] [Google Scholar]
- 15.Ramsay G, Ionescu R, Eftink MR. Modified spectrophotometer for multidimensional circular dichroism/fluorescence data acquisition in titration experiments: application to the pH and guanidine-HCI induced unfolding of apomyoglobin. Biophys J. 1995;69:701–707. doi: 10.1016/S0006-3495(95)79945-3. [DOI] [PMC free article] [PubMed] [Google Scholar]
- 16.Scott EE, Paster EV, Olson JS. The stabilities of mammalian apomyoglobins vary over a 600-fold range and can be enhanced by comparative mutagenesis. J Biol Chem. 2000;275:27129–27136. doi: 10.1074/jbc.M000452200. [DOI] [PubMed] [Google Scholar]
- 17.Jennings PA, Wright PE. Formation of a molten globule intermediate early in the kinetic folding pathway of apomyoglobin. Science. 1993;262:892–896. doi: 10.1126/science.8235610. [DOI] [PubMed] [Google Scholar]
- 18.Jamin M, Baldwin RL. Two forms of the pH 4 folding intermediate of apomyoglobin. J Mol Biol. 1998;276:491–504. doi: 10.1006/jmbi.1997.1543. [DOI] [PubMed] [Google Scholar]
- 19.Nishimura C, Dyson HJ, Wright PE. Identification of native and non-native structure in kinetic folding intermediates of apomyoglobin. J Mol Biol. 2006;355:139–156. doi: 10.1016/j.jmb.2005.10.047. [DOI] [PubMed] [Google Scholar]
- 20.Nishimura C, Wright PE, Dyson HJ. Role of the B helix in early folding events in apomyoglobin: evidence from site-directed mutagenesis for native-like long range interactions. J Mol Biol. 2003;334:293–307. doi: 10.1016/j.jmb.2003.09.042. [DOI] [PubMed] [Google Scholar]
- 21.Pinker RJ, Lin L, Rose GD, Kallenbach NR. Effects of alanine substitutions in alpha-helices of sperm whale myoglobin on protein stability. Protein Sci. 1993;2:1099–1105. doi: 10.1002/pro.5560020704. [DOI] [PMC free article] [PubMed] [Google Scholar]
- 22.Hargrove MS, Olson JS. The stability of holomyoglobin is determined by heme affinity. Biochemistry. 1996;35:11310–11318. doi: 10.1021/bi9603736. [DOI] [PubMed] [Google Scholar]
- 23.Moczygemba C, Guidry J, Wittung-Stafshede P. Heme orientation affects holo-myoglobin folding and unfolding kinetics. FEBS Lett. 2000;470:203–206. doi: 10.1016/s0014-5793(00)01319-3. [DOI] [PubMed] [Google Scholar]
- 24.Lin L, Pinker RJ, Phillips GN, Kallenbach NR. Stabilization of myoglobin by multiple alanine substitutions in helical positions. Protein Sci. 1994;3:1430–1435. doi: 10.1002/pro.5560030909. [DOI] [PMC free article] [PubMed] [Google Scholar]
- 25.Garcia-Moreno B, Chen LX, March KL, Gurd RS, Gurd FR. Electrostatic interactions in sperm whale myoglobin. Site specificity, roles in structural elements, and external electrostatic potential distributions. J Biol Chem. 1985;260:14070–14082. [PubMed] [Google Scholar]
- 26.Flanagan MA, Garcia-Moreno B, Friend SH, Feldmann RJ, Scouloudi H, Gurd FR. Contributions of individual amino acid residues to the structural stability of cetacean myoglobins. Biochemistry. 1983;22:6027–6037. doi: 10.1021/bi00294a051. [DOI] [PubMed] [Google Scholar]
- 27.Gupta R, Yadav S, Ahmad F. Protein stability: urea-induced versus guanidine-induced unfolding of metmyoglobin. Biochemistry. 1996;35:11925–11930. doi: 10.1021/bi961079g. [DOI] [PubMed] [Google Scholar]
- 28.Hargrove MS, Whitaker T, Olson JS, Vali RJ, Mathews AJ. Quaternary structure regulates hemin dissociation from human hemoglobin. J Biol Chem. 1997;272:17385–17389. doi: 10.1074/jbc.272.28.17385. [DOI] [PubMed] [Google Scholar]
- 29.Hargrove MS, Wilkinson AJ, Olson JS. Structural factors governing hemin dissociation from metmyoglobin. Biochemistry. 1996;35:11300–11309. doi: 10.1021/bi960372d. [DOI] [PubMed] [Google Scholar]
- 30.Hargrove MS, Barrick D, Olson JS. The association rate constant for heme binding to globin is independent of protein structure. Biochemistry. 1996;35:11293–11299. doi: 10.1021/bi960371l. [DOI] [PubMed] [Google Scholar]
- 31.Graves PE, Henderson DP, Horstman MJ, Solomon BJ, Olson JS. Enhancing stability and expression of recombinant human hemoglobin in E. coli: Progress in the development of a recombinant HBOC source. Biochim Biophys Acta. 2008;1784:1471–1479. doi: 10.1016/j.bbapap.2008.04.012. [DOI] [PubMed] [Google Scholar]
- 32.Looker D, Abbott-Brown D, Cozart P, Durfee S, Hoffman S, Mathews AJ, Miller-Roehrich J, Shoemaker S, Trimble S, Fermi G, et al. A human recombinant haemoglobin designed for use as a blood substitute. Nature. 1992;356:258–260. doi: 10.1038/356258a0. [DOI] [PubMed] [Google Scholar]
- 33.Wagenbach M, O’Rourke K, Vitez L, Wieczorek A, Hoffman S, Durfee S, Tedesco J, Stetler G. Synthesis of wild type and mutant human hemoglobins in Saccharomyces cerevisiae. Biotechnology (N Y) 1991;9:57–61. doi: 10.1038/nbt0191-57. [DOI] [PubMed] [Google Scholar]
- 34.Winterbourn CC, Carrell RW. Studies of hemoglobin denaturation and Heinz body formation in the unstable hemoglobins. J Clin Invest. 1974;54:678–689. doi: 10.1172/JCI107806. [DOI] [PMC free article] [PubMed] [Google Scholar]
- 35.Rifkind JM, Abugo O, Levy A, Heim J. Detection, formation, and relevance of hemichromes and hemochromes. Methods Enzymol. 1994;231:449–480. doi: 10.1016/0076-6879(94)31030-0. [DOI] [PubMed] [Google Scholar]
- 36.Peisach J, Blumberg WE, Wittenberg BA, Wittenberg JB, Kampa L. Hemoglobin A: an electron paramagnetic resonance study of the effects of interchain contacts on the heme symmetry of high-spin and low-spin derivatives of ferric alpha chains. Proc Natl Acad Sci U S A. 1969;63:934–939. doi: 10.1073/pnas.63.3.934. [DOI] [PMC free article] [PubMed] [Google Scholar]
- 37.Culbertson DS, Olson JS. Folding and Assembly of Myoglobins and Hemoglobins. In: Wittung-Stafshede P, Gomes CM, editors. Protein Folding and Metal Ions: Mechanisms, Biology, and Disease. Taylor and Francis, Inc; 2010. [Google Scholar]
- 38.Gibson QH, Antonini E. Kinetic studies on the reaction between native globin and haem derivatives. Biochem J. 1960;77:328–341. doi: 10.1042/bj0770328. [DOI] [PMC free article] [PubMed] [Google Scholar]
- 39.Hargrove MS, Singleton EW, Quillin ML, Ortiz LA, Phillips GN, Jr, Olson JS, Mathews AJ. His64(E7)-->Tyr apomyoglobin as a reagent for measuring rates of hemin dissociation. J Biol Chem. 1994;269:4207–4214. doi: 10.2210/pdb1mgn/pdb. [DOI] [PubMed] [Google Scholar]
- 40.Robinson CR, Liu Y, Thomson JA, Sturtevant JM, Sligar SG. Energetics of heme binding to native and denatured states of cytochrome b562. Biochemistry. 1997;36:16141–16146. doi: 10.1021/bi971470h. [DOI] [PubMed] [Google Scholar]
- 41.Springer BA, Sligar SG. High-level expression of sperm whale myoglobin in Escherichia coli. Proc Natl Acad Sci U S A. 1987;84:8961–8965. doi: 10.1073/pnas.84.24.8961. [DOI] [PMC free article] [PubMed] [Google Scholar]
- 42.Carver TE, Brantley RE, Jr, Singleton EW, Arduini RM, Quillin ML, Phillips GN, Jr, Olson JS. A novel site-directed mutant of myoglobin with an unusually high O2 affinity and low autooxidation rate. J Biol Chem. 1992;267:14443–14450. [PubMed] [Google Scholar]
- 43.Springer BA, Egeberg KD, Sligar SG, Rohlfs RJ, Mathews AJ, Olson JS. Discrimination between oxygen and carbon monoxide and inhibition of autooxidation by myoglobin. Site-directed mutagenesis of the distal histidine. J Biol Chem. 1989;264:3057–3060. [PubMed] [Google Scholar]
- 44.Ascoli F, Fanelli MR, Antonini E. Preparation and properties of apohemoglobin and reconstituted hemoglobins. Methods Enzymol. 1981;76:72–87. doi: 10.1016/0076-6879(81)76115-9. [DOI] [PubMed] [Google Scholar]
- 45.Light WR. PhD Thesis. Rice University; Houston, TX: 1987. Interactions of Heme with Apomyoglobin and Lipid Bilayers. [Google Scholar]
- 46.Irace G, Balestrieri C, Parlato G, Servillo L, Colonna G. Tryptophanyl fluorescence heterogeneity of apomyoglobins. Correlation with the presence of two distinct structural domains. Biochemistry. 1981;20:792–799. doi: 10.1021/bi00507a022. [DOI] [PubMed] [Google Scholar]
- 47.Tcherkasskaya O, Bychkova VE, Uversky VN, Gronenborn AM. Multisite fluorescence in proteins with multiple tryptophan residues. Apomyoglobin natural variants and site-directed mutants. J Biol Chem. 2000;275:36285–36294. doi: 10.1074/jbc.M003008200. [DOI] [PubMed] [Google Scholar]
- 48.Tcherkasskaya O, Ptitsyn OB, Knutson JR. Nanosecond dynamics of tryptophans in different conformational states of apomyoglobin proteins. Biochemistry. 2000;39:1879–1889. doi: 10.1021/bi992117+. [DOI] [PubMed] [Google Scholar]
- 49.Ervin J, Larios E, Osvath S, Schulten K, Gruebele M. What causes hyperfluorescence: folding intermediates or conformationally flexible native states? Biophys J. 2002;83:473–483. doi: 10.1016/S0006-3495(02)75183-7. [DOI] [PMC free article] [PubMed] [Google Scholar]
- 50.Griko YV, Privalov PL, Venyaminov SY, Kutyshenko VP. Thermodynamic study of the apomyoglobin structure. J Mol Biol. 1988;202:127–138. doi: 10.1016/0022-2836(88)90525-6. [DOI] [PubMed] [Google Scholar]
- 51.Nishii I, Kataoka M, Goto Y. Thermodynamic stability of the molten globule states of apomyoglobin. J Mol Biol. 1995;250:223–238. doi: 10.1006/jmbi.1995.0373. [DOI] [PubMed] [Google Scholar]
- 52.Barrick D, Baldwin RL. Stein and Moore Award address. The molten globule intermediate of apomyoglobin and the process of protein folding. Protein Sci. 1993;2:869–876. doi: 10.1002/pro.5560020601. [DOI] [PMC free article] [PubMed] [Google Scholar]
- 53.Barrick D, Hughson FM, Baldwin RL. Molecular mechanisms of acid denaturation. The role of histidine residues in the partial unfolding of apomyoglobin. J Mol Biol. 1994;237:588–601. doi: 10.1006/jmbi.1994.1257. [DOI] [PubMed] [Google Scholar]
- 54.Liong EC, Dou Y, Scott EE, Olson JS, Phillips GN., Jr Waterproofing the heme pocket. Role of proximal amino acid side chains in preventing hemin loss from myoglobin. J Biol Chem. 2001;276:9093–9100. doi: 10.1074/jbc.M008593200. [DOI] [PubMed] [Google Scholar]
- 55.Wittung-Stafshede P, Malmstrom BG, Winkler JR, Gray HB. Folding of deoxymyoglobin triggered by electron transfer. Journal of Physical Chemistry. 1998;102:5599–5601. [Google Scholar]
- 56.Hughson FM, Barrick D, Baldwin RL. Probing the stability of a partly folded apomyoglobin intermediate by site-directed mutagenesis. Biochemistry. 1991;30:4113–4118. doi: 10.1021/bi00231a001. [DOI] [PubMed] [Google Scholar]
- 57.Marden MC, Hazard ES, Leclerc L, Gibson QH. Flash photolysis of the serum albumin-heme-CO complex. Biochemistry. 1989;28:4422–4426. doi: 10.1021/bi00436a045. [DOI] [PubMed] [Google Scholar]
Associated Data
This section collects any data citations, data availability statements, or supplementary materials included in this article.