

Abstract
The ability to image and ultimately quantitate beta-cell mass in vivo will likely have far reaching implications in the study of diabetes biology, in the monitoring of disease progression or response to treatment, as well as for drug development. Here, using animal models, we report on the synthesis, characterization of, and intravital microscopic imaging properties of a near infrared fluorescent exendin-4 analogue with specificity for the GLP-1 receptor on beta cells (E4K12-Fl). The agent demonstrated sub-nanomolar EC50 binding concentrations, with high specificity and binding could be inhibited by GLP-1R agonists. Following intravenous administration to mice, pancreatic islets were readily distinguishable from exocrine pancreas, achieving target-to-background ratios within the pancreas of 6:1, as measured by intravital microscopy. Serial imaging revealed rapid accumulation kinetics (with initial signal within the islets detectable within 3 minutes and peak fluorescence within 20 minutes of injection) making this an ideal agent for in vivo imaging.
Keywords: β-cells, GLP1-R, imaging, targeting
Introduction
Beta-cell mass (BCM) and the functional state of islets are critical measures when assessing the magnitude of autoimmune destruction in type 1 diabetes (T1D). Progressive loss of BCM is also believed causative in the secondary failure of many therapies in type 2 diabetes. Serum tests such as stimulated insulin or C-peptide do not reliably correlate with BCM, particularly at the extremes of BCM (1). The gold standard continues to be the laborious task of measurement at autopsy via morphometric methods. It is now believed that imaging technologies could ultimately be exploited to a) better understand the history and pathophysiology of diabetes, b) enable earlier diagnosis of T1D perhaps while in the occult phase, c) allow monitoring of therapeutic efficacy and durability (including islet transplantation), and d) facilitate the discovery of new therapies. Unfortunately, the necessary tools for reliably quantifying BCM in vivo have remained elusive.
A number of imaging agents with putative beta cell specificity have been investigated, partly based on known markers/functions of these cells (e.g., glucose transporters or sulfonylurea receptors) and partly based on profiling studies (reviewed in (2–4)). Many of the imaging studies to date have relied on isotope-labeled compounds including compounds targeting sulfonylurea receptors (5), neuroreceptors such as the pre-synaptic vesicular acetylcholine transporter (6), the vesicular monoamine transporter (VMAT2) using the neurotracer 11C-dihydroterabenazine (11C-DTBZ) (7–10), or an antibody against a pancreatic islet antigen (IC-2) (11). Unfortunately, these agents have not been proven effective for in vivo islet imaging, most likely on account of their failure to achieve the required high binding ratios necessary for macroscopic imaging or a lack of understanding of the physiology of the underlying target (5, 12). Alternatively, to image at higher spatial resolution than possible with isotopic imaging techniques, a variety of fluorescent compounds have also been suggested. Labeled glucoses (13), fluorescent streptozotocin analogs (14), and Zn-chelators (which bind zinc rich insulin vesicles) (15), antibodies (12) or activatable fluorescent substrates for dipeptidyl peptidase 4 (DPP4) (16) have all been utilized. Many of these probes have been tested primarily in insulinoma or in other cells expressing high levels of glucose transporter 2 (GLUT2), where they have shown some success in vitro but not in vivo. However, it is not until recently that intravital imaging approaches have emerged as a method to validate the behavior of labeled agents in the pancreas in vivo (17–20).
Based on the recent success of therapeutic targeting of the glucagon like peptide-1 receptor (GLP-1R) in the clinic with agonists (21, 22), we hypothesized that certain fluorescent exendin-4 analogs could be used to image beta cells in vivo, but that detailed investigations would be necessary to assure target binding of putative key compounds. In this report, we systematically investigated several analogs and characterized the most promising candidates before performing in vivo validation studies including intravital imaging. Our results demonstrated high islet specificity within the pancreas in vivo with the compound (E4K12-Fl).
Experimental methods
Materials
All reagents were purchased from Sigma-Aldrich (St. Louis, MO) and used without further purification unless otherwise noted. Exendin-4 was obtained from Prospec (Rehovot, Israel). Near-infrared fluorochrome Vivotag-680 (VT680-NHS ester) was purchased from VisEn (Bedford, MA). LC-ESI-MS analysis and HPLC-purifications were performed on a Waters (Milford, MA) LC-MS system. For LC-ESI-MS analyses, a Waters XTerra® C18 5 μm column was used. For preparative runs, an Atlantis® Prep T3 OBD™ 5 μM column was used. MALDI-MS spectra were collected on a Voyager-DE™ Biospectrometry™ Workstation spectrometer (Applied Biosystems™, Foster City, CA).
Preparation of 11-Azido-3,6,9-trioxaundecan-1-amide-Fl
To a solution of 10 mg (46 μmol) 11-Azido-3,6,9-trioxaundecan-1-amine in 300 μL 10X PBS, 2.5 mg (2 μmol) VivoTag 680 was added and the reaction solution stirred at room temperature in the dark for 2 hours. The crude mixture was directly subjected to HPLC-purification, yielding 1.5 mg (1.1 μmol, 56%) of the title compound as a blue solid. ESI-LC-MS m/z (%) = 1342 [M+H+]+.
Preparation of E440-Fl
To a solution of 0.8 mg (0.2 μmol) exendin-4(40-Pra) in 400 μL of a 25 mM Tris-buffered aqueous solution (pH = 7.2), 50 μL of a 50 mM solution of L-ascorbic acid in H2O and 50 μL of a 50 mM aqueous CuSO4 solution in H2O was added. 0.4 mg (0.3 μmol) of 11-Azido-3,6,9-trioxaundecan-1-amide-VT680 in 500 uL 2X PBS solution was then added and the reaction mixture was gently stirred at room temperature in the dark over night. The crude mixture was diluted with 2 mL of 1X PBS and purified using an Amicon® Ultra 3 kDa (Millipore, Carrigtwohill, Ireland) centrifugal filter, before it was subjected to HPLC purification, yielding 0.3 mg (0.05 μmol, 25%) of the title compound as a blue film. ESI-LC-MS m/z (%) = 1405 [M-4H+]4− (100); 1873 [M-3H+]3− (14).
Preparation of E4K12-Fl
To a solution of 250 μg (0.06 μmol) of Exendin-4 in 3.6 mL of a 25 mM Tris-buffered aqueous solution (pH = 7.2), 1 mg VivoTag 680 (0.8 μmol) was added and the reaction mixture stirred at room temperature in the dark for 3 hours. The mixture was subjected to HPLC-purification, yielding the title compound as a blue solid (100 μg, 0.02 μmol, 33%). ESI-LC-MS m/z (%) = 1769 [M-3H+]3− (100).
MALDI-MS spectra
To a suspension of sinapinic acid (5 μL, 10 mg/mL, AcN/H2O = 1/1, 0.5 % TFA), 5 μL of protein sample (approx. 100 μM in H2O) was added and the carefully mixed solution purified via ZipTips (Millipore, Billercia, MA) prior to measurement. Each sample was also run with adrenocorticotropic hormone fragment 18–39 (ACTH fragment 18–39) as a calibration standard.
Tryptic digest
To a solution of E4K12-Fl (10.5 μL, approx. 10 μg), 15 μL NaHCO3 (50 mM) and 1.5 μL dithiothreitol (DTT; 100 mM) was added, and the mixture was incubated at 95 °C for 5 minutes. Subsequently, 3 μL of IAA (100 mM) was added and the sample was incubated at room temperature for 20 minutes, before 1 μL of activated trypsin (100 ng/μL, Pierce, Rockford, IL) was added. This was followed by an incubation at 37 °C for 3 hours. An additional 1 μL of activated trypsin (100 ng/μL) was then added and the sample was further incubated at 37 °C for 2 hours, before being purified using ZipTips (Millipore, Billerica, MA) and subjected to MALDI-MS analysis.
Cell culture
Mouse insulinoma-derived MIN6 cells, courtesy of Dr. Miyazaki (23), were used between passages 26 and 40 and grown in high-glucose DMEM containing 15 % (v/v) heat-inactivated FBS, 50 U/ml penicillin, and 10 μg/ml streptomycin as reported previously (24). HEK 293 cells, stably expressing human GLP-1R (HEK/hGLP-1R) (25),were grown in high glucose DMEM containing 10% (v/v) heat-inactivated FBS, 50 U/ml penicillin, 10 μg/ml streptomycin, 1 mM sodium pyruvate, and 150 μg/ml G418. NIH-3T3 fibroblasts (ATCC) were grown in high glucose DMEM containing 10% (v/v) heat-inactivated FBS, 50 U/ml penicillin, and 10 μg/ml streptomycin.
Western Blot
MIN6, HEK/hGLP-1R or NIH-3T3 cells, seeded into 6-well plates were washed twice with ice-cold PBS and lysed on ice with 200 μl ice-cold RIPA lysis buffer. Protein concentrations were determined using bicinchoninic acid (BCA) protein assays (Pierce, Rockford, IL). Cell lysates (50 μg) were subjected to SDS PAGE, followed by immunoblotting using a specific anti-GLP-1R antibody (Abcam), and detection with chemiluminescence (Pierce, Rockford, IL).
Cellular imaging
MIN6 (2×10⁵ cells/well), HEK/hGLP-1R (7.5×10⁴ cells/well) or NIH-3T3 (7.5×10⁴ cells/well) cells were seeded into 8-well chamber slides (LabTek, Rochester, NY) and incubated for 48 hours before incubation with 100 nM of E4K12-Fl for the indicated time points at 37 °C. Cells were washed three times with PBS before subjected to imaging. MIN6, HEK/hGLP-1R and NIH 3T3 cells were imaged on an Olympus FluoView1000 confocal laser scanning microscope with an Olympus XLPan N 25x (N.A. 1.1) water immersion objective and the FluoView 1000 Vers. 2.1a program. E4K12-Fl was imaged using a 635 nm laser, dichroic mirrors DM405/488/559/635 and SDM640 and a barrier filter BA655-755.
Dose-response assays
MIN6 (1×10⁵ cells/well), HEK/hGLP-1R (3×10⁴ cells/well) or NIH-3T3 (3×10⁴ cells/well) cells were seeded into 96-well plates and incubated for 48 hours before adding different concentrations of E4K12-Fl. After incubating for 1 hour at 37 °C, cells were washed three times with PBS and the fluorescence levels were measured with a SynergyMx plate reader (Biotek) with excitation at 620 nm and emission at 690 nm. Following fluorescence measurement, proteins were extracted using RIPA lysis buffers (24) and quantified using BCA (Pierce, Rockford, IL).
Blocking Experiments
MIN6 (1×10⁵ cells/well), HEK/hGLP-1R (3×10⁴ cells/well) or NIH-3T3 (3×10⁴ cells/well) cells were seeded into 96-well plates and incubated for 48 hours before incubation with either exendin-4 (100 nM) for 1 hour at 37 °C and subsequently E4K12-Fl (10 nM) for 1 hour at 37 °C, or just E4K12-Fl (10 nM) for 1 hour at 37 °C. Following the incubation, cells were washed three times with PBS and the fluorescence levels were measured with SynergyMx plate reader (Biotek) with excitation at 620 nm and emission at 690 nm. Following fluorescence measurement, proteins were extracted using RIPA lysis buffers (24) and quantified using BCA (Pierce, Rockford, IL).
Animals
NOD MIP-GFP mice (NOD.Cg-Tg(Ins-EGFP)Hara/QtngJ), that express the fluorescent protein EGFP within the islets under the mouse insulin 1 promoter were obtained from The Jackson Laboratory (Bar Harbor, ME). All procedures and animal protocols were approved by the subcommittee on Research Animal care at Massachusetts General Hospital.
Animal Preparation
Nondiabetic male NOD MIP-GFP mice were anesthetized with 2% isoflurane and 2 L/minute O2. The peritoneal cavity was opened with a transverse incision in the disinfected abdominal wall. The gastric-splenic ligament was dissected and the pancreas carefully exteriorized. Robust blood ow was observed in the pancreatic arteries for the duration of each experiment and pancreas perfusion was confirmed by observation of a circulating fluorescent vascular agent (Angiosense 750, VisEn, Bedford, MA). The exteriorized pancreas was completely submerged in temperature-controlled lactated Ringer’s solution. Temperature near the spleen was carefully monitored using an Omega HH12A thermometer with ne wire thermocouples (Omega Engineering Inc., Stamford, CT) and kept at 37 °C. A tail vein catheter, made using a 30G × ½″ needle inserted into CLAY ADAMS® Polyethylene10 tubing, was inserted prior to surgery. Subsequently, 200 μL (4 nmol/200 μL) of E4K12-Fl and 10 minutes after the initial injection, another 200 μL (4 nmol/200 μL) of E4K12-Fl was injected via the tail vein catheter.
Intravital Laser Scanning Microscopy
Images were collected with a prototypical intravital laser scanning microscope (IV100, Olympus Corporation, Tokyo, Japan) (26) using an Olympus 4x (UplanSApo N.A. 0.16), and 20x (UplanFL N.A. 0.5) objective and the Olympus FluoView FV300 version 4.3 program. Samples were excited at 488 nm with an air-cooled argon laser (Melles Griot, Carlsbad, CA) for visualization of the GFP expressing islet-cells, at 633 nm with a HeNe-R laser (Model 05LHP925, Melles Griot) for visualization of E4K12-Fl, and at 748 nm with a red diode laser (Model FV10-LD748, Olympus Corporation, Tokyo, Japan) for visualization of the blood pool agent (AngioSense-780, VisEn Medical, MA). Light was collected using custom-built dichroic mirrors SDM-560, SDM640, and SDM-750, and with emission filters BA 505-550, BA660-730, and BA 770 nm IF (Olympus Corporation, Tokyo, Japan). The E4K12-Fl signal was collected sequentially to the other channels to avoid bleed-through into the VT680 channel. A prototypical tissue stabilizer (Olympus Corporation, Tokyo, Japan) was used to reduce motion and to stabilize the focal plane. The stabilizer was attached to the objective and its z-position was finely adjusted using a micrometer screw to apply soft pressure on the tissue.
Histology
Nondiabetic male NOD MIP-GFP mice were cannulated with a tail vein catheter, made using a 30G × ½″ needle inserted into CLAY ADAMS® Polyethylene10 tubing. Subsequently, 200 μL (4 nmol/200 μL) of E4K12-Fl was injected via the tail vein catheter. Mice were sacrificed 2 hours after the initial injection, the pancreas was harvested and frozen in OCT compound (Sakura, Finetek, Torrance, CA) with isopentane on dry ice. The frozen tissues were sectioned (thickness: 6 μm) and mounted on microscope slides. Without further processing, tissue samples were excited with an EXFO X-CiteTM 120 light source (EXFO Photonic Solutions Inc. Ontario, Canada) and imaged with a Nikon Eclipse 80i microscope with either a 10x Plan Fluor N.A. 0.3 and a 20x Plan Apo 0.75 objective (Nikon corporation, USA) respectively. GFP fluorescence was observed with a Chroma HQ FITC filter cube (HQ480/40x EX, dichroic Q505LP BS, and emission filter HQ535/50m EM) and Exendin-VT680 fluorescence with a Chroma Cy5.5 filter cube (HQ650/45x EX, dichroic Q680LP BS, and emission filter HQ710/50m EM; Chroma Technology Corp., VT, USA). Images were captured with a Cascade Model 512B camera (Roper Scientific, Tucson, Arizona). Validation of fluorescence signals employed immunohistochemistry for insulin (Insulin (H-86), Santa Cruz Biotechnology, Santa Cruz, CA) using the avidin-biotin peroxidase method. The reaction was visualized with a 3-amino-9-ethyl-carbazole substrate (AEC, Sigma Chemical, Saint Louis, Missouri). Adjacent sections treated with nonimmune IgG provided controls for antibody specificity.
Results
Near infrared fluorescent exendin-4 analogues were created via two different strategies (Fig. 1). In the first strategy, an alkyne-modified artificial amino acid (S)-2-amino-4-pentynoic acid was attached to the C-terminal end of exendin-4, yielding the peptide Exendin-4-Pra. To this peptide, an azide-modified near infrared (NIR) fluorochrome 11-azido-3,6,9-trioxaundecan-1-amide-Fl was covalently attached using standard copper catalyzed click-chemistry protocols, yielding the exendin-4-like NIR-fluorochrome, E440-Fl. 11-azido-3,6,9-trioxaundecan-1-amide-Fl was generated in good yields (56%) by conjugation of 11-azido-3,6,9-trioxaundecan-1-amine to the commercially available NIR fluorochrome VT680-NHS ester in the presence of triethylamine. The structural identity of the exendin-like NIR-fluorochrome E440-Fl, was confirmed using liquid chromatography-mass spectrometry (LC/MS) analysis, which confirmed the expected mass of 5623 g/mol (m/z (%) = 1405 [M-4H+]4 − (100); 1873 [M-3H+]3 − (14)). The second approach was based on the direct reaction of VT680-NHS ester with exendin-4, facilitated in a Tris-HCl buffered aqueous solution. Although exendin-4 offers multiple nucleophilic sites, which can all theoretically react with NHS esters at one or multiple sites, only three reaction products were detected in the crude reaction mixture via LC/MS under current reaction conditions. All of the products had the same mass of 5311 g/mol (m/z (%) =1769 [M-3H+]3− (100); Fig. 2b), which corresponded to the addition of a single fluorochrome per exendin-4. Three products were observed in ratios of 5/5/90. The major product (90 %) was isolated using preparative HPLC, yielding the exendin-4-like NIR fluorochrome E4K12-Fl (Fig. 1).
Figure 1.

Top: Amino acid sequences, molecular weight and structures of synthesized fluorescent exendin-4 based compounds. Bottom Left: The molecular model of exendin-4-like NIR fluorochrome, E4K12-Fl, is based on the nuclear magnetic resonance (NMR)-structure, 1JRJ (33). Bottom right: The molecular model of exendin-4-like NIR fluorochrome E4K12-Fl (amino acids 9–39) complexed with the extracellular domain of GLP-1R, is based on the crystal structure, 3C59 (30).
Figure 2.

(a) An ESI-MS trace of E440-Fl; (b) An ESI-MS trace of E4K12-Fl; (c) MALDI-MS traces of Exendin-4 and E4K12-Fl; (d) MALDI-MS traces of tryptic digest fragments of Exendin-4 and E4K12-Fl.
The mass of E4K12-Fl was analyzed using matrix assisted laser desorption ionization mass spectrometry (MALDI-MS), which confirmed the exendin-4-like NIR fluorochrome to be composed of exendin-4 and a single fluorochrome molecule (m/z = 5311, Fig. 2c). Structural analysis of the compound was determined by tryptic digestion of both E4K12-Fl and exendin-4. Whereas exendin-4 displayed two strongly ionizing fragments at 1278 Da (H1-K12) and 948 Da (L21-K27), tryptic digest of E4K12-Fl did not result in the formation of a 1278 Da fragment, but showed a dominant peak at 3373 Da (Fig. 2d). The fragment corresponded to amino acids H1-R20 (2251 Da) plus the mass of the fluorochrome (1123 Da). Observation of a peak at 3373 Da for E4K12-Fl but not for exendin-4 indicated that the fluorochrome was part of that fragment and that it was conjugated to amino acid K12. If the fluorochrome were not conjugated to K12, the fragment would have been digested by trypsin at the K12-position into two smaller fragments. The predominant attachment of the fluorochrome to K12 compared to other nucleophilic residues (e.g. K27 or the N-terminus) is likely explained by either sterically or electronically favored conformations of K12.
In order to determine accumulation of E4K12-Fl on GLP-1R expressing cells, we tested the compounds against human GLP1-R overexpressing HEK/hGLP-1R cells (HEK/hGLP-1R), GLP-1R naturally expressing MIN6, and against GLP-1R negative NIH 3T3 cells (Fig 3). The expression levels of GLP-1R were then analyzed by staining the respective cell lysates with an anti-GLP-1R antibody and equal cell lysate concentrations were analyzed by staining against tubulin in western blots (Fig. 3). Western blotting confirmed GLP-1R to be absent in NIH 3T3 cells and overexpressed in transformed HEK/hGLP-1R cells. Each cell line was incubated with different concentrations of E4K12-Fl for 1 hour. The cells were later washed and their fluorescence measured. The fluorescent signal was normalized to the number of cells present in each well. GLP-1R overexpressing HEK/hGLP-1R cells displayed the highest fluorescence, followed by insulinoma-derived MIN6 cells. GLP-1R negative NIH 3T3 cells did not show any discernible fluorescence (Fig. 3a). For HEK/hGLP-1R cells, a binding EC50 of 0.3 ± 0.2 nM was determined and for MIN6 cells, the observed EC50 was 0.5 ± 0.3 nM. These findings were corroborated using confocal microscopy (Fig. 3c). Blocking experiments with non-fluorescent exendin-4 were subsequently conducted. Pre-treated HEK/hGLP-1R cells were observed to have a 12-fold lower fluorescence and pre-treated MIN6 cells a 5-fold lower fluorescence. Finally, we also tested the terminally labeled E440-Fl (as in a previous study (19)) which did not show strong preferential accumulation in GLP-1R expressing cell lines.
Figure 3.

(a) Dose-response curves of E4K12-Fl where GLP-1R is either overexpressed (HEK/hGLP-1R) or naturally expressed (MIN6), and of a GLP-1R negative (NIH 3T3) cell line; (b) blocking of E4K12-Fl (10 nM) with Exendin-4 (100 nM); (c) Live cell microscopy; HEK/hGLP-1R, MIN6 or NIH 3T3 cells were treated with E4K12-Fl (10 nM) and then imaged. Scale bar: 50 μm (d) Western Blot of HEK/hGLP-1R, MIN6 and NIH 3T3 cell lines against GLP-1R and tubulin.
In order to evaluate the performance of E4K12-Fl in vivo, NOD MIP-GFP mice were anesthetized and the pancreas exteriorized onto a heated chamber for real-time multi-channel confocal imaging. Microvasculature was imaged in the 750 nm channel after injection of AngioSense-780, a long circulating blood pool agent, and islets were identified in the 488 nm channel via their GFP expression. Following this, 8 nmol of E4K12-Fl in 200 μL of PBS was injected, and accumulation of the probe in the islets and surrounding tissue was monitored (Fig. 4). Intravital imaging confirmed that prior to imaging no signal corresponding to a pancreatic islet was observable in the E4K12-Fl channel (Fig. 5, 0 min). However, after 3 minutes, accumulation of E4K12-Fl could be observed in the pancreatic islets, and this fluorescence increased during the observation time of 20 minutes, after which steady state was reached (Target-to-background ratio of 6:1; Fig. 5). Ninety minutes after injection, the signal still displayed a ratio of 6:1. Following comparison of imaging results from the vasculature and the GFP-islets, it was confirmed that E4K12-Fl co-localized in the pancreatic beta cells, and did not simply extravasate from the vasculature that traverses the islets. During the time of measurement, no increase in background noise from surrounding tissue was observed. The target-to-background ratio of islets over exocrine pancreas was 6.0 ± 0.5 in steady state. To further confirm that probe accumulation occurs in pancreatic beta cells, we performed additional immuno- and fluorescence histology (Fig. 6). These studies also demonstrated exclusive accumulation of E4K12-Fl in the islets and specifically in the pancreatic beta cells expressing insulin and GLP-1R. Biodistribution studies show renal excretion of non-localized agent and intracellular degradation in endosomal compartments.
Figure 4.
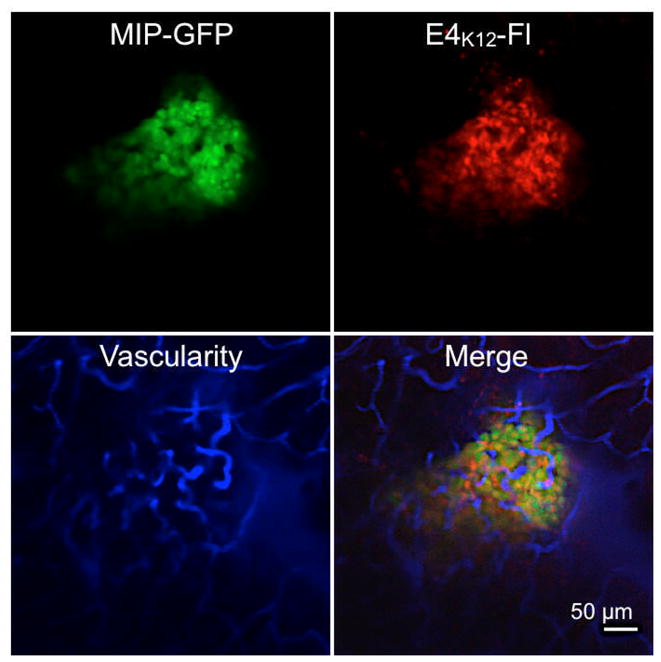
In vivo imaging of E4K12-Fl in a pancreatic islet of a live NOD MIP-GFP mouse; Green: GFP-expressing pancreatic beta cells; Red: E4K12-Fl accumulation (dose: 0.4 nmol/g); Blue: fluorescent vascular agent. All images acquired with 20× objective in anesthetized live mice. Scale bar: 50 μm.
Figure 5.

In vivo time course imaging of probe accumulation in an islet. (a) GPF channel (488 nm); (b) E4k12-Fl channel (680 nm), (c) vasculature (750 nm; all images with 10× objectives). Scale bar: 200 μm.
Figure 6.
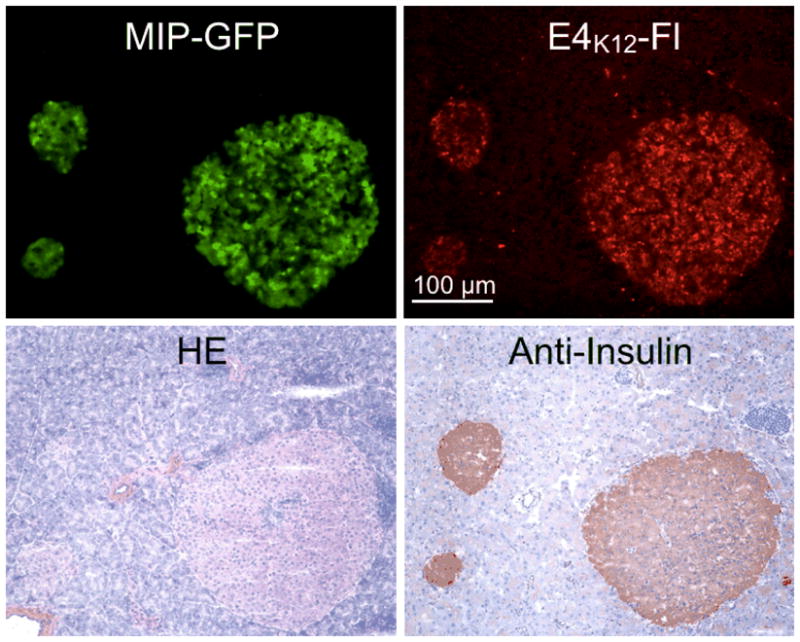
Immuno- and fluorescence histology of adjacent pancreas sections from a MIP-GFP mouse injected with E4K12-Fl. Top left: GFP channel, green: pancreatic islets, 10X; top right: E4K12-Fl accumulation, red: pancreatic islets, 10X. Bottom left: HE; bottom right: anti-insulin staining. Scale bar: 100 μm.
Discussion
T1D is a classic example of an organ-specific autoimmune disease. It has two stages. The first is an occult phase, termed insulitis, in which a mixed population of leukocytes invades the islets of Langerhans of the pancreas. This, in turn, eventually provokes specific destruction of the insulin-producing beta cells. The second stage is the overt phase (diabetes), in which the bulk of beta cells have been destroyed, and insulin production is no longer sufficient to regulate blood-glucose levels. This eventually results in hyperglycemia. To date, a major hindrance to both research on and treatment of T1D, has been the inability to directly visualize beta cells during disease progression. Our goal has therefore been to develop robust, non-invasive methods to image BCM (both experimentally in mouse models and clinically). Thus far, we have tested most of the published fluorescent probes in vivo in MIP-GFP mice, but with little or modest success. Based on profiling studies, we also investigated a number of novel targets including carboxypeptidase E (CPE), proprotein convertase subtilisin/kexin 2 (PCSK2) or islet amyloid polypeptide (IAPP), among others. This study now reports on the first selective fluorophore-based probe for in vivo imaging of pancreatic beta cells, and we confirm its potency in biochemical assays, in in vitro assays, by histology and by in vivo imaging.
The islets of Langerhans, encompassing the endocrine pancreas, represent approximately 1–2% of the pancreatic mass. They are also scattered throughout the pancreas, which is likely the underlying reason for the previous difficulties in visualizing BCM with macroscopic imaging techniques (5). Within each islet, there are five major endocrine cell types: insulin-producing beta cells (60–80% of the islet), glucagon-producing alpha cells (15–20% of the islet), somatostatin-producing delta cells (5–10% of the islet), and pancreatic-polypeptide-producing (PP) cells (15–20% of the islet), and ghrelin-producing epsilon-cells (< 1%).
The adult mouse pancreas contains about 3,000 islets, with about 2×10⁶ beta cells (27). The human pancreas contains about 106 islets. These pancreatic islets measure 50–300 μm in diameter and are highly vascularized, with 1–5 arterioles branching into numerous capillaries. Capillaries are fenestrated and are therefore highly permeable. It has been estimated that islets receive 10–20% of pancreatic blood flow, which is disproportionally large for an area that assumes 1 to 2% of pancreatic volume and < 0.005% of body weight. This feature, however, creates a favorable environment for the delivery of imaging agents. In our studies, we used intravital confocal microscopy to study islet microvascularity and were able to show rapid delivery of the E4K12-Fl agent to the pancreatic islets with high spatial overlap with EGFP labeled beta cells.
In the pancreas of mice, rats, and humans, the GLP-1R is highly expressed within the islets and to a lesser extent within some ducts. Within the islets the GLP-1R protein almost exclusively co-localizes with insulin and is highly restricted to pancreatic beta cells (28). This distribution makes the GLP-1R a good target for measuring BCM. Glucagon-like peptide-1 (GLP-1) is secreted by intestinal L cells as a gut hormone and its secretion is dependent on the presence of nutrients in the small intestine. The physiological functions of GLP-1 include potentiation of insulin secretion in a glucose dependent manner as well as influencing a number of gastric functions (slowing gastric emptying and inhibiting acid secretion). GLP-1 analogues are a new class of drugs for the treatment of diabetes as they have a low risk of causing hypoglycemia (29). Exenatide (Byetta), the first FDA approved GLP-1 analog, is a synthetic version of exendin-4, a hormone found in the saliva of the Gila monster. It has 53% sequence homology with GLP-1 (30). A recent crystal structure shows that exendin-4 binds to the extracellular domain of GLP-1R (30). From this crystal structure, it follows that the amino acid K12 is not involved in GLP-1R binding (Fig. 1) and explains its efficacy as an imaging agent. Conversely, other modifications with fluorochromes do alter binding.
In this study, we focused on the exendin-4 analog E4K12-Fl. There are, however, several other pharmaceutical analogues of GLP-1 that are currently in development or in clinical use, including liraglutide, albiglutide and taspoglutide, each of which have variable substitutions and modifications that alter their pharmacokinetics (21). It is entirely possible that we will be able to further optimize probe development by using some of these newer GLP-1 analogues as platforms. Another potential avenue for probe development would be to use the peptide as a targeting ligand for the delivery of multimodal, nanoparticle based constructs for imaging (31) and or therapeutics (32). We believe that the featured E4K12-Fl, and possibly similar derivatives, will prove useful agents for the selective visualization of beta cells. Finally, it appears reasonable that more immediately one should be able to use the described agent in the imaging of often difficult to localize insulinomas, possibly via positron emission tomography (PET) tracers, via magnetic resonance imaging (MRI) with agents based on this peptide, or by intraoperative imaging of fluorescent compounds as described.
Acknowledgments
We would especially like to thank Christophe Benoist and Diane Mathis for many helpful discussions. We acknowledge the help of Yoshiko Iwamoto for histology and Rostic Gorbatov for surgery. The work was supported in part by P01 AI54904 (DM, RK, RW), RO1 67536 (RK), U24 CA092782 (RW) and a grant from the Deutsche Akademie der Naturforscher Leopolina (German Academy of Sciences Leopoldina) to TR.
References
- 1.McCulloch DK, Koerker DJ, Kahn SE, Bonner-Weir S, Palmer JP. Correlations of in vivo beta-cell function tests with beta-cell mass and pancreatic insulin content in streptozocin-administered baboons. Diabetes. 1991;40:673–679. doi: 10.2337/diab.40.6.673. [DOI] [PubMed] [Google Scholar]
- 2.Malaisse WJ, Louchami K, Sener A. Noninvasive imaging of pancreatic beta cells. Nat Rev Endocrinol. 2009;5:394–400. doi: 10.1038/nrendo.2009.103. [DOI] [PubMed] [Google Scholar]
- 3.Mathis D, Gaglia J. Autoimmune diabetes. In: Weissleder R, Ross BD, Rehemtulla A, Gambhir SS, editors. Molecular Imaging. People’s Medical Publishing House-USA; Shelton, CT: 2010. [Google Scholar]
- 4.Maffei A, Liu Z, Witkowski P, Moschella F, Del Pozzo G, Liu E, Herold K, Winchester RJ, Hardy MA, Harris PE. Identification of tissue-restricted transcripts in human islets. Endocrinology. 2004;145:4513–4521. doi: 10.1210/en.2004-0691. [DOI] [PubMed] [Google Scholar]
- 5.Sweet IR, Cook DL, Lernmark A, Greenbaum CJ, Wallen AR, Marcum ES, Stekhova SA, Krohn KA. Systematic screening of potential beta-cell imaging agents. Biochem Biophys Res Commun. 2004;314:976–983. doi: 10.1016/j.bbrc.2003.12.182. [DOI] [PubMed] [Google Scholar]
- 6.Clark PB, Gage HD, Brown-Proctor C, Buchheimer N, Calles-Escandon J, Mach RH, Morton KA. Neurofunctional imaging of the pancreas utilizing the cholinergic PET radioligand [18F]4-fluorobenzyltrozamicol. Eur J Nucl Med Mol Imaging. 2004;31:258–260. doi: 10.1007/s00259-003-1350-7. [DOI] [PubMed] [Google Scholar]
- 7.Souza F, Simpson N, Raffo A, Saxena C, Maffei A, Hardy M, Kilbourn M, Goland R, Leibel R, Mann JJ, Van Heertum R, Harris PE. Longitudinal noninvasive PET-based beta cell mass estimates in a spontaneous diabetes rat model. J Clin Invest. 2006;116:1506–1513. doi: 10.1172/JCI27645. [DOI] [PMC free article] [PubMed] [Google Scholar]
- 8.Simpson NR, Souza F, Witkowski P, Maffei A, Raffo A, Herron A, Kilbourn M, Jurewicz A, Herold K, Liu E, Hardy MA, Van Heertum R, Harris PE. Visualizing pancreatic beta-cell mass with [11C]DTBZ. Nucl Med Biol. 2006;33:855–864. doi: 10.1016/j.nucmedbio.2006.07.002. [DOI] [PMC free article] [PubMed] [Google Scholar]
- 9.Souza F, Freeby M, Hultman K, Simpson N, Herron A, Witkowsky P, Liu E, Maffei A, Harris PE. Current progress in non-invasive imaging of beta cell mass of the endocrine pancreas. Curr Med Chem. 2006;13:2761–2773. doi: 10.2174/092986706778521940. [DOI] [PubMed] [Google Scholar]
- 10.Harris PE, Ferrara C, Barba P, Polito T, Freeby M, Maffei A. VMAT2 gene expression and function as it applies to imaging beta-cell mass. J Mol Med. 2007;86:5–16. doi: 10.1007/s00109-007-0242-x. [DOI] [PubMed] [Google Scholar]
- 11.Moore A, Bonner-Weir S, Weissleder R. Noninvasive in vivo measurement of beta-cell mass in mouse model of diabetes. Diabetes. 2001;50:2231–2236. doi: 10.2337/diabetes.50.10.2231. [DOI] [PubMed] [Google Scholar]
- 12.Ueberberg S, Meier JJ, Waengler C, Schechinger W, Dietrich JW, Tannapfel A, Schmitz I, Schirrmacher R, Koller M, Klein HH, Schneider S. Generation of novel single-chain antibodies by phage-display technology to direct imaging agents highly selective to pancreatic beta- or alpha-cells in vivo. Diabetes. 2009;58:2324–2334. doi: 10.2337/db09-0658. [DOI] [PMC free article] [PubMed] [Google Scholar]
- 13.Yamada K, Nakata M, Horimoto N, Saito M, Matsuoka H, Inagaki N. Measurement of glucose uptake and intracellular calcium concentration in single, living pancreatic beta-cells. J Biol Chem. 2000;275:22278–22283. doi: 10.1074/jbc.M908048199. [DOI] [PubMed] [Google Scholar]
- 14.Ran C, Pantazopoulos P, Medarova Z, Moore A. Synthesis and Testing of Beta-Cell-Specific Streptozotocin-Derived Near-Infrared Imaging Probes. Angew Chem Int Ed Engl. 2007;46:8998–9001. doi: 10.1002/anie.200702183. [DOI] [PubMed] [Google Scholar]
- 15.Denis MC, Mahmood U, Benoist C, Mathis D, Weissleder R. Imaging inflammation of the pancreatic islets in type 1 diabetes. Proc Natl Acad Sci U S A. 2004;101:12634–12639. doi: 10.1073/pnas.0404307101. [DOI] [PMC free article] [PubMed] [Google Scholar]
- 16.Ho NH, Weissleder R, Tung CH. Development of a dual fluorogenic and chromogenic dipeptidyl peptidase IV substrate. Bioorg Med Chem Lett. 2006;16:2599–2602. doi: 10.1016/j.bmcl.2006.02.045. [DOI] [PubMed] [Google Scholar]
- 17.Kelly KA, Bardeesy N, Anbazhagan R, Gurumurthy S, Berger J, Alencar H, Depinho RA, Mahmood U, Weissleder R. Targeted nanoparticles for imaging incipient pancreatic ductal adenocarcinoma. PLoS Med. 2008;5:e85. doi: 10.1371/journal.pmed.0050085. [DOI] [PMC free article] [PubMed] [Google Scholar]
- 18.Mukai E, Toyoda K, Kimura H, Kawashima H, Fujimoto H, Ueda M, Temma T, Hirao K, Nagakawa K, Saji H, Inagaki N. GLP-1 receptor antagonist as a potential probe for pancreatic beta-cell imaging. Biochem Biophys Res Commun. 2009;389:523–526. doi: 10.1016/j.bbrc.2009.09.014. [DOI] [PubMed] [Google Scholar]
- 19.Gotthardt M, Lalyko G, van Eerd-Vismale J, Keil B, Schurrat T, Hower M, Laverman P, Behr TM, Boerman OC, Goke B, Behe M. A new technique for in vivo imaging of specific GLP-1 binding sites: first results in small rodents. Regul Pept. 2006;137:162–167. doi: 10.1016/j.regpep.2006.07.005. [DOI] [PubMed] [Google Scholar]
- 20.Martinic MM, von Herrath MG. Real-time imaging of the pancreas during development of diabetes. Immunol Rev. 2008;221:200–213. doi: 10.1111/j.1600-065X.2008.00581.x. [DOI] [PubMed] [Google Scholar]
- 21.Ahren B. Islet G protein-coupled receptors as potential targets for treatment of type 2 diabetes. Nat Rev Drug Discov. 2009;8:369–385. doi: 10.1038/nrd2782. [DOI] [PubMed] [Google Scholar]
- 22.Doyle ME, McConville P, Theodorakis MJ, Goetschkes MM, Bernier M, Spencer RG, Holloway HW, Greig NH, Egan JM. In vivo biological activity of exendin (1–30) Endocrine. 2005;27:1–9. doi: 10.1385/ENDO:27:1:001. [DOI] [PubMed] [Google Scholar]
- 23.Miyazaki J, Araki K, Yamato E, Ikegami H, Asano T, Shibasaki Y, Oka Y, Yamamura K. Establishment of a pancreatic beta cell line that retains glucose-inducible insulin secretion: special reference to expression of glucose transporter isoforms. Endocrinology. 1990;127:126–132. doi: 10.1210/endo-127-1-126. [DOI] [PubMed] [Google Scholar]
- 24.Borowiec M, Liew CW, Thompson R, Boonyasrisawat W, Hu J, Mlynarski WM, El Khattabi I, Kim SH, Marselli L, Rich SS, Krolewski AS, Bonner-Weir S, Sharma A, Sale M, Mychaleckyj JC, Kulkarni RN, Doria A. Mutations at the BLK locus linked to maturity onset diabetes of the young and beta-cell dysfunction. Proc Natl Acad Sci USA. 2009;106:14460–14465. doi: 10.1073/pnas.0906474106. [DOI] [PMC free article] [PubMed] [Google Scholar]
- 25.Gromada J, Rorsman P, Dissing S, Wulff BS. Stimulation of cloned human glucagon-like peptide 1 receptor expressed in HEK 293 cells induces cAMP-dependent activation of calcium-induced calcium release. FEBS Lett. 1995;373:182–186. doi: 10.1016/0014-5793(95)01070-u. [DOI] [PubMed] [Google Scholar]
- 26.Alencar H, Mahmood U, Kawano Y, Hirata T, Weissleder R. Novel multiwavelength microscopic scanner for mouse imaging. Neoplasia. 2005;7:977–983. doi: 10.1593/neo.05376. [DOI] [PMC free article] [PubMed] [Google Scholar]
- 27.Park SY, Wang X, Chen Z, Powers AC, Magnuson MA, Head WS, Piston DW, Bell GI. Optical imaging of pancreatic beta cells in living mice expressing a mouse insulin I promoter-firefly luciferase transgene. Genesis. 2005;43:80–86. doi: 10.1002/gene.20157. [DOI] [PubMed] [Google Scholar]
- 28.Tornehave D, Kristensen P, Romer J, Knudsen LB, Heller RS. Expression of the GLP-1 receptor in mouse, rat, and human pancreas. J Histochem Cytochem. 2008;56:841–851. doi: 10.1369/jhc.2008.951319. [DOI] [PMC free article] [PubMed] [Google Scholar]
- 29.Lin F, Wang R. Molecular modeling of the three-dimensional structure of GLP-1R and its interactions with several agonists. J Mol Model. 2009;15:53–65. doi: 10.1007/s00894-008-0372-2. [DOI] [PubMed] [Google Scholar]
- 30.Runge S, Thogersen H, Madsen K, Lau J, Rudolph R. Crystal structure of the ligand-bound glucagon-like peptide-1 receptor extracellular domain. J Biol Chem. 2008;283:11340–11347. doi: 10.1074/jbc.M708740200. [DOI] [PubMed] [Google Scholar]
- 31.Nahrendorf M, Keliher E, Marinelli B, Waterman P, Feruglio PF, Fexon L, Pivovarov M, Swirski FK, Pittet MJ, Vinegoni C, Weissleder R. Hybrid PET-optical imaging using targeted probes. Proc Natl Acad Sci U S A. 2010;107:7910–7915. doi: 10.1073/pnas.0915163107. [DOI] [PMC free article] [PubMed] [Google Scholar]
- 32.Weissleder R, Pittet MJ. Imaging in the era of molecular oncology. Nature. 2008;452:580–589. doi: 10.1038/nature06917. [DOI] [PMC free article] [PubMed] [Google Scholar]
- 33.Neidigh JW, Fesinmeyer RM, Prickett KS, Andersen NH. Exendin-4 and glucagon-like-peptide-1: NMR structural comparisons in the solution and micelle-associated states. Biochemistry. 2001;40:13188–13200. doi: 10.1021/bi010902s. [DOI] [PubMed] [Google Scholar]