

Abstract
A new pneumatic tactile stimulator, called the TAC-Cell, was developed in our laboratory to non-invasively deliver patterned cutaneous stimulation to the face and hand in order to study the neuromagnetic response adaptation patterns within the primary somatosensory cortex (S1) in young adult humans. Individual TAC-Cells were positioned on the glabrous surface of the right hand, and midline of the upper and lower lip vermilion. A 151-channel magnetoencephalography (MEG) scanner was used to record the cortical response to a novel tactile stimulus which consisted of a repeating 6-pulse train delivered at three different frequencies through the active membrane surface of the TAC-Cell. The evoked activity in S1 (contralateral for hand stimulation, and bilateral for lip stimulation) was characterized from the best-fit dipoles of the earliest prominent response component. The S1 responses manifested significant modulation and adaptation as a function of the frequency of the punctate pneumatic stimulus trains and stimulus site (glabrous lip versus glabrous hand).
1. Introduction
Adaptation is a dynamic process reflected by a decrease in neuronal sensitivity due to repeated sensory stimulation, which can span a wide range of temporal scales ranging from milliseconds to lifetime of an organism. Attenuation of sensory responses due to adaptation is a common mechanism in sensory systems (visual, auditory, olfactory and somatosensory), which is stimulus specific (since it depends on factors like stimulus strength and frequency), and generally more pronounced at cortical rather than subcortical levels (Chung et al., 2002). Since sensory systems have a distinct number of outputs to represent a wide range of environmental stimuli, adaptation is considered essential to dynamically reassign the limited set of outputs to encode varying ranges of stimuli.
Adaptation and subsequent recovery depends on the time scale of stimulation. Brief stimulation results in rapid recovery (Bonds, 1991; Müller et al., 1999) whereas prolonged stimulation results in slower and more lasting forms of adaptation (Greenlee et al., 1991). In general, short-term adaptation leads to a rapid decay in the system response within the first few hundred milliseconds of stimulation (Chung et al., 2002; Müller et al., 1999; Nelson, 1991), and this response is substantially lower in amplitude than the activity observed at stimulus onset. Synaptic mechanisms underlying short-term adaptation depend on rapid neurotransmission processes like AMPA and NMDA receptor mediated excitatory neurotransmission (Finlayson & Cynader, 1995; Chance et al., 1998), and GABAA receptor mediated inhibitory transmission (Dealy & Tolhurst, 1974). Long-term adaptation occurs as an outcome of continuous stimulation over a relatively long period of time (minutes, hours, or days) leading to plasticity and substantial changes in the network connectivity. These alterations are a product of changes in synaptic efficacy and axonal sprouting.
Rapid modulation of the input and/or output at the auditory, visual, somatosensory or motor cortices due to short-term adaptation is essential in order to prevent damage due to unpleasant and adverse stimuli. Furthermore, if a lesion due to injury or stroke affects the sensory pathways essential for short-term adaptation, it may alter the input at the somatosensory cortex (Wandell & Smirnakis, 2009). As a result, this may affect the input resistance of cell membranes of neurons in the somatosensory cortex, inducing changes in the excitability of the connections between the somatosensory and motor cortices. These modifications in excitability would lead to erroneous modulation of the gain of the motor cortex output leading to muscle fatigue, spasticity, and stiffness (Wandell & Smirnakis, 2009).
Most of the knowledge about adaptation to repeated tactile stimuli in humans comes from studies using electrical stimulation of the upper limb. Comparatively, less information is known about the trigeminal somatosensory pathway. Orofacial muscles involved in the motor control of speech, suck, lick and swallow are distinct in morphology and structure when compared to most limb muscles (Chu, Barlow, Kieweg, Lee, 2010). Histochemical and morphological analyses revealed an apparent lack of muscle spindle receptors and Golgi tendon organs (Stal et al., 1987, 1990; Connor et al., 1998). Instead, a pseudo-Ruffini slowly adapting (SA) (Nordin et al., 1989) mechanoreceptor type may serve some of the functionality to encode facial proprioception (Barlow, 1987, 1997). Some jaw closing and tongue muscles have muscle spindles but differ in their morphology and composition when compared to limb muscles. Mechanoreceptors present in the human face also differ in type and distribution when compared to those present in the hand. For example, the classic Pacinian response present in the glabrous hand to vibratory input at 250 Hz is absent in hairy and glabrous perioral skin due to an absence of this rapid adapting (RA) mechanoreceptor. Fast adapting units are very common in both the hairy and glabrous skin of the hand but less prevalent in the face (Johansson et al., 1988; Nordin et al., 1989).
The delivery of electrical currents through the skin to activate sensory nerve terminals represents an unnatural form of stimulation, and may bypass peripheral mechanoreceptors while activating fibers from deep and superficial receptors (Willis & Coggeshall, 1991). This approach to stimulation potentially results in an altered pattern of afferent recruitment due to differences in the electrical impedance of nerve fibers based on spectra, and collateral activation of efferent nerve fibers proximal to the stimulus site. Moreover, if biomagnetic techniques such as MEG are used to study the cortical response adaptation, electrical stimulation presents a source of interference in the neuromagnetic recordings. Piezoelectric transducers have an excellent frequency response but limited displacement amplitudes, and require large source currents to operate the piezoelectric crystal. Proximity of these transducers to the MEG sensor array produces substantial electrical interference. Disk vibrators (Kawahira et al., 2004; Shirahashi et al., 2007) operate at a single frequency and are incompatible with MRI and MEG due to multiple noise sources (electric, magnetic, acoustic). Recently, pneumatic manifolds were used to generate tactile stimuli using air-puffs (Huang et al., 2007) and Von Frey filaments (Dresel et al., 2008) in the MRI scanner. However, the time required to instrument the participant can limit protocol application, and the movement of face or limbs during a stimulation session may alter the site of stimulation.
In this study we aim to use the relatively high temporal resolution of the MEG technique (milliseconds) to compare and characterize the short-term adaptation patterns of the human hand and lip S1 in response to trains of synthesized pneumatic cutaneous stimuli. The spatial resolution of MEG has proved sufficient to map the S1 representation of the human body including the lips, tongue, fingers, and hand (Nakamura et al., 1998). Although previous studies have shown that a vibrotactile adaptation mechanism exists in both hand (Hollins et al., 1990) and face (Hollins et al., 1991), little is known about the short-term adaptation mechanisms of either hand or face S1 to repeated punctate mechanical stimuli in humans. The stimuli in our study are delivered using a new MRI/MEG compatible tactile stimulator designed and developed in our laboratory designated the TAC-Cell©. We hypothesized that repetitive cutaneous stimuli would result in frequency-dependent patterns of short-term adaptation manifested in the evoked neuromagnetic S1 responses. We also hypothesized that there would be a significant difference between spatiotemporal characteristics of the adaptation patterns of the face and hand because of fundamental differences in mechanoreceptor innervations and function in motor behavior.
2. Results
For the digits stimulation, the earliest prominent response component that was consistently observed across subjects peaked at 74.3 ± 6.7 ms following each cutaneous pulse. For the lips stimulation the earliest component peaked at 50.3 ± 5.8 ms across subjects. For both stimulation sites, these early components were followed by several late components with different temporal morphologies and spatial patterns of magnetic field.
For the earliest components of the response, the distribution of the evoked magnetic field across the sensor array was consistent with the presence of a source in the contralateral S1 for the hand stimulation condition, and bilateral S1 for the lips stimulation. This was confirmed by results of the source reconstruction, exemplified in figure 1. Dipolar sources were consistently localized within the hand representation of the left S1 (hand stimulation), and bilaterally within the face representation of the S1 (lip stimulation).
Figure 1.

Source reconstruction results are exemplified for one subject. Dipoles are localized bilaterally in response to lip stimulation (left upper panels), and contralaterally for right hand stimulation (left lower panels). Dipoles locations and orientations are shown in orthogonal (axial and coronal) MRI slices. The S1 dipole strength across time is illustrated for each stimulation rate in the panels on the right.
The mean dipole locations for the lip and hand S1 responses are reported in table 1. A comparison between the dipole locations in the left hemisphere for lip versus hand stimulation using a one-way ANOVA on each of the three Cartesian coordinates showed a significantly different S1 source along all three directions: lateral (p < 0.001), anterior (p = 0.008), and inferior (p < 0.001). The results are in agreement with the somatotopic organization of the primary somatosensory cortex (Penfield and Rasmussen, 1968), with the lip S1 represented more towards the base of the postcentral gyrus, i.e. more laterally, anteriorly, and inferiorly than the hand S1.
Table 1.
Dipole locations for lip (contralateral and ipsilateral hemispheres), and hand (contralateral hemisphere) S1 associated with 2, 4, and, 8 Hz TAC-Cell stimulation. Mean ± standard deviations across subjects are expressed in a Cartesian system of coordinates based on external landmarks on the scalp, with the x-axis going from left to right through pre-auricular points, y-axis from the back of the head to nasion, and z-axis pointing towards the vertex.
| Right Hand stimulation | Lip stimulation | ||||||||
|---|---|---|---|---|---|---|---|---|---|
| Left hemisphere | Left hemisphere | Right hemisphere | |||||||
| x (mm) | y (mm) | z (mm) | x (mm) | y (mm) | z (mm) | x (mm) | y (mm) | z (mm) | |
| Mean±SD | −48.2±6.9 | 10.8±8.1 | 93.8±6.8 | −58.2±5.0 | 14.5±7.9 | 76.3±4.8 | 57.2±5.6 | 18.4±9.6 | 76.6±8.4 |
The peak dipole strength was used to quantify the magnitude of cortical response as a function of stimulation rate and serial position within the trains. Latencies of the S1 responses were determined from the peak dipole strength and corrected for mechanical response time (MRT). A three-way ANOVA of dipole strength peaks, with factors of stimulation site, stimulation frequency, and pulse index within trains of stimuli, showed statistically significant main effects of frequency (p < 0.001) and pulse index (p < 0.001). The interactions between the stimulation site and frequency (p = 0.016), and frequency and pulse index (p = 0.003) were also statistically significant.
The peak dipole strength of the S1 response (figure 2) shows a progressive attenuation with the serial position of the stimuli in the train. The sharp attenuation of the neuromagnetic response that was apparent for the 8 Hz stimulation condition prevented us from analyzing the latencies beyond the 3rd dipole strength peak for both lip and hand stimulation conditions. The magnitude of the S1 adaptation was slightly greater for the lip when compared to the hand among the 3 different test frequencies and this may be explained in part by differences in mechanoreceptor representation and mechanisms of central integration along lemniscal and thalamocortical systems.
Figure 2.

Comparison of primary somatosensory cortex (S1) peak dipole strengths at 2, 4, and 8 Hz for lip and hand stimulation.
A three-way ANOVA of the S1 peak latencies, with factors of stimulation site, stimulation frequency, and pulse index of the stimulus in the trains, showed that the main factor of stimulation site (p < 0.001) was statistically significant. None of the interactions were significant in this case. This reveals that TAC-Cell evoked S1 response peak latencies were significantly different between the hand and lip at all 3 stimulation frequencies (figure 3), which is consistent with a shorter conduction time of the trigeminal pathway.
Figure 3.

Comparison of S1 peak dipole strength latency for lip and hand stimulation at 2, 4, and 8 Hz.
3. Discussion
Mechanical stimulation of the facial region in the MEG environment presents technical challenges due to electrical interference produced by devices like piezoelectric crystals, linear motors and actuators, or the added challenge of signal spread, calibration and tedious setup associated with air-puff stimuli. Air-driven membrane stimulators (Karageorgiou et al., 2008) have been used to stimulate finger tips but the amplitude or rise time of the stimuli was not defined. In addition, they have limited scope and cannot be used to stimulate all body parts. The MEG/MRI compatible TAC-Cell developed in our laboratory and reported in this study was highly effective in activating the lip and hand S1 responses in healthy adult participants. The TAC-Cell represents a natural cutaneous punctate stimulus. Due to its simple design and non-invasive nature, positioning of individual TAC-Cells on the skin of any body part can be achieved within a few seconds using ordinary double-adhesive tape collars.
This study reveals that repeated TAC-Cell stimulation of either the lip or hand with the same patterned stimulus was also effective to induce short-term adaptation of S1. Difference in short-term adaptation patterns of the hand and lip may be a function of the difference in mechanoreceptor typing in cutaneous and subcutaneous regions and also due to the difference in facial and limbic musculature. The magnitude of attenuation of S1 response depends on the stimulus frequency and pulse index with attenuation being most prominent at 8 Hz for both hand and lip stimulation. The significant difference between the latencies of peak dipole strengths of hand and lip S1 is attributable to the difference in axon length and distance from the mechanosensory nerve terminals in the lip and hand to their central targets in S1.
The TAC-Cell could be used for basic neurologic assessment of brain function using fMRI and MEG scanning technologies, specifically to map the integrity of trigemino-thalamo-cortical (face) and dorsal column-medial lemniscal-thalamo-cortical (hand-forelimb/foot-hindlimb) somatosensory pathways in human brain. Comparison of the spatiotemporal adaptation patterns between normal healthy adults and different clinical populations such as children with autism, adults with a traumatic brain injury or a cerebrovascular stroke may shed new insight on fundamental sensory processes. For example, repeated tactile stimulation in autistic children resulted in hypersensitivity (Blakemore et al., 2006), and an enhanced but slower adaptation response (Barnek et al., 1994, 1997). A suppressed GABAergic inhibition mechanism (Hussman, 2001) due to the reduction in the proteins utilized for synthesizing GABA (Fatemi et al., 2002) is believed to be responsible for these abnormal response characteristics. Another fascinating approach that merits further study is the development and application of patterned somatosensory stimulation for motor rehabilitation. Sustained somatosensory stimulation can increase motor cortex excitability (Luft et al., 2002) and has implications in motor learning and recovery of function after a cortical lesion (Conforto et al., 2002; Kaelin-Lang et al., 2002). Thus, in addition to functional mapping of somatosensory pathways, the TAC-Cell may find application as a new neurotherapeutic intervention device for the rehabilitation of adult and pediatric movement disorders.
4. Experimental procedures
4.1. Participants
Ten healthy females (Mean age = 24.8 years [SD = 2.9]) with no history of neurological disease participated in this study. Participants signed a consent form approved by the Institutional Review board (IRB) of the Kansas University Medical Center (KUMC) after a detailed explanation of the study.
4.2. TAC-Cell and Stimulation Sites
The TAC-Cell is a custom, small-bore pneumatic actuator based on a 5-ml round vial with a snap-type cap (Cole-Parmer, Part no. R-08936-00). The polyethylene cap was machined to create an internal lumen with a diameter of 19.3 mm. A 0.005″ silicone membrane (AAA-ACME Rubber Company) was held securely between the vial rim and modified snap-type cap (figure 4). When pneumatically charged, the active silicone membrane surface of the TAC-Cell generated a peak displacement of 4.25 mm with a 27 ms rise/fall time (based on 10% to 90% slope intercepts).
Figure 4.

TAC-Cell showing polyethylene cylinder, 0.005″ thick silicone membrane, and Luer tube fitting which links the cell to the servo-controlled pneumatic pump.
A custom non-commutated servo-motor (H2W Technologies, Inc., NCM 08-25-100-2LB) coupled to a custom Airpel® glass cylinder (Airpot Corporation, 2K4444P series) operating under position feedback (Biocommunication Electronics, LLC, model 511 servo-controller) and computer control was used to drive the TAC-Cell with pneumatic pressure pulses. The computer was equipped with a 16-bit multifunction card (PCI-6052E, National Instruments). The stimulus control signals were custom programmed with LabVIEW® software (version 8.0, National Instruments) in our laboratory. These signals served as input to the servo controller, and were also used to trigger data acquisition by the MEG scanner (figure 5). This hardware configuration achieved synchronization between stimulus generation and MEG data acquisition. A 15-foot silicone tube (0.125″ ID, 0.250″ OD, 0.063″ wall thickness) was used to conduct the pneumatic stimulus pulse from the servo motor to the TAC-Cell placed on the participant in the MEG scanner. Mechanical response time (MRT), defined as the delay between leading edge of the pulse train voltage waveform and the corresponding TAC-stimulus displacement onset, was constant at 17 ms for all stimulus rates (figure 6). The reported peak dipole strength latency values reflect correction for the MRT of the TAC-Cell.
Figure 5.

Schematic diagram of the TAC-Cell stimulus control system.
Figure 6.

A sample stimulus voltage pulse and the corresponding TAC-Cell displacement response. The mechanical response time (MRT) of the TAC-Cell is 17 ms.
As shown in figure 7, double-adhesive tape collars were used to secure separate TAC-Cells at two skin locations, including the glabrous surface of the right hand (index/middle finger), and midline of the upper and lower lip vermilion. Placement at each skin site was completed within 1 minute.
Figure 7.
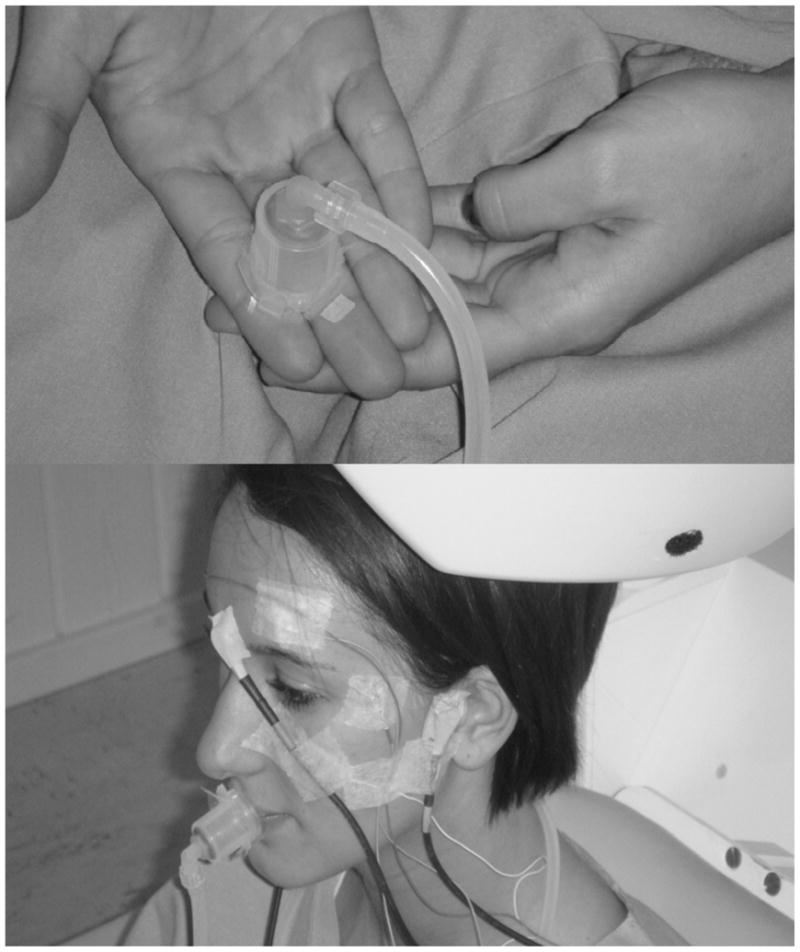
TAC-Cell is secured on the glabrous surface of the right hand (index and middle digits) and midline of the upper and lower lip vermilion using double-adhesive tape prior to the MEG recording session.
4.3. Stimulus paradigm
Pneumatic servo control was used to produce pulse trains [intertrain interval of 5 s, 125 reps/train rate]. Each pulse train consisted of 6-monophasic pulses [50-ms pulse width] (figure 8). Short-term adaptation of the cortical neuromagnetic response to TAC-Cell patterned input was assessed using a randomized block design of three pulse train rates, including 2, 4, and 8 Hz at each skin site. The 2, 4, and 8 Hz stimulus blocks lasted for approximately 16, 14, and 12 minutes respectively. The order of stimulation frequency and stimulation site condition was randomized among subjects.
Figure 8.

Patterned stimulus trains used as input to the TAC-Cell pneumatic servo controller for MEG sessions. 125 pulse trains at 2, 4, and 8 Hz were applied in separate runs to the glabrous skin of the hand and lower face. Each pulse train consists of six 50 ms pulses regardless of train rate.
4.4. Data Acquisition
A whole-head MEG system (CTF Omega) equipped with 151 axial-gradiometer sensors was used to record the cortical response to the TAC-Cell inputs. Localizing coils were placed at 3 positions including the nasion, and left and right preauricular points to determine the head position with respect to the sensor coil. Two bipolar electrodes were used to record electrooculograms (EOG), which were used to identify trials affected by ocular movement artifacts and eye-blinks. Registration landmarks were placed at the same 3 positions used for positioning the localizing coils. Following the MEG recording session, TAC-Cells were removed from the skin sites, and participants were immediately placed inside a MRI scanner in an adjacent suite to image their brain anatomy.
4.5. Pre-processing of MEG data
The MEG data was digitally bandpass filtered between 1.5 Hz and 50 Hz using a bidirectional 4th order Butterworth filter. Trials corresponding to 1s before and after the pulse train stimulus were visually inspected for artifacts and those containing movement or eye-blink artifacts were discarded. The remaining trials for each experimental condition were averaged and the DC was offset using the pre-stimulus period as baseline. Not less than 90 trials per subject in each experimental condition were used in averaging.
4.6. Source Reconstruction
CURRY™ (COMPUMEDICS NeuroScan) is a specialized signal processing software used to analyze the data obtained from MEG recordings. CURRY™ can also be used to co-register anatomical MRI images with MEG data to map the biomagnetic dipole sources. Thus, source reconstruction was performed in CURRY™ using a spherically symmetric volume conductor model fitted to each individual subject skull segmented from the MRI data. The source space was defined as a regular grid of points throughout the brain volume (averaged distance between points was 4 mm). Current density analysis was performed using Minimum Norm Least Squares (MNLS) applied for the first responses in the train (i.e. characterized by the best Signal-to-Noise Ratio (SNR)) to identify the spatial peaks of activity that correspond to the S1 activity. Location constrained dipole analysis (with dipole positions set at the spatial maximum retrieved by MNLS) was subsequently used to estimate the dipole direction and peak strength (μAmm = microampere-millimeter) for the S1 activity following each pulse in the trains.
Peak dipole peak strengths and latencies were compared for significant differences between stimulation site (lip and hand), frequency (2, 4, and 8 Hz), and pulse index within the trains using a three-way ANOVA. Differences in the corresponding dipole locations in the left hemisphere for lip and hand stimulation, respectively, were tested for statistical significance using a one-way ANOVA. SPSS software (version 17, SPSS Inc.) was used for statistical analysis.
Acknowledgments
We thank the anonymous reviewers for commenting on an earlier version of this manuscript. This work was supported by grants NIH R01 DC003311 (SM Barlow), NIH P30 HD02528, NIH P30 DC005803, and the Sutherland Foundation. The Hoglund Brain Imaging Center at Kansas University Medical Center is supported by a generous gift from Forrest and Sally Hoglund.
Footnotes
Publisher's Disclaimer: This is a PDF file of an unedited manuscript that has been accepted for publication. As a service to our customers we are providing this early version of the manuscript. The manuscript will undergo copyediting, typesetting, and review of the resulting proof before it is published in its final citable form. Please note that during the production process errors may be discovered which could affect the content, and all legal disclaimers that apply to the journal pertain.
References
- Allison JD, Casagrande VA, DeBruyn EJ, Bonds AB. Contrast adaptation in striate cortical neurons of the nocturnal primate bush baby (Galago crassicaudatus) Vis Neurosci. 1993;10:1129–1139. doi: 10.1017/s0952523800010233. [DOI] [PubMed] [Google Scholar]
- Baranek GT, Berkson G. Tactile defensiveness in children with developmental disabilities: Responsiveness and habituation. J Autism and Devel Dis. 1994;24:457–471. doi: 10.1007/BF02172128. [DOI] [PubMed] [Google Scholar]
- Baranek GT, Foster LG, Berkson G. Tactile defensiveness and stereotyped behaviors. The American Journal of Occupational Therapy. 1997;51:91–95. doi: 10.5014/ajot.51.2.91. [DOI] [PubMed] [Google Scholar]
- Barlow SM. Mechanical frequency detection thresholds in the human face. Exp Neurol. 1987;96:253–61. doi: 10.1016/0014-4886(87)90044-6. [DOI] [PubMed] [Google Scholar]
- Blakemore SJ, Tavassoli T, Calo S, Thomas RM, Catmur CU, Frith, Haggard P. Tactile sensitivity in Asperger syndrome. Brain Cog. 2006;61:5–13. doi: 10.1016/j.bandc.2005.12.013. [DOI] [PubMed] [Google Scholar]
- Bonds AB. Temporal dynamics of contrast gain in single cells of cat striate cortex. Vis Neurosci. 1991;6:239–255. doi: 10.1017/s0952523800006258. [DOI] [PubMed] [Google Scholar]
- Chance FS, Nelson SB, Abbott LF. Synaptic depression and the temporal response characteristics of V1 Cells. J Neurosci. 1998;18:4785–4799. doi: 10.1523/JNEUROSCI.18-12-04785.1998. [DOI] [PMC free article] [PubMed] [Google Scholar]
- Chu S-Y, Barlow SM, Kieweg D, Lee J. OroSTIFF: Face-referenced measurement of perioral stiffness in health and disease. J Biomechanics. 2009 doi: 10.1016/j.jbiomech.2010.01.037. [DOI] [PMC free article] [PubMed] [Google Scholar]
- Chung S, Li X, Nelson SB. Short-term depression at thalamocortical synapses contributes to rapid adaptation of cortical sensory responses in vivo. Neuron. 2002;34:437–446. doi: 10.1016/s0896-6273(02)00659-1. [DOI] [PubMed] [Google Scholar]
- Conforto AB, Kaelin-Lang A, Cohen LG. Increase in hand muscle strength of stroke patients after somatosensory stimulation. Ann Neurol. 2002;51:122–125. doi: 10.1002/ana.10070. [DOI] [PubMed] [Google Scholar]
- Connor NP, Abbs JH. Orofacial proprioception: Analyses of cutaneous mechanoreceptor population properties using artificial neural networks. J Commun Disord. 1998;31(6):535–542. doi: 10.1016/s0021-9924(98)00024-0. [DOI] [PubMed] [Google Scholar]
- Dealy RS, Tolhurst DJ. Is spatial adaptation an aftereffect of prolonged inhibition? J Physiol. 1974;241:261–270. doi: 10.1113/jphysiol.1974.sp010652. [DOI] [PMC free article] [PubMed] [Google Scholar]
- Dresel C, Parzinger A, Rimpau C, Zimmer C, Ceballos-Baumann AO, Haslinger B. A new device for tactile stimulation during fMRI. NeuroImage. 2008;39(3):1094–103. doi: 10.1016/j.neuroimage.2007.09.033. [DOI] [PubMed] [Google Scholar]
- Fatemi SH, Halt AR, Stary JM, Kanodia R, Schulz SC, Realmuto GR. Glutamic acid decarboxylase 65 and 67 kDa proteins are reduced in autistic parietal and cerebellar cortices, Biol. Psychiatry. 2002;52:805–810. doi: 10.1016/s0006-3223(02)01430-0. [DOI] [PubMed] [Google Scholar]
- Finlayson PG, Cynader MS. Synaptic depression in visual cortex tissue slices: an in vitro model for cortical neuron adaptation. Exp Brain Res. 1995;106:145–155. doi: 10.1007/BF00241364. [DOI] [PubMed] [Google Scholar]
- Greenlee MW, Georgeson MW, Magnussen S, Harris JP. The time course of adaptation to spatial contrast. Vision Res. 1991;31:223–236. doi: 10.1016/0042-6989(91)90113-j. [DOI] [PubMed] [Google Scholar]
- Hollins M, Delemos KA, Goble AK. Vibrotactile adaptation on the face. Perception and Psychophysics. 1991;49:21–30. doi: 10.3758/bf03211612. [DOI] [PubMed] [Google Scholar]
- Hollins M, Goble AK, Whitsel BL, Tommerdahl M. Time course and action spectrum of vibrotactile adaptation. Somatosensory & Motor Research. 1990;7:205–221. doi: 10.3109/08990229009144707. [DOI] [PubMed] [Google Scholar]
- Huang RS, Sereno MI. Dodecapus: an MR-compatible system for somatosensory stimulation. NeuroImage. 2007;34:1060–1073. doi: 10.1016/j.neuroimage.2006.10.024. [DOI] [PubMed] [Google Scholar]
- Hussman JP. Suppressed GABAergic inhibition as a common factor in suspected etiologies of autism. J Autism Dev Disord. 2001;31:247–248. doi: 10.1023/a:1010715619091. [DOI] [PubMed] [Google Scholar]
- Johansson RS, Trulsson M, Olsson KA, Westberg KG. Mechanoreceptor activity from the human face and oral mucosa. Experimental Brain Research. 1988;72:204–208. doi: 10.1007/BF00248518. [DOI] [PubMed] [Google Scholar]
- Karageorgiou E, Koutlas IG, Alonso AA, Leuthold AC, Lewis SM, Georgopoulos AP. Cortical processing of tactile stimuli applied in quick succession across the fingertips: temporal evolution of dipole sources revealed by magnetoencephalography. Exp Brain Res. 2008;189:311–21. doi: 10.1007/s00221-008-1425-6. [DOI] [PubMed] [Google Scholar]
- Kawahira K, Higashihara K, Matsumoto S, Shimodozono M, Etoh S, Tanaka N, Sueyoshi Y. New functional vibratory stimulation device for extremities in patients with stroke. Int J Rehabil Res. 2004;27:335–337. doi: 10.1097/00004356-200412000-00015. [DOI] [PubMed] [Google Scholar]
- Luft AR, Kaelin-Lang A, Hauser TK, Buitrago MM, Thakor NV, Hanley DF, Cohen LG. Modulation of rodent cortical motor excitability by somatosensory input. Exp Brain Res. 2002;142:562–569. doi: 10.1007/s00221-001-0952-1. [DOI] [PubMed] [Google Scholar]
- Müller JR, Metha AB, Krauskopf J, Lennie P. Rapid adaptation in visual cortex to the structure of images. Science. 1999;285:1405–1408. doi: 10.1126/science.285.5432.1405. [DOI] [PubMed] [Google Scholar]
- Nakamura A, Yamada T, Goto A, Kato T, Ito K, Abe Y, Kachi T, Kakig R. Somatosensory homunculus as drawn by MEG. NeuroImage. 1998;7:377–386. doi: 10.1006/nimg.1998.0332. [DOI] [PubMed] [Google Scholar]
- Nelson SB. Temporal interactions in the cat visual system. I. Orientationselective suppression in the visual cortex. J Neurosci. 1991;11:344–356. doi: 10.1523/JNEUROSCI.11-02-00344.1991. [DOI] [PMC free article] [PubMed] [Google Scholar]
- Nordin M, Hagbarth K-E. Mechanoreceptive units in the human infra-orbital nerve. Acta Physiologica Scandinavica. 1989;135:149–161. doi: 10.1111/j.1748-1716.1989.tb08562.x. [DOI] [PubMed] [Google Scholar]
- Penfield W, Rasmussen T. The cerebral cortex of man. Hafner Publishing Co; New York: 1968. [Google Scholar]
- Puccini G, Sanchez-Vives M, Compte A. Integrated mechanisms of anticipation and rate-of-change computations in cortical circuits. PLoS Comput Biol. 2007;3:e82. doi: 10.1371/journal.pcbi.0030082. [DOI] [PMC free article] [PubMed] [Google Scholar]
- Ringo JL. Stimulus specific adaptation in inferior temporal and medial temporal cortex of the monkey. Behav Brain Res. 1996;76:191–197. doi: 10.1016/0166-4328(95)00197-2. [DOI] [PubMed] [Google Scholar]
- Shirahashi I, Matsumoto S, Shimodozono M, Etoh S, Kawahira K. Functional vibratory stimulation on the hand facilitates voluntary movements of hemiplegic upper limb in a patient with stroke. Int J Rehabil Res. 2007;30:227–230. doi: 10.1097/MRR.0b013e32829fa4b6. [DOI] [PubMed] [Google Scholar]
- Stal P, Eriksson PO, Eriksson A, Thornell LE. Enzyme-histochemical differences in fibre-type between the human major and minor zygomatic and the first dorsal interosseus muscles. Archives of Oral Biol. 1987;32:833–41. doi: 10.1016/0003-9969(87)90011-2. [DOI] [PubMed] [Google Scholar]
- Stal P, Eriksson PO, Eriksson A, Thornell LE. Enzyme-histochemical and morphological characteristics of muscle fibre types in the human buccinator and orbicularis oris. Archives of Oral Biol. 1990;35:449–458. doi: 10.1016/0003-9969(90)90208-r. [DOI] [PubMed] [Google Scholar]
- Ulanovsky N, Las L, Nelken I. Processing of low-probability sounds by cortical neurons. Nat Neurosci. 2003;6:391–398. doi: 10.1038/nn1032. [DOI] [PubMed] [Google Scholar]
- Wandell BA, Smirnakis SM. Plasticity and stability of visual field maps in adult primary visual cortex. Nat Rev Neurosci. 2009;10:873–884. doi: 10.1038/nrn2741. [DOI] [PMC free article] [PubMed] [Google Scholar]
- Willis WD, Jr, Coggeshall RE. Sensory Mechanisms of the Spinal Cord. Plenum; New York: 1991. [Google Scholar]