Abstract
Recent empirical studies of taxa including humans, fish, and birds have shown elevated rates of molecular evolution between species that diverged recently. Using the Moran model, we calculate expected divergence as a function of time. Our findings suggest that the observed phenomenon of elevated rates at short timescales is consistent with standard population genetics theory. The apparent acceleration of the molecular clock at short timescales can be explained by segregating polymorphisms present at the time of the ancestral population, both neutral and slightly deleterious, and not newly arising slightly deleterious mutations as has been previously hypothesized. Our work also suggests that the duration of the rate elevation depends on the effective population size, providing a method to correct time estimates of recent divergence events. Our model concords with estimates of divergence obtained from African cichlid fish and humans. As an additional application of our model, we calculate that Ka/Ks is elevated within a population before decaying slowly to its long-term value. Similar to the molecular clock, the duration and magnitude of Ka/Ks elevation depend on the effective population size. Unlike the molecular clock, however, Ka/Ks elevation is caused by newly arising slightly deleterious mutations. This elevation, although not as severe in magnitude as had been previously predicted in models neglecting ancestral polymorphism, persists slightly longer.
Keywords: theoretical populations genetics, Ka/Ks, Moran model, distribution of fitness effects, divergence date
INTRODUCTION
The assumption of a molecular clock (Zuckerkandl and Pauling 1962) is an important tool in dating speciation events. Many dating methods allow for clock rate heterogeneity among branches in the tree (Sanderson 1997, Sanderson 2002, Yoder and Yang 2000, Drummond and Rambaut 2007), however, no current methods allow the rate on a given branch to be dependent on the age of the branch.
Evidence suggests that the observed rate of divergence between branches may be higher than expected when the divergence time between those branches is short. This acceleration of the molecular clock at short timescales was first observed by Wayne et al. (1991), who noted that substitution rates decreased linearly with time in a study of carnivores and primates. Garcia-Moreno (2004) noted a similar, but exponential rather than linear, trend in birds.
Using mitochondrial DNA (mtDNA) taken from human pedigrees, several investigators have estimated divergence rates that are many times greater than the accepted rate estimates for animal species (Ho et al. 2005). In contrast to the accepted rate of 0.02 substitutions/site/Myr for protein-coding mtDNA in mammals (Brown et al. 1979, Randi 1996, Fleischer et al. 1998) and birds (Shields and Wilson 1987), these studies found rates between 0.32 and 2.5 substitutions/site/Myr (Parsons et al. 1997, Sigurdardóttir et al. 2000, Howell et al. 2003). In addition, in a study using well-preserved Antarctic subfossil bones, Lambert et al. (2002) estimated a divergence rate of 0.95 substitutions/site/Myr in Adélie penguins.
Analyzing the above data, Ho et al. (2005) concluded that the divergence rate between populations decays exponentially from an elevated short-term mutation rate to the long-term substitution rate. This view has been challenged (Emerson 2007, Weir and Schluter 2008), even as new evidence to support it emerges. Three recent studies found that mtDNA rate calibrations in freshwater fish are consistent with the findings of Ho et al. (2005; Genner et al. 2007, Waters et al. 2007, Burridge et al. 2008). However, Genner et al. (2007) found that divergence rates decay faster than exponentially. In a further study, Ho et al. (2007) found that rates of divergence obtained from ancient bison sequences confirm that the phenomenon of elevated rates exists without support for an exponentially decaying rate curve.
Evidence for elevated rates of molecular divergence on short timescales has therefore been demonstrated in both studies, which use ancient and noncontemporaneous sequence data, for example, Ho et al. (2007) as well as studies in which two contemporaneous sequences are compared with a single internal node calibration (e.g., Genner et al. 2007, Waters et al. 2007, Burridge et al. 2008). In the former case, noncontemporaneous sequences may be incorporated into a maximum likelihood framework hence negating the gene tree versus species tree problem that we will describe below (Rambaut 2000, Drummond and Rambaut 2007). That elevated divergence rates have been observed in this case nonetheless is an important point, but one that we will not investigate here. We will focus on the latter situation where elevated divergence rates are observed between two contemporaneous sequences with a single internal node calibration.
In this case, the phenomenon may be explained by the fact that if sufficient time has not passed, a large amount of sampled genetic divergence between populations may be due to polymorphism that was present at the time the two populations diverged. The molecular clock equates mutations with fixation, approximating the process as instantaneous to get linear accumulation of change over time. With polymorphism present at the time of population divergence, sampling will overestimate the number of fixations. As an extreme example, consider sampling from two individuals of the same population (time since population divergence equals zero). All observed differences will be due to intrapopulation polymorphism that was present since the time of gene divergence. However, following a strict molecular clock, the expected divergence is zero. Overestimation due to polymorphism will have a significant impact on estimates of the rate of the molecular clock only for an initial period of time, however, because the differences observed due to these sites will become a small percentage of total divergence in the long term. The idea that the molecular clock rate will transition from a short-term rate determined by polymorphism to a long-term substitution rate was previously noted by Penny (2005).
This formulation is equivalent to the classic formulation of coalescent theory. Consider a simple model in which all mutations are neutral. Coalescent theory tells us that if we choose two random lineages in the population, their expected coalescent time will have mean equal to two times the effective population size (Durrett 2008). Therefore, when the time of population divergence equals zero, the gene divergence time at a neutral locus will be on average 2Ne generations. Estimates of molecular divergence based on population divergence calibrations will then be overestimates of the actual population divergence time. The importance of distinguishing between the gene tree and species tree has been noted in the literature (Felsenstein 2004).
Another possible contributor to the phenomenon of elevated rates is the existence of slightly deleterious mutations (Ho et al. 2005). In the short term, genotypes that are only mildly deleterious will behave like neutral genotypes, with their frequency determined by drift. However, in the long term, they are unlikely to become fixed (Kimura 1983). Therefore, although almost no slightly deleterious mutations are destined for fixation, a population will take a significant amount of time to purge them. Like polymorphism, this effect will be disproportionally large in the short term.
In order to assess the relative importance of the above explanations to the overall phenomenon of elevated rates, this paper calculates the behavior of the molecular clock on short timescales. We calculate the expected number of genetic differences between two samples as a function of time since population divergence, considering both polymorphism present at the time of population divergence as well as mutations that arise after the populations have become distinct.
MATERIALS AND METHODS
Consider two closely related extant haploid populations that have diverged recently from a common ancestor. The results for diploids are equivalent if the coefficient of dominance h is equal to 0.5 and are unlikely to be substantially different for other values of h. Consider one individual from each population. We now compute the expected number of differences between the two sampled individuals as a function of population divergence time.
We assume a fixed population size N that immediately duplicates into two populations each of size N. We assume the infinite sites approximation and that sites evolve independently. The assumption of independently evolving sites is equivalent to assuming free recombination between all sites and is made in order to take advantage of known closed form expressions for quantities of interest. These include expressions for the probability of fixation of a new mutation, and the expected time that a mutant allele is segregating in a population before fixation or extinction. Of course, molecular clock calculations are normally made by sequencing a single gene where there is either zero (mitochondria) or low (nuclear) recombination. Our method calculates the expected number of differences at a single site (one or zero) and we then sum over all sites to calculate the total divergence. It seems likely that linkage will affect our results in two ways. First, linkage imposes a complex correlation structure between sites. At any given time, this will likely increase the variance of the total divergence. Because we focus on calculating mean divergence, this effect will be of minor importance here. Second, if it is assumed as we do in many cases, which all new mutations are deleterious, linkage will play the role of dragging down the total number of fixations. Hence, a population of size N behaves like a population of independent sites with size Ne = Ne − u/2sh (Durrett 2008), where u is the mutation rate at the linked loci, s is the selection coefficient, and h is the coefficient of dominance in this case 0.5. This should not affect the general shape of the divergence curve, but it will drag down our estimates of Ne.
The allele frequency at each site is modeled using the Moran model with selection, and the number of individuals that possess the derived allele at time t is given by Xt. Xt is a Markov chain, that is, the distribution of Xs only depends on the value of Xs − 1. Because Xt models the number of individuals out of a population of size N that contain the derived allele, Xt takes values in the state space {0,1,…,N − 1,N}. We define the matrix T such that T(i,j) = P(Xt = j|Xt − 1 = i). This matrix will be of size N + 1 by N + 1 since i and j are between 0 and N. This matrix is known as the transition matrix of the Markov chain. We consider models in which all sites have a single selection coefficient s, as well as sets of sites whose selection coefficients are distributed according to some probability distribution g(s). In this case, the total divergence at each time is calculated by calculating the divergence f(s) for a large number of individual s and then numerically integrating ∫sf(s)g(s)ds.
Let m be the per replication mutation rate. Define τ1 to be the mean time that a new mutation stays in a population before it becomes fixed or disappears. More precisely, τ1 is the expected value of t such that Xt = 0 or Xt = N for the first time, given that X0 = 1. The condition X0 = 1 corresponds to a new mutation arising in one individual at time 0. Define τ1i to be the expected time that the derived allele is present in i individuals before fixation or extinction, given it was originally present in one individual. That is, the average number of times that Xs = i before Xt = 0 or Xt = N. For the Moran model, these quantities can be calculated explicitly (Ewens 2004) (see Appendix).
We consider two sets of sites. First consider sites that were polymorphic at the time of population divergence. The expected number of such polymorphic sites at population divergence time 0 is given by mτ1 because there are on average m new mutations per replication, and each mutation persists in the population for mean time τ1. Of the mτ1 sites at population divergence time 0, the proportion of sites with i individuals is distributed {τ1i/τ1,i = 1,…,N − 1}.
For each site, the probability that the samples will differ at that site at time t generations (with N time steps per generation following the Moran model) after the population split can be calculated as follows. We denote S1 and S2 as the identities of the sampled alleles from populations 1 and 2, respectively, at time t and denote the ancestral allele A and the derived allele D. Then,
 |
(1) |
 |
(2) |
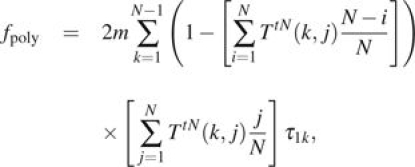
The first equality follows from the law of total probability, and the second equality follows from the conditional independence of S1 and S2. Multiplying by 2 to account for the case when S1 = D and S2 = A gives the total expected divergences for these sites as
 |
(3) |
An analytic expression can be obtained for the probabilities P(S1 = A|X0 = k) and P(S2 = D|X0 = k) (see Appendix).
Now consider mutations that arise after population divergence time t = 0. Mutations arise at rate m per replication along a given branch. We assume a constant mutation rate; hence, their times of origin tm are independent and uniformly distributed. Again use the Moran model and Markov chain Xt to model the number of derived alleles at each new site, and let Y denotes the time of the mutation. Then, the probability of sampling a given derived allele is given by
 |
(4) |
There are on average m new mutations per replication. We sum over all possible tm and multiply by 2 to account for both branches. The total expected divergence in this case is then given by
 |
(5) |
Adding this to the total in the previous case gives the total expected divergence between the two samples as a function of time t in generations
| (6) |
Using “Matlab,” we calculate f(t) as well as the average rate over a branch f(t)/t for any population size N.
RESULTS
Li (1977) proved that, in the neutral case, the expected number of sequence differences as a function of population divergence time is linear with a nonzero intercept. Computationally, we reproduce this result and then go on to calculate the nonlinear behavior of the molecular clock when the selection coefficient s is not equal to zero, as shown in figure 1.
FIG. 1.—
Divergence over time for sites with a single level of selection. The behavior of the molecular clock ranges from approximately linear for sN = − 1 to highly nonlinear for higher selection intensities. The elevated initial slope in these graphs demonstrates the nearly neutral effect. The results shown here are for population sizes N = 100 (solid line), 500 (dashed line), and 1,000 (dot-dashed line).
Each plot has a positive vertical intercept that, through the vector τ1·, depends on s. In each case, the nonzero intercept is due to polymorphism present at the time of population divergence.
The slope of each plot in figure 1 decreases from an initial elevated slope due to the rapid sorting out of standing polymorphism to the eventual long-term evolutionary rate equal to 2π1(s) where π1(s) is the probability of fixation of a new mutation with selection coefficient s. The factor of 2 accounts for fixations on both branches. Hence, as t gets large, the difference f(t) − (2mπ1(s)t + fpoly(0)) converges to zero. Although these figures illustrate the behavior of the molecular clock at sites with a particular level of selection, we want to calculate this function across a set of sites. In order to do so, we must model the distribution of fitness effects.
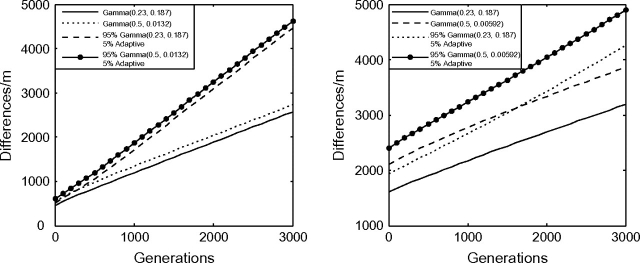
Although some initial progress has been made, the inference of the distribution of fitness effects of newly arising mutations is a largely open problem (Eyre-Walker and Keightley 2007). We examine a particular estimate of a distribution of fitness effects, namely, amino acid changing mutations in humans. Eyre-Walker et al. (2006) estimated that the selection coefficients of such mutations, all deleterious, have negative s values that are gamma distributed with shape parameter λ = 0.23 and mean = 0.043, that is, gamma(0.23, 0.187), where 0.187 is the scale parameter in the standard presentation of the gamma distribution. We also investigated the case λ = 0.5, where a larger proportion of alleles are slightly deleterious. The second distribution is conservative with respect to our eventual conclusions. For λ = 0.5, the scale parameter was calculated so that the long-term fixation rate is equal to that under the distribution gamma(0.23, 0.187) (see fig. 2).
FIG. 2.—
Divergence over time for a distribution of fitness effects. The approximate linearity of the molecular clock demonstrates a very limited role for the nearly neutral effect in the short-term elevation of the rate of molecular evolution. The selection coefficients of new mutations are distributed as stated in the box. The scale parameters of the λ = 0.5 distributions are chosen so that the asymptotic fixation rate is equal to the asymptotic fixation rate under the distribution gamma(0.23, 0.187). For the graphs labeled 5% adaptive, we let 5% of all mutations be adaptive with a selection coefficient that is calibrated so that 50% of all fixation events are adaptive.
We present the theoretical molecular clocks for the above distributions in figure 2 along with distributions for which 50% of all fixation events are adaptive, the maximum proportion supported by the literature (Eyre-Walker et al. 2006). For the distributions where all mutations are deleterious, the effect of slightly deleterious mutations can be seen by the elevated short-term slope. The effect is quite small, even for the distributions that allow for the maximum proportion of slightly deleterious mutations. This elevated slope is dwarfed by the positive vertical intercept that corresponds to the existence of largely neutral polymorphism at population divergence time 0. By adding in a small proportion of slightly adaptive alleles, we see that the slightly deleterious effect is even smaller due to the fact that for slightly adaptive alleles, the initial slope will be smaller than the long-term slope.
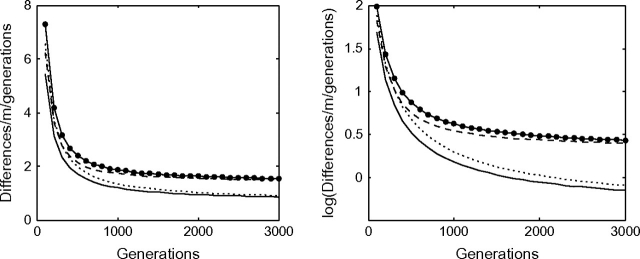
Hence, we can conclude that this persistence of neutral ancestral polymorphism is the driver of the short-term elevated evolutionary rates that we see in figure 3. We plot differences divided by mutation rate divided by time in generations and denote this value r. This gives the theoretical evolutionary rate averaged over the branch. Our results qualitatively agree with the observed data of Ho et al. (2005). However, contrary to their claim that the rate decays exponentially, the rates decay differently from exponential, showing a more pronounced curvature. This result is in agreement with Genner et al. (2007).
FIG. 3.—
The phenomenon of elevated divergence rates on short timescales is indicated in agreement with Ho et al. (2005), Genner et al. (2007), Waters et al. (2007), and Burridge et al. (2008). The rate decays faster than exponential in agreement with Genner et al. (2007). For N = 1,000, the expected divergence is divided by the number of generations to obtain the evolutionary rate for the same four distributions as in figure 2.
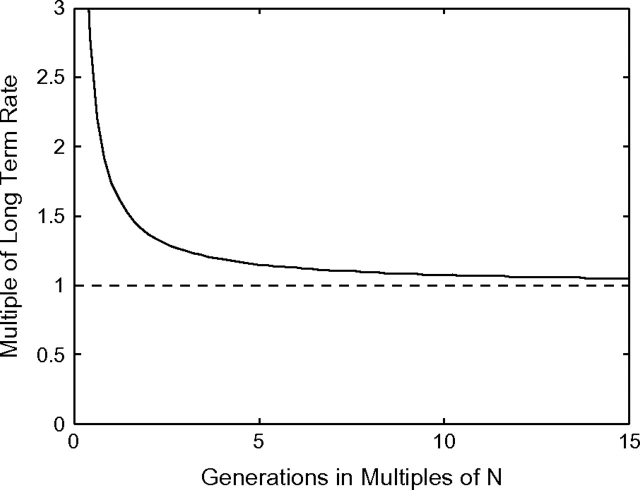
In figure 4, we demonstrate that the rate elevation depends almost exclusively on Ne. Under our simplifying assumptions, this provides an approximate guideline for investigators to correct for rate elevation if the effective population size of the process is known. For example, it takes 3Ne generations for the evolutionary rate to decay to 1.25 times the long-term rate.
FIG. 4.—
The magnitude of divergence rate elevation scales with effective population size. For a set of sites with selection coefficient s, the long-term evolutionary rate is given by 2π1(s). Using the distribution of negative s, gamma(0.23, 0.187), we integrate 2π1(s) times this distribution function to obtain the asymptotic rate across a set of sites whose fitness effects are distributed as assumed. Denote this rate ra. Using ra, we plot the rates obtained in figure 3 as a multiple of ra on the y axis. To be precise, the quantity on the y axis is n where r = nra. On the x axis, we plot the number of generations as a multiple of population size N. Hence, the quantity on the x axis is l where the number of generations equals lN. The figure was calculated using N = 500, but for other values of N considered (up to 5,000), the figure superimposes. For the other distributions of s considered in this paper, the results are similar.
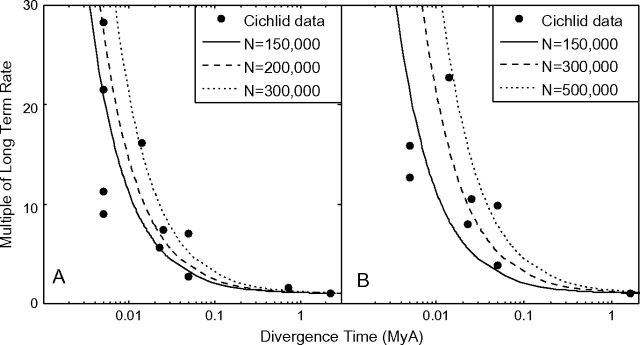
Genner et al. (2007) obtained divergence data in African cichlid fish by using both fossil calibrations and calibrations based on Gondwana landmass fragmentation. Because saturation occurs beyond 1 Myr, we take the youngest calibration point beyond 1 Mya and use the divergence rate obtained from that calibration as an estimate for the long-term rate. These calibration points are the oldest points plotted in figure 5A and B. Using figure 4 as our starting point, assuming a generation time of 1 year, and fitting a single parameter Ne, we obtain fits of our model to the data with estimates of effective population size Ne = 125,000–500,000 as shown in figure 5. It is interesting to note that we obtain a reasonable fit despite fitting only a single parameter to potentially noisy interspecies data that could display diversity in Ne across species. This fit suggests that our model does indeed fit data and sufficiently explains the phenomenon of elevated rates on short timescales. However, our estimates of Ne will be lower than those obtained by other methods due to the simplifying assumption of independent sites (i.e., free recombination) in our model, where the data are in fact mitochondrial.
FIG. 5.—
Our model provides a reasonable fit to the data of Genner et al. (2007). Genner et al. (2007) obtained estimates of rates of molecular evolution from divergence dates estimated two ways: fossil calibrations (A) and Gondwana land fragmentation estimates (B). We used the youngest divergence data older than 1 Myr as an estimate of the long-term rate without saturation and fit one parameter (Ne) to our model.
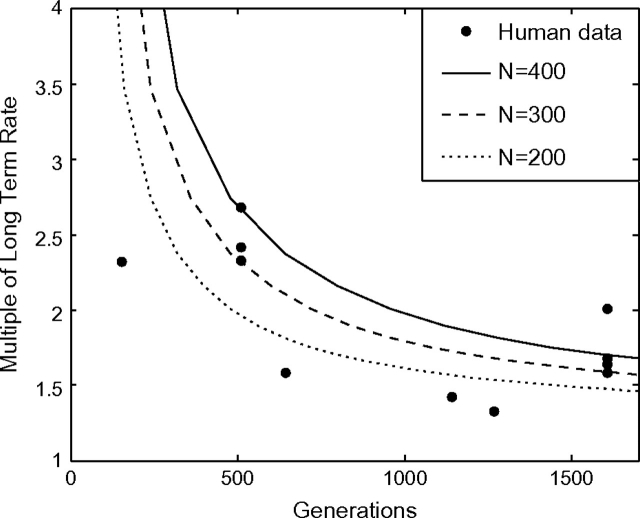
More recently, Henn et al. (2009) published human mtDNA coding region divergence rates using archaeological dates. In figure 6, we fit our model to the human divergence data assuming a long-term divergence rate of 0.02 mutations/site/Myr (Brown et al. 1979) and a generation time of 28 years (Fenner 2005). The human divergence data are consistent with our theoretical model with population size 200–400. These estimates for Ne are an order of magnitude smaller than previous estimates of human effective population size. This is to be expected, however, because our model assumes that all sites are unlinked, thus depressing the fitted Ne (see Materials and Methods).
FIG. 6.—
Human mtDNA divergence rate estimates from Henn et al. (2009) are consistent with our molecular clock model. Henn et al. (2009) obtained estimates of divergence rates from mtDNA coding regions using archaeological dating. Using a long-term rate of 0.02 substitutions/site/Myr and generation time 28 years, we fit a single parameter (Ne) to our model.
As an additional application of our model, we are able to calculate bias in Ka/Ks, the ratio of nonsynonymous mutations per site to synonymous mutations per site, an important quantity for detecting and measuring the direction and intensity of selection. Using simulations as well as a deterministic model, Rocha et al. (2006) calculated short-term trajectories for the reciprocal of this value. Their results show that Ks/Ka increases over time, prompting the authors to issue caution over using Ka/Ks to compare closely related populations.
Because an initial population of clonal individuals is assumed, polymorphism present at the time of population divergence is not treated in the model of Rocha et al. (2006). Figure 7A shows the effect of including such polymorphism in the model. We predict that Ka/Ks within a population (t = 0) will be elevated with respect to its asymptotic value. This initial elevation, however, is less pronounced when ancestral polymorphism is included in the model. From the initial elevation, the ratio demonstrates a slow decay to the asymptotic value. In our model, the Ka/Ks ratio decays more slowly than in a model where ancestral polymorphism is neglected.
FIG. 7.—
The short-term trajectory of the ratio Ka/Ks depends on (A) whether or not standing polymorphism is taken into account, (B) the proportion of nearly neutral alleles, and (C) the population size N. The ratio Ka/Ks undergoes a gradual decrease toward its asymptotic value from its initial elevation, as described in Rocha et al. (2006). However, if the effects of standing ancestral population are incorporated in the model, the trajectory changes shape and the magnitude of the initial elevation is significantly smaller. In addition, the magnitude of the rate elevation is larger if the distribution of fitness effects contains more nearly neutral alleles. Finally, increasing population size N, increases the duration of significant ratio elevation. This extent of the elevation depends on generations scaled in multiple of effective population size as with the molecular clock.
Figure 7B demonstrates that the transient dynamics of the ratio are an example of a slightly deleterious effect. By increasing the proportion of slightly deleterious alleles, the initial elevation in Ka/Ks jumps from approximately 20% in the case when λ = 0.23 to an approximately 40% increase when λ = 0.5. Finally, Figure 7C shows that although the initial maximum elevation is approximately 20% in both cases, by increasing N from 1,000 to 5,000, we see a significant increase in the convergence time to the asymptotic ratio. By plotting the ratio as a multiple of the asymptotic rate and scaling generations by multiples of N as in figure 4, it turns out that these graphs nearly superimpose (not shown). Hence, the elevation effect is again dependent on effective population size in the same manner as the molecular clock.
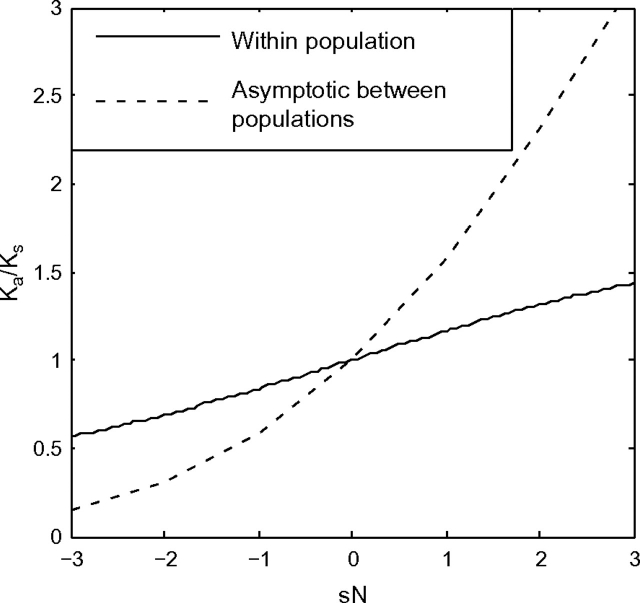
Accounting for the fact that the genealogical process of the Moran model is the same as that of Wright-Fisher but run twice as fast (Durrett 2008), our asymptotic prediction of Ka/Ks agrees with the between-population results of Kryazhimskiy and Plotkin (2008) obtained using a haploid single-site Wright–Fisher model (fig. 8). Kryazhimskiy and Plotkin (2008) found that for a given level of selection, Ka/Ks ratios within a single population were closer to one than the corresponding ratios between populations. We also predict that this will be the case. Although our models are qualitatively similar, they are quantitatively different. In our infinite sites Moran model formulation, the frequency of a mutant allele is distributed {τ1j/τ1}. Assuming a diffusion model subject to forward and back mutation and selection as in Kryazhimskiy and Plotkin (2008) leads to a quantitatively different stationary distribution of mutant allele frequency. This turns out to have only a very minor quantitative effect, however, and our results for Ka/Ks ratios within a population as a function of sN (fig. 8) are very similar to the results obtained in figure 3 of Kryazhimskiy and Plotkin (2008).
FIG. 8.—
The Ka/Ks ratio within a population is closer to one than the asymptotic Ka/Ks ratios between populations. The figure here is calculated with N = 1,000, but the result only depends on sN. The within-population result shown here is in near agreement with the result in figure 3 of Kryazhimskiy and Plotkin (2008).
Figure 8 demonstrates that for a set of sites with the same selection coefficient s, Ka/Ks within a population may be significantly different than Ka/Ks between populations. When looking across a set of sites whose fitness effects follow a probability distribution, however, this discrepancy may not be so large. For example, for a given negative value of sN, the within-population Ka/Ks may be elevated as much as 3.5-fold (sN = − 3, fig. 8) or more. However, as in figure 7B, the Ka/Ks ratio will only be elevated as much as 20–40% when a reasonable distribution of fitness effects is assumed. Furthermore, although the ratio decays less rapidly in our model than in models where ancestral polymorhpism is neglected, the absolute magnitude of the difference between the ratio at a given divergence time and its asymptotic value is quite small (e.g., much smaller than than molecular clock). This means that although Ka/Ks may not be suitable as a test of within-population selection, the ratio performs reasonably well across a set of sites between two populations as long as the populations have had a nominal time to diverge.
DISCUSSION
Our results suggest that the rate elevation of molecular divergence in the short term can be explained by segregating polymorphisms, both neutral and slightly deleterious, present at the time of the population divergence. The persistence of newly arising slightly deleterious mutations is not needed to describe the phenomenon. This indicates a sufficient theoretical explanation for the elevated rates of molecular evolution observed in a number of recent studies (Ho et al. 2005, Genner et al. 2007, Waters et al. 2007, Burridge et al. 2008).
A previous model by Woodhams (2006) calculated evolutionary rates as a function of time. That study, which calculates the rate curves assuming that the distribution of fitness effects of new deleterious mutations is exponential, concludes that the persistence of nearly neutral mutations is not sufficient to explain the phenomenon of elevated rates. However, polymorphism present at the time of population divergence was not considered, meaning that in the short term, Woodhams’ calculated rates of divergence are considerably less than those calculated here. By including the term fpoly, we are able to explain the rate elevation as almost entirely due to ancestral polymporphism.
Our approach is equivalent to the classical coalescent theory formulation that states that the divergence time for an allele is given by adding the divergence time of the two populations to the coalescent time of the allele in the ancestral population. Our forward time model is able to deal with selection in a relatively easy and straightforward fashion. Using Markov chain theory, we are able to estimate both the number of segregating sites at the time of population divergence and the frequency of the polymorphism at each of these sites. A valiant attempt at incorporating selection into the coalescent theory framework has been made using the ancestral selection graph (Krone and Neuhauser 1997), but is it complicated, and it would be extremely difficult to incorporate these results into a meaningful discussion of the problem outlined in our paper.
These results have implications for both users and developers of software used to calculate divergence date estimates. Current methods for estimating the divergence time of sequences ignore the dependency of the evolutionary rate on the age of the branch. We have shown that the theoretical rate on a given branch will, indeed, depend on its age. Because sequence divergence is used as a proxy for branch length, divergence dates estimated without considering the phenomenon of short-term elevated rates will be more ancient than the actual date of divergence. Under our simplifying assumptions, figure 4 provides a theoretical time line for the persistence and magnitude of this phenomenon. This can be used as a tool to correct for short-term elevation as well as to provide a guideline as to when the phenomenon may be ignored. For example, the observed divergence rate will decay to 2-fold elevation in approximately Ne generations. For hominid mitochondria, we found the effective population size for this process of approximately 300. Assuming a generation time of 28 years (Fenner 2005), this corresponds to 8,400 years. For bacteria such as Escherichia coli whose effective population size may be much higher, elevated rates may persist for an enormous number of generations.
Fitting our model to the African cichlid fish data of Genner et al. (2007) and human mtDNA data of Henn et al. (2009) indicates that our model is consistent with the shape and magnitude of the observed rate elevation. We acknowledge that we have not provided statistical evidence as to the goodness of fit of our model. Such statistical evidence would provide false precision. Each plotted data point has a 2D error structure, that is, there is error in both the calibration point and the estimate of divergence. In addition, we are fitting a nonlinear function, which does not have a simple closed-form analytical solution. Both these considerations make a rigorous statistical fit impractical. In light of these considerations, we believe that quantitative analysis of our fits is warranted. Although we have assumed no linkage between sites, the fits suggest that our model is consistent with the elevated rates observed on short timescales. Although the shape of our model curve is supported by the data, the estimated value of Ne is dependent on our linkage assumptions.
Bringing our model to bear on Ka/Ks, we have shown that the ratio may be inflated by as much as 40% in the short term, and this elevation may persist for quite some time. Percentage elevation in Ka/Ks scales with effective population size in the same way as the molecular clock, and the maximum elevation occurs within a single population. The magnitude of Ka/Ks elevation within a population is in near agreement with the results of Kryazhimskiy and Plotkin (2008). Although, the initial elevation is not as pronounced when standing polymorphism is neglected as in Rocha et al. (2006), the decay of Ka/Ks to its asymptotic value is slower than was described in that work. Still, because the absolute difference between a Ka/Ks ratio at a given time and its asymptotic rate are quite small, Ka/Ks performs reasonably well between populations whose divergence is separated by a nominal length of time.
Acknowledgments
We thank Alex Lancaster and other members of the Masel lab for input and productive discussions, Joe Watkins for mathematical advice and comments on the manuscript, and Martin Genner for providing the raw data used in figure 5. Work was supported by the BIO5 Institute at the University of Arizona and National Institute of Health grant GM-076041. J.M. is a Pew Scholar in the Biomedical Sciences and an Alfred P. Sloan Research fellow.
APPENDIX
Suppose Xt is a discrete random variable equal to the number of derived alleles in a population of N individuals at time t, where X0 = 1. At times 0,1,2,…Xt takes its values in state space 0,1,2,…,N. The transition matrix T for the Markov chain is as defined in the Materials and Methods. We define the following notation. Let μx = T(x,x − 1) and λx = T(x,x + 1). This means that μx is the probability that in one time step, the number of derived alleles decreases by one, and λx is the probability that this quantity increases by one. Because the Moran model allows for only one individual to reproduce and one to die in each time step, it follows that T(x,x) = 1 − λx − μx for x = 1,…,N − 1. T(x,x) = 1 for x = 0,N because a mutation is lost once it goes extinct and is fixed in the population once Xt = N.
For the Moran model with selection coefficient s, in order for the number of derived alleles to increase by one and individual with the derived allele must be chosen to reproduce with probability  and an individual with the ancestral allele must be chosen to die with probability
  . Hence,
  . Similarly, for the number of derived alleles to decrease by one, an individual with the derived allele must be chosen to die and an individual with the ancestral allele must be chosen to reproduce. This happens with probability
Now define psamp to be the vector  . Then, ith entry of psamp gives the probability that a randomly chosen individual in a population will have the derived allele given that i individuals in the population have the derived allele. Finally, let e1 be the N + 1 row vector with a 1 in the first entry and zeros everywhere else.
This allows us to write equations (3) and (5) in a form convenient for computing.
 |
(7) |
 |
(8) |
Again considering the Moran model with selection coefficient s, define πi(s) to be the probability that Xt = N before Xt = 0 given that X0 = i. If ρ0 = 1,  , then
 |
(eq. 2.158, Ewens 2004). When i = 1, this can be further simplified to
 |
The mean time that Xs = j before absorption at either Xt = 0 or Xt = N, τ1j, is given by
 |
(eq. 2.159, Ewens 2004).
This can be further simplified to arrive at
 |
Finally, the mean time spent by X in all states before absorption given that X0 = 1 is given by
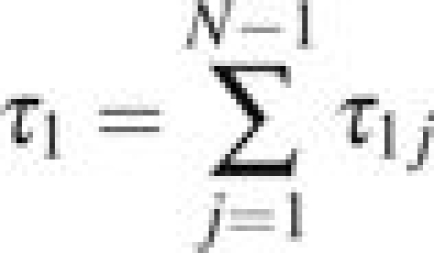 |
(eq. 2.144, Ewens 2004).
Using “Matlab” allows us to calculate quantities in our model such as TtNr for large t and N by taking successive right multiplications of r by T. This exploits the tridiagonality of the transition matrix T.
References
- Brown W, George M, Wilson A. Rapid evolution of animal mitochondrial DNA. Proc Natl Acad Sci USA. 1979;76:1967–1971. doi: 10.1073/pnas.76.4.1967. [DOI] [PMC free article] [PubMed] [Google Scholar]
- Burridge CP, Craw D, Fletcher D, Waters JM. Geological dates and molecular rates: fish DNA sheds light on time dependency. Mol Biol Evol. 2008;25:624–633. doi: 10.1093/molbev/msm271. [DOI] [PubMed] [Google Scholar]
- Drummond A, Rambaut A. BEAST: Bayesian evolutionary analysis by sampling trees. BMC Evol Biol. 2007;7:214. doi: 10.1186/1471-2148-7-214. [DOI] [PMC free article] [PubMed] [Google Scholar]
- Durrett R. Probability models for DNA sequence evolution. New York: Springer; 2008. [Google Scholar]
- Emerson BC. Alarm bells for the molecular clock? No support for Ho et al.’s model of time-dependent molecular rate estimates. Syst Biol. 2007;56:337–345. doi: 10.1080/10635150701258795. [DOI] [PubMed] [Google Scholar]
- Ewens WJ. Mathematical population genetics, volume I. New York: Springer; 2004. Theoretical introduction. [Google Scholar]
- Eyre-Walker A, Keightley PD. The distribution of fitness effects of new mutations. Nat Rev Genet. 2007;8:610–618. doi: 10.1038/nrg2146. [DOI] [PubMed] [Google Scholar]
- Eyre-Walker A, Woolfit M, Phelps T. The distribution of fitness effects of new deleterious amino acid mutations in humans. Genetics. 2006;173:891–900. doi: 10.1534/genetics.106.057570. [DOI] [PMC free article] [PubMed] [Google Scholar]
- Felsenstein J. Inferring phylogenies. Sunderland (MA): Sinauer Associates; 2004. [Google Scholar]
- Fenner JN. Cross-cultural estimation of the human generation interval for use in genetics-based population divergence studies. Am J Phys Anthropol. 2005;128:415–423. doi: 10.1002/ajpa.20188. [DOI] [PubMed] [Google Scholar]
- Fleischer RC, McIntosh CE, Tarr CL. Evolution on a volcanic conveyor belt: using phylogeographic reconstructions and K-Ar-based ages of the Hawaiian Islands to estimate molecular evolutionary rates. Mol Ecol. 1998;7:533–545. doi: 10.1046/j.1365-294x.1998.00364.x. [DOI] [PubMed] [Google Scholar]
- Garcia-Moreno J. Is there a universal mtDNA clock for birds? J Avian Biol. 2004;35:465–468. [Google Scholar]
- Genner MJ, Seehausen O, Lunt DH, Joyce DA, Shaw PW, Carvalho GR, Turner GF. Age of cichlids: new dates for ancient lake fish radiations. Mol Biol Evol. 2007;24:1269–1282. doi: 10.1093/molbev/msm050. [DOI] [PubMed] [Google Scholar]
- Henn BM, Gignoux CR, Feldman MW, Mountain JL. Characterizing the time dependency of human mitochondrial DNA mutation rate estimates. Mol Biol Evol. 2009;26:217–230. doi: 10.1093/molbev/msn244. [DOI] [PubMed] [Google Scholar]
- Ho SYW, Phillips MJ, Cooper A, Drummond AJ. Time dependency of molecular rate estimates and systematic overestimation of recent divergence times. Mol Biol Evol. 2005;22:1561–1568. doi: 10.1093/molbev/msi145. [DOI] [PubMed] [Google Scholar]
- Ho SYW, Shapiro B, Phillips MJ, Cooper A, Drummond AJ. Evidence for time dependency of molecular rate estimates. Syst Biol. 2007;56:515–522. doi: 10.1080/10635150701435401. [DOI] [PubMed] [Google Scholar]
- Howell N, Smejkal CB, Mackey DA, Chinnery PF, Turnbull DM, Hernstadt C. The pedigree rate of sequence divergence in the human mitochondrial genome: there is a difference between phylogenetic and pedigree rates. Am J Hum Genet. 2003;72:659–670. doi: 10.1086/368264. [DOI] [PMC free article] [PubMed] [Google Scholar]
- Kimura M. The neutral theory of evolution. Cambridge: Cambridge University Press; 1983. [Google Scholar]
- Krone SM, Neuhauser C. Ancestral processes with selection. Theor Popul Biol. 1997;51:210–237. doi: 10.1006/tpbi.1997.1299. [DOI] [PubMed] [Google Scholar]
- Kryazhimskiy S, Plotkin JB. The population genetics of dN/dS. PLoS Genet. 4(12):e1000304. 2008 doi: 10.1371/journal.pgen.1000304. [DOI] [PMC free article] [PubMed] [Google Scholar]
- Lambert DM, Ritchie PA, Millar CD, Holland B, Drummond AJ, Baroni C. Rates of evolution in ancient DNA from Adélie penguins. Science. 2002;295:2270–2273. doi: 10.1126/science.1068105. [DOI] [PubMed] [Google Scholar]
- Li WH. Distribution of nucleotide differences between two randomly chosen cistrons in a finite population. Genetics. 1977;85:331–337. doi: 10.1093/genetics/85.2.331. [DOI] [PMC free article] [PubMed] [Google Scholar]
- Parsons TJ, Muniec DS, Sullivan K, et al. A high observed substitution rate in human mitochondrial DNA control region. Nat Genet. 1997;15:363–368. doi: 10.1038/ng0497-363. [DOI] [PubMed] [Google Scholar]
- Penny D. Evolutionary biology: relativity for molecular clocks. Nature. 2005;436:183–184. doi: 10.1038/436183a. [DOI] [PubMed] [Google Scholar]
- Rambaut A. Estimating the rate of molecular evolution: incorporating non-contemporaneous sequences into maximum likelihood phylogenies. Bioinformatics. 2000;16:395–399. doi: 10.1093/bioinformatics/16.4.395. [DOI] [PubMed] [Google Scholar]
- Randi E. A mitochondrial cytochrome b phylogeny of the Alectoris partridges. Mol Phylogenet Evol. 1996;6:214–227. doi: 10.1006/mpev.1996.0072. [DOI] [PubMed] [Google Scholar]
- Rocha EPC, Smith JM, Hurst LD, Holden MTG, Cooper JE, Smith NH, Feil EJ. Comparisons of dN/dS are time dependent for closely related bacterial genomes. J Theor Biol. 2006;239:226–235. doi: 10.1016/j.jtbi.2005.08.037. [DOI] [PubMed] [Google Scholar]
- Sanderson M. A nonparametric approach to estimating divergence times in the absence of rate constancy. Mol Biol Evol. 1997;14:1218–1231. [Google Scholar]
- Sanderson MJ. Estimating absolute rates of molecular evolution and divergence times: a penalized likelihood approach. Mol Biol Evol. 2002;19:101–109. doi: 10.1093/oxfordjournals.molbev.a003974. [DOI] [PubMed] [Google Scholar]
- Shields GF, Wilson AC. Subspecies of the Canada goose (Branta canadensis) have distinct mitochondrial DNA's. Evolution. 1987;41:662–666. doi: 10.1111/j.1558-5646.1987.tb05837.x. [DOI] [PubMed] [Google Scholar]
- Sigurdardóttir S, Helgason A, Gulcher JR, Steffansson K, Donnely P. The mutation rate in human mtDNA control region. Am J Hum Genet. 2000;66:1599–1609. doi: 10.1086/302902. [DOI] [PMC free article] [PubMed] [Google Scholar]
- Waters JM, Rowe DL, Apte S, King TM, Wallis GP, Anderson L, Norris RJ, Craw D, Burridge CP. Geological dates and molecular rates: rapid divergence of rivers and their biotas. Syst Biol. 2007;56:271–282. doi: 10.1080/10635150701313855. [DOI] [PubMed] [Google Scholar]
- Wayne RK, Vanvalkenburgh B, O'Brien SJ. Molecular distance and divergence time in carnivores and primates. Mol Biol Evol. 1991;8:297–319. doi: 10.1093/oxfordjournals.molbev.a040651. [DOI] [PubMed] [Google Scholar]
- Weir JT, Schluter D. Calibrating the avian molecular clock. Mol Ecol. 2008;17:2321–2328. doi: 10.1111/j.1365-294X.2008.03742.x. [DOI] [PubMed] [Google Scholar]
- Woodhams M. Can deleterious mutations explain the time dependency of molecular rate estimates? Mol Biol Evol. 2006;23:2271–2273. doi: 10.1093/molbev/msl107. [DOI] [PubMed] [Google Scholar]
- Yoder AD, Yang Z. Estimation of primate speciation dates using local molecular clocks. Mol Biol Evol. 2000;17:1081–1090. doi: 10.1093/oxfordjournals.molbev.a026389. [DOI] [PubMed] [Google Scholar]
- Zuckerkandl E, Pauling L. Molecular disease, evolution. In: Kasha M, Pullman B, editors. Horizons in biochemistry. New York: Academic Press; 1962. pp. 189–225. genic heterogeneity. [Google Scholar]


