

Abstract
BACKGROUND
The tendency to conceive dizygotic (DZ) twins is a complex trait influenced by genetic and environmental factors. To search for new candidate loci for twinning, we conducted a genome-wide linkage scan in 525 families using microsatellite and single nucleotide polymorphism marker panels.
METHODS AND RESULTS
Non-parametric linkage analyses, including 523 families containing a total of 1115 mothers of DZ twins (MODZT) from Australia and New Zealand (ANZ) and The Netherlands (NL), produced four linkage peaks above the threshold for suggestive linkage, including a highly suggestive peak at the extreme telomeric end of chromosome 6 with an exponential logarithm of odds [(exp)LOD] score of 2.813 (P = 0.0002). Since the DZ twinning rate increases steeply with maternal age independent of genetic effects, we also investigated linkage including only families where at least one MODZT gave birth to her first set of twins before the age of 30. These analyses produced a maximum expLOD score of 2.718 (P = 0.0002), largely due to linkage signal from the ANZ cohort, however, ordered subset analyses indicated this result is most likely a chance finding in the combined dataset. Linkage analyses were also performed for two large DZ twinning families from the USA, one of which produced a peak on chromosome 2 in the region of two potential candidate genes. Sequencing of FSHR and FIGLA, along with INHBB in MODZTs from two large NL families with family specific linkage peaks directly over this gene, revealed a potentially functional variant in the 5′ untranslated region of FSHR that segregated with the DZ twinning phenotype in the Utah family.
CONCLUSION
Our data provide further evidence for complex inheritance of familial DZ twinning.
Keywords: dizygotic twinning, linkage
Introduction
The tendency to conceive dizygotic (DZ) twins is a complex trait influenced by both genetic and environmental factors (Bulmer, 1970; Lewis et al., 1996; Meulemans et al., 1996). Results from family studies show significantly higher frequencies of DZ twins in the female relatives of mothers of DZ twins (MODZT) compared with the mothers of monozygotic (MZ) twins (Lewis et al., 1996; Meulemans et al., 1996; Hoekstra et al., 2008a). Taken together, the combined risk of giving birth to DZ twins for women with a first-degree female relative with DZ twins is about twice the population average (Lewis et al., 1996), approximately the same risk as for breast cancer (Pharoah et al., 2002). Maternal age is another important risk factor and the DZ twinning frequency increases ∼4-fold between the ages of 15–37 years (Bulmer, 1970).
Risk factors for DZ twinning may act by increasing the frequency of twin ovulations or by promoting better embryo survival. Partial failure of twin pregnancy (the ‘vanishing twin syndrome’) is common, and among pregnancies with twin sacs or embryos about 30% will ultimately result in single births (Landy and Keith, 1998). However, the same genes are likely to influence survival of both MZ and DZ twins and the frequency of MZ twins does not vary with maternal age or between different populations (Bulmer, 1970). Therefore, the data are more consistent with the hypothesis that the major cause of variation in DZ twinning is an increased frequency of twin ovulation. Women with a history of DZ twinning have an increased incidence of multiple follicle growth (Martin et al., 1991; Gilfillan et al., 1996) and increased DZ twinning in older women is thought to result from depletion of the ovarian follicle pool and a subsequent rise in concentrations of follicle-stimulating hormone (FSH) (Lambalk et al., 1998). There is little direct evidence for increased twin ovulations in women leading to DZ twins, but in a small series of women all eight cases where two corpora lutea were seen at the first trimester ultrasound were DZ twin pregnancies (Woo et al., 2009).
The number of follicles that ovulate is tightly regulated by complex endocrine and paracrine pathways. One important mechanism is the ovarian TGFβ signalling pathway. Growth differentiation factor-9 (GDF9) and bone morphogenetic protein-15 (BMP15) secreted by the oocyte are essential for normal human fertility and play crucial roles in determining follicle growth and ovulation rates (Moore et al., 2004). A dominant-negative mutation in BMP15 identified in Italian sisters caused ovarian dysgenesis (Di Pasquale et al., 2004). Mutations in BMP15, GDF9 and the bone morphogenetic protein receptor 1B (BMPR1B) in sheep all increase ovulation rates and twinning (Galloway et al., 2000; Wilson et al., 2001; Hanrahan et al., 2004). We have shown that rare variants in GDF9 are significantly associated with human DZ twinning (Montgomery et al., 2004; Palmer et al., 2006), but the proportion of variation in DZ twinning accounted for by these variants is small (Palmer et al., 2006). We also investigated common variations around GDF9 and BMP15, but were unable to demonstrate any association with DZ twinning (Palmer et al., 2006; Zhao et al., 2008a), suggesting that genetic variation for DZ twinning must result from variants at other loci.
To identify genes responsible for DZ twinning, Derom et al. (2006) performed a genome-wide linkage scan on 14 Flemish families that each contained at least three DZ twin pairs and included a total of 57 MODZT. Taking the possibility of genetic heterogeneity into account, some evidence for linkage was found at three regions, on chromosomes 2, 7 and 18, with maximum logarithm of odds (LOD) scores of 1.41, 1.3 and 1.78, respectively. Little or no evidence of linkage was seen at the site of proposed candidate genes including the follicle-stimulating hormone receptor (FSHR), inhibin beta A and B (INHBA, INHBB), peroxisome proliferator-activated receptor gamma (PPARG) or BMPR1B genes (Derom et al., 2006). Although no new genes were identified, these results add further weight to the growing body of evidence that DZ twinning may be a heterogeneous, complex genetic trait.
Simulations performed by Derom et al. (2006) showed that with 14 families there would be sufficient power to detect linkage to a single gene of large effect if there was no genetic heterogeneity (average LOD score of 3.7). However, introducing even 25% heterogeneity reduced the simulated average LOD score to 1.25 (Derom et al., 2006), indicating insufficient power to detect linkage if multiple genes contributed to the DZ twinning phenotype. To expand the search for genes contributing to DZ twinning, we have now performed genome-wide scans for linkage in a much larger and more powerful dataset including a total of 525 families including 1128 MODZT from Australia and New Zealand (ANZ), The Netherlands (NL) and the USA. Most of our families comprised affected sister pairs (ASPs), but a small number of larger families with MODZT in multiple generations were also included. Samples were genotyped at either ∼400 polymorphic microsatellite loci or ∼6000 single nucleotide polymorphisms (SNPs). We analysed genetic linkage in these cohorts and sequenced candidate genes in three families.
Materials and Methods
Sample collection
Caucasian MODZT and their families from ANZ and NL were recruited as part of our larger collaborative study on the genetics of DZ twinning (Montgomery et al., 2001; Hoekstra et al., 2004; Palmer et al., 2006; Hoekstra et al., 2008a). We recruited families where two or more sisters had given birth to spontaneous DZ twins (Duffy et al., 2000) and also single cases where at least one additional third-degree relative had spontaneous DZ twins. Blood samples were obtained from a total of 523 families including 1115 MODZT plus their parents and/or additional siblings or other relatives when available. Of the 481 families containing an ASP, an ASP plus both parents were sampled for 144 families whereas an ASP plus at least one parent and/or one to six additional siblings were sampled for a further 213 families and 124 families had only the ASP sampled. The remaining families had more complicated family structures, where sampled individuals included three MODZT sisters plus at least one parent and/or a sibling (11 families), an ASP or singleton plus at least one second- or third-degree relative who was also a MODZT (e.g. an aunt, niece or first cousin; 29 families), and finally two ASPs related as first and more distant cousins (two families).
MODZT and their families had been identified in Australia and New Zealand through records from genetic epidemiology studies using twins and their families in Australia (Lewis et al., 1996), through organizations for mothers of twins in Australia and New Zealand, and through appeals in the media in both countries. In The Netherlands, ascertainment was population-based through community records as part of a systematic recruitment to NL Twin Register (Meulemans et al., 1996; Boomsma et al., 2002). Additionally, in 1992 we had also collected DNA from members of five large, multi-generation Caucasian DZ twinning families from Utah (UT), USA, identified through the Utah Population Database. During recruitment all mothers were explicitly asked about fertility treatments and any such cases were excluded. Ancestry was self-reported for all families. Ethics approval was obtained from the Human Research Ethics Committees of the Queensland Institute of Medical Research (QIMR), the VU University Medical Center, Amsterdam, and the University of Utah and all participants gave written informed consent.
Genomic DNA was extracted from peripheral venous blood samples using a standard protocol (Miller et al., 1988). The zygosity of same sex twin offspring was initially based on the mothers' responses to questions on whether the twins were alike in eye-, hair- or face-colour and in face form and whether the twins were often mistaken for each other by their parents, other relatives and by strangers. In equivocal cases, zygosity was determined by genotyping nine independent microsatellite markers (AmpFLSTR® Profile Plus; Applied Biosystems, Foster City, USA). The probability of dizygosity given concordance of all markers in the panel was <10−4 (Nyholt, 2006).
Genotyping
Genotyping took place in three phases as the families were collected over a number of years. Twenty-five samples from the two most informative UT families including 13 MODZT were genotyped by the Marshfield Center of Human Genetics (MCHG) at 393 microsatellites spaced at 10 cM intervals from the Marshfield Weber set 16 microsatellite set.
The ANZ and NL families were genotyped in two stages. Initially, 245 families (165 ANZ, 80 NL) including 845 individuals (599 ANZ, 246 NL) of which 210 were founders (143 ANZ, 67 NL) and 523 MODZT (348 ANZ, 175 NL) were genotyped by the Australian Genome Research Facility (AGRF) at the 400 microsatellite markers spaced at ∼10 cM intervals included in the Linkage Mapping Set version 2 (PE Biosystems). Genotype calls and initial genotyping quality control were performed by the MCHG and the AGRF (Ewen et al., 2000).
Subsequently, due to the development of chip technology and decreasing genotyping costs, 278 families (154 ANZ, 124 NL) including 987 individuals (505 ANZ, 482 NL) of which 185 were founders (95 ANZ, 90 NL) and 592 MODZT (317 ANZ, 275 NL) were genotyped at QIMR at the 6058 SNP loci spaced at ∼0.58 cM intervals included on the Infinium HumanLinkage-12 Beadchips (Illumina Inc, San Diego, USA), designed using highly validated HapMap SNPs (www.hapmap.org) maximizing both information content per SNP and the likelihood of detecting a recombination event, according to the manufacturer's instructions. The ANZ and NL cohorts were genotyped separately. Genotype calls and initial genotyping quality control were performed using the BeadStation software (Illumina Inc.).
Data cleaning
All data cleaning measures were performed separately for each genotyping cohort (microsatellite sets UT and ANZ/NL; SNP sets ANZ and NL). Three individuals including one MODZT were dropped from the UT families due to low genotyping calling rates (18–61%). All remaining individuals within all cohorts had overall call rates of at least 95% for the microsatellite scans and at least 98% for the SNP scans. For all genotyping cohorts, loci were removed if genotypes were missing in more than 5% of individuals. Tests of deviation from Hardy–Weinberg equilibrium (HWE) were performed using the program SIB-PAIR (http://www.qimr.edu.au/davidD/#sib-pair), a genetic analysis program that takes family structure within datasets into account. Loci with HWE χ2 test P-values of <0.001 were considered to represent poor quality genotyping assays and were removed from subsequent analyses. Following data cleaning, 393 (UT) and 372 (ANZ/NL) microsatellites and 5984 and 6006 SNPs (ANZ and NL, respectively) remained in the data sets for linkage analyses.
Further data cleaning were performed by checking relationships within families using Graphical Relationship Representation (GRR; Abecasis et al., 2001), a program that detects pedigree errors by calculating the degree of allele sharing between family members. Eleven families had individuals that were genetically inconsistent with the stated pedigree relationships. As other family members were genetically consistent in all cases, the genotypes of apparently unrelated individuals were zeroed in five families, and dummy fathers were added to the pedigree files to account for half-sib relationships in the remaining six families. Genotypes producing Mendelian errors were then detected and set to ‘missing’ in the relevant individuals using SIB-PAIR. Finally, unlikely genotypes, which appear to be the result of double recombinations but are more likely due to genotyping errors, were subsequently detected using the linkage analysis program MERLIN (Abecasis et al., 2002), and removed using the PEDWIPE program included in the MERLIN package.
Combining data
Microsatellite and SNP datasets
To maximize the amount of linkage information in the ANZ and NL cohorts, the microsatellite and SNP datasets for each country cohort were combined once all data cleaning procedures had been performed. The physical positions (in bases) of all SNP loci were as provided by Illumina, and the physical positions of the microsatellites were re-checked in the UCSC genome database (http://genome.ucsc.edu/; NCBI Build 36.1) to ensure that their positions relative to the SNPs were correct.
ANZ and NL cohorts
The newly combined microsatellite and SNP datasets for both the ANZ and NL cohorts were then themselves combined to further maximize the linkage information in the total dataset. Prior to combining the data, SNP loci with significant differences in allele frequency were removed from the datasets for both country cohorts. Differences between the ANZ and NL cohorts were tested in PLINK (Purcell et al., 2007), a program that tests genetic associations using case:control data, using the unrelated founders from one cohort as ‘cases’ and those of the other as ‘controls’. This served to ensure that allele frequencies estimated during linkage analyses were not confounded by different SNP alleles having being called as the ‘minor’ allele in the ANZ versus NL cohorts (resulting from differences in the strand that was read at the genotype calling stage) or true frequency differences at ancestry informative SNPs. Loci with P-values of <0.001 were removed at this stage, leaving 5590 SNPs for the combined analysis. The same procedure was not performed for the microsatellite datasets as the ANZ and NL families were genotyped together (so allele calls should be consistent across these families). Tests of allele frequencies between the ANZ and NL cohorts for all markers in the peak linkage regions confirmed consistent allele coding, with no marker showing significant allele frequency differences (P > 0.01 for all tests conducted) between cohorts.
Linkage analyses
ANZ and NL cohorts
As the mode of inheritance of DZ twinning is unclear and likely to be complex, single and multi-point linkage analyses were initially performed using non-parametric linkage (NPL) methods implemented in MERLIN (using MINX, an X chromosome specific version of MERLIN, for the X chromosome) under the ‘exponential’ and ‘pairs’ models as these tend to better account for the inheritance of susceptibility alleles underlying complex traits (rare/low frequency alleles of large effect shared by a small proportion of families). Analyses were run across grids at 1 Mb intervals (NB: we approximated the genetic map assuming 1 cM–1 Mb as a recombination based genetic map containing all loci is not available) to allow for the incorporation of information from SNP and microsatellite loci spaced various distances apart. Linkage analyses utilizing allele frequencies at each locus estimated via maximum likelihood by MERLIN using all individuals and accounting for relatedness produced similar results to analyses utilizing allele frequencies estimated via gene counting of only the founders in each pedigree. Hence for all linkage analyses the allele frequencies were estimated using only founding individuals.
To obtain empirical estimates of genome-wide significance levels, simulations were performed using the pedigree structures in the data set and the observed patterns of genotyping, including any missing genotypes. These simulations allowed us to take account of uneven marker spacing and information content (Sawcer et al., 1997; Kruglyak and Daly 1998) and to calculate the probability of observing one or more peaks of a certain height (Wiltshire et al., 2002). Data for 1000 simulated genome scans were generated using MERLIN under the assumption that there were no susceptibility loci; each replicate was then analysed in the same way as the observed data, and the highest peak for each chromosome was recorded. The empirical significance level of an observed exponential pairs (exp)LOD score was then estimated by counting the proportion of genome scans containing one or more peaks of that size. The cut-off for suggestive linkage (expLOD = 1.67) was calculated as the expLOD score that was observed on average once per genome scan (i.e. 1000 times across the 1000 replicates), thus representing the average maximum peak size expected once per genome scan by chance alone (Lander and Kruglyak, 1995). The significant linkage threshold (expLOD = 2.97) was defined as the score occurring with probability 0.05 in a genome scan (Lander and Kruglyak, 1995) (i.e. 50 peaks of equal or greater size observed across the 1000 simulations).
Linkage under explicit models of inheritance
Previous research into the inheritance of DZ twinning has variously suggested dominant, recessive and also female-limited X-linked inheritance (Hoekstra et al., 2008b). In line with Derom et al. (2006), we also ran parametric linkage analyses to test whether specific inheritance models better explain the observed DZ twinning inheritance pattern in our families: a ‘recessive’ model with a twinning gene frequency of 0.5 and an overall penetrance of 0.05 for twinning gene homozygotes (Bulmer, 1970), and a ‘dominant’ model with a twinning gene frequency of 0.035, overall penetrance of 0.1 for twinning gene carriers, and a phenocopy rate of 0.013 (Meulemans et al., 1996). As these models are quite extreme, we also ran analyses incorporating simpler and more widely applicable models of both recessive (allele frequency 0.1, penetrance 0.5 for homozygotes, no phenocopies) and dominant (allele frequency 0.01, penetrance 0.5 for carriers, no phenocopies) inheritance (Holliday et al., 2008). Analyses were run in MERLIN taking genetic heterogeneity among families into account and allowing the program to maximize the alpha value (the proportion of families linked to a region) as this is typically unknown for complex traits.
Linkage considering maternal age
One of the major influences on the DZ twinning rate is maternal age. In an attempt to distinguish linkage signals from families where multiple ovulation results from genetics rather than age, we performed linkage analyses grouping our ANZ and NL families into maternal age classes based on the average age of our MODZTs when they gave birth to their first set of DZ twins (29.48 ± 4.69 years). As we expect the genes contributing to twinning to be shared by related MODZTs within a family, analyses were first carried out including all families where at least one MODZT gave birth to her first set of twins when <30 years of age (1MODZT < 30: 362 families; 181 ANZ, 181 NL) and subsequently by including only those families where all MODZT gave birth to their first sets of twins <30 years of age (ALLMODZT < 30: 113 families; 84 ANZ, 29 NL).
The significance of these results were then tested by ordered subset analyses (OSA; Hauser et al., 2004) using the program FLOSS (Browning, 2005) in association with MERLIN. First, covariate values of maternal age were assigned to each family, where the 1MODZT < 30 classification was tested by assigning the age of the youngest MODZT as the family covariate value, while the ALLMODZT < 30 was tested by assigning the age of the oldest MODZT as the family covariate value for this class. FLOSS was then utilized to perform linkage analyses on successive sets of N + 1 families ordered by their covariate score, from the smallest to the largest, until the NPL linkage score (the ‘expLOD’ option can not be used in this analysis) was maximized (Browning, 2005). Monte Carlo P-values corresponding to the maximized NPL scores were then assessed by 10 000 permutations to determine whether the NPL scores obtained when families are ordered by their covariate values were significantly higher than NPL scores obtained when families were included in the analysis in random order.
UT cohort
Linkage in the UT cohort was analysed using the MEGA2 (Mukhopadhyay et al., 2005), MERLIN and SIMWALK2 (Sobel and Lange, 1996) programs. UT Family 1 was larger than the maximum pedigree size that can be analysed by MERLIN, so for this cohort MEGA2 was used to drive a combined MERLIN-SIMWALK2 analysis where both programs run in tandem, with SIMWALK2 analysing the larger pedigree, to output a combined result under the NPL model. As the number of founders in the two families was low, allele frequencies at all microsatellite loci were estimated using all genotyped individuals.
Mutation screening of candidate genes
The program PRIMER 3.0 (Rozen and Skaletsky, 2000) was used to design oligonucleotide primers for the amplification and sequencing of three candidate genes under linkage peaks obtained for some of our larger families. All exons, including intron–exon boundaries as well as the 5′ and 3′ untranslated regions (UTR) were sequenced for two genes, FSHR and factor in the germline alpha (FIGLA), whereas exon 2, encoding the mature peptide region of the INHBB protein subunit, was sequenced for INHBB gene. To screen for variants in each gene, DNA from all sampled MODZT within a linked family was amplified via polymerase chain reaction (PCR) using Amplitaq Gold enzyme and PCR buffer and sequenced using BigDye Terminators V 3.0 (all Applied Biosystems). Other sampled members of each family were subsequently sequenced to determine their genotypes for any variants that appeared to segregate with DZ twinning. The likely impacts of all variants found were tested by appropriate in silico analyses depending on the location of the variant (promoter region, intron/exon boundary, exonic). One variant found in UT Family 2, in the 5′ UTR of FSHR, was genotyped in all other UT families using high resolution melt (HRM) technology. Briefly, a 106 bp fragment was amplified via PCR using Sensimix (Quantace, London, UK) in the presence of a fluorescent dye (EvaGreen; Biotium, Hayward, USA) and then subsequently slowly ‘melted’ in a Rotor-Gene 6000 (Qiagen, Hilden, Germany), resulting in three specific melt-curves corresponding to samples homozygous for either allele or heterozygous for both alleles. All details including primer sequences, PCR and HRM amplification/melt conditions are available from the authors upon request.
Results
ANZ and NL cohorts
Combining the microsatellite and SNP datasets for both the ANZ and NL DZ twinning cohorts produced four peaks with non-parametric expLOD scores above the threshold for suggestive linkage (Table I, Fig. 1). Parametric linkage analyses incorporating explicit recessive and dominant models of inheritance and allowing for genetic heterogeneity did not provide increased evidence for linkage or identify additional candidate susceptibility loci.
Table I.
Exponential pair (exp)LOD scores for the combined ANZ/NL dataset and the separate ANZ and NL DZ twinning cohorts.
| Chr | Position (Mb) | expLOD scores (P) |
||
|---|---|---|---|---|
| Combined | ANZ | NL | ||
| 1 | 206 | 0.808 (0.0269) | 1.557 (0.0037) | −0.032 (0.6486) |
| 1 | 238 | 0.484 (0.0676) | 0.004 (0.4493) | 1.033 (0.0145) |
| 3 | 10 | 1.417 (0.0053) | 0.409 (0.0850) | 1.664 (0.0028) |
| 4 | 112 | 0.086 (0.2643) | −0.371 (0.9044) | 1.849 (0.0018) |
| 6 | 170 | 2.813 (0.0002) | 1.064 (0.0134) | 1.878 (0.0016) |
| 7 | 3 | 0.718 (0.0345) | 1.720 (0.0024) | −0.183 (0.8205) |
| 7 | 145 | 1.681 (0.0027) | 0.720 (0.0343) | 0.986 (0.0165) |
| 9 | 24 | 1.806 (0.0020) | 1.206 (0.0092) | 0.690 (0.0372) |
| 12 | 120 | 0.994 (0.0162) | −0.005 (0.5578) | 2.645 (0.0002) |
| 13 | 23 | 0.449 (0.0752) | −0.016 (0.6072) | 1.656 (0.0028) |
| 14 | 105 | 0.215 (0.1599) | −0.092 (0.7422) | 1.31 (0.0070) |
| 16 | 30 | 2.268 (0.0006) | 0.552 (0.0554) | 2.133 (0.0008) |
| 20 | 17 | 1.066 (0.0134) | 1.929 (0.0014) | −0.005 (0.5630) |
The highest linkage scores are bolded.
Figure 1.

Linkage results (expLODs) for the combined ANZ/NL dataset (black) and ANZ (blue) and NL (red) DZ twinning family cohorts. Microsatellite and SNP data were combined prior to all analyses. The small arrow at the bottom of each chromosome panel indicates the approximate position of the centromere.
The highest linkage peak for the combined ANZ/NL dataset was on chromosome 6 at ∼170 Mb, at the extreme telomeric end of the long arm, with an expLOD score of 2.813 (P = 0.0002), close to our estimated score indicating genome-wide significant linkage. This peak represents highly suggestive evidence for linkage, with only 65 peaks reaching a score >2.81 observed in 1000 simulations (resulting in a genome-wide P = 0.065; 95% CIs 0.051–0.082). Additional peaks above our limit of suggestive linkage were observed for chromosomes 7 (expLOD 1.681, P = 0.0027), 9 (expLOD 1.806, P = 0.0020) and 16 (expLOD 2.268, P = 0.0006). These scores were observed in our simulations 915, 709 and 237 times in 1000 simulations, respectively.
To determine whether both cohorts contributed signal to the combined linkage peaks and investigate the possible presence of cohort-specific linkage signals, the ANZ and NL cohorts were also analysed separately. Both country cohorts contributed signal to the four suggestive linkage peaks on chromosomes 6, 7, 9 and 16, however, these were not the highest scores obtained for either cohort. The highest peak for the ANZ cohort was on chromosome 20 at ∼17 Mb, with an expLOD of 1.929 (P = 0.0014). The highest peak for the NL cohort was on chromosome 12 at ∼120 Mb, with an expLOD of 2.645 (P = 0.0002), although the second peak with an expLOD > 2 was on chromosome 16 at ∼30 Mb (expLOD 2.133, P = 0.0008). As for the combined cohort, parametric linkage analyses incorporating explicit models of inheritance and allowing for heterogeneity did not increase either the linkage scores or the number of linkage peaks in either the ANZ or NL cohorts.
DZ twinning and maternal age
When the families were classified according to the age at which MODZTs gave birth to their first sets of twins, the highest linkage peaks were on chromosome 1 at ∼199 Mb, with expLODs of 2.718 (P = 0.0002) when including only families where 1MODZT < 30 and 2.129 (P = 0.008) when including only families where ALLMODZT < 30 (Fig. 2). These peaks were largely due to linkage signal from the ANZ cohort, with expLOD scores for the 1MODZT < 30 families of 4.151 (P = 6.15 × 10⁻⁶; corresponding NL expLOD 0.959, P = 0.0178) and for the ALLMODZT < 30 families of 1.565 (P = 0.0003; corresponding NL expLOD 0.544, P = 0.0567).
Figure 2.

Linkage results (expLODs) for maternal age class analyses in the combined ANZ/NL DZ twinning dataset. ExpLOD scores obtained when all families contained one MODZT who gave birth to twins at <30 years of age are indicated with a solid line, whereas the scores obtained including only families where all MODZT gave birth to their twins at <30 years of age are indicated by a dashed line.
Ordered subset analyses to determine the significance of the maternal age class results produced maximum NPL scores when families with covariate scores ≤29 (1MODZT < 30; max NPL 3.41) and <31 (ALLMODZT < 30; max NPL 3.21) were included, consistent with our grouping based on the average age of first twins. However, 10 000 permutations produced 2016 (P = 0.202; 1MODZT < 30) and 4178 (P = 0.418; ALLMODZT < 30) replicates with NPL scores higher than those achieved when the families were ordered by their covariate score when equivalent groups of randomly chosen families were analysed. This suggests the chromosome 1 results considering maternal age classes are chance findings in the combined ANZ/NL dataset.
Linkage to known candidate regions
With the possible exception of the PPARG gene on chromosome 3, there was no evidence of linkage over currently known putative candidate genes in the combined ANZ/NL dataset or in either the ANZ or NL cohorts (Table II). The combined dataset produced an expLOD score of 1.417 (P = 0.0053), just below our limit of suggestive linkage, at ∼10 Mb, 2 Mb upstream of PPARG. This signal was mostly due to the NL cohort, with an expLOD score of 1.664 (P = 0.0028) over this region.
Table II.
Exponential pair (exp)LOD scores for the combined ANZ/NL dataset and the separate ANZ and NL cohorts over potential DZ twinning candidate genes.
| Candidate Gene | Chr | Position (Mb) | expLOD scores |
||
|---|---|---|---|---|---|
| Combined | ANZ | NL | |||
| MTHFR* | 1 | 11.7 | −0.181 | −0.198 | −0.023 |
| LHCGR* | 2 | 49 | 0.151 | 0.346 | −0.012 |
| FSHR* | 2 | 49.1 | 0.151 | 0.346 | −0.012 |
| FIGLA** | 2 | 70.8 | 0.228 | 0.280 | 0.013 |
| INHBB* | 2 | 120.8 | −0.199 | −0.379 | 0.009 |
| ACVR2A* | 2 | 148.3 | −0.377 | −0.075 | −0.408 |
| ACVR1C* | 2 | 158.1 | −0.047 | −0.002 | −0.096 |
| BMPR2** | 2 | 202.9 | −0.004 | −0.117 | 0.137 |
| INHA* | 2 | 220.1 | −0.007 | 0.047 | −0.166 |
| PPARG* | 3 | 12.4 | 0.853 | 0.158 | 1.363 |
| ACVR2B* | 3 | 38.4 | −0.328 | −0.024 | −0.528 |
| BMPR1B** | 4 | 96.2 | 0.056 | −0.008 | 0.230 |
| FST* | 5 | 52.8 | 0.087 | 0.034 | 0.060 |
| GDF9** | 5 | 132.2 | −0.034 | −0.121 | 0.016 |
| CGA* | 6 | 87.8 | 0.004 | −0.116 | 0.258 |
| INHBA* | 7 | 41.7 | 0.029 | −0.002 | 0.104 |
| TGFBR1** | 9 | 100.9 | 0.139 | 0.412 | −0.051 |
| BMPR1A* | 10 | 88.6 | −0.855 | −0.232 | −0.889 |
| FSHB* | 11 | 30.2 | −0.118 | −1.036 | 0.459 |
| BMP15** | X | 50.6 | 0.208 | 0.203 | 0.008 |
*Genes listed in Derom et al. (2006); **additional functional candidates.
Large NL cohort families
Several of the larger ANZ and NL families contained three or more MODZT and showed family specific linkage peaks. In particular, two NL families containing four and six MODZT each showed a linkage peak on chromosome 2 directly over the INHBB gene. Sequencing of exon 2, encoding the mature peptide region of the INHBB protein, for eight MODZT revealed no variation in any sample in comparison to a reference sequence (NM_002193; not shown).
UT cohort
Linkage
The two UT families were analysed under the ‘NPL’ model to allow for the output from both the MERLIN and SIMWALK programs to be combined. This resulted in one linkage peak on chromosome 2, with a maximum NPL score of 1.311 (P = 0.048) (Fig. 3). Examination of the individual families showed that this signal was contributed entirely by UT Family 2 (NPL 1.633, P = 0.030). As for the ANZ and NL cohorts, parametric linkage analyses incorporating explicit models of dominant and recessive inheritance had little effect on the linkage scores (not shown).
Figure 3.
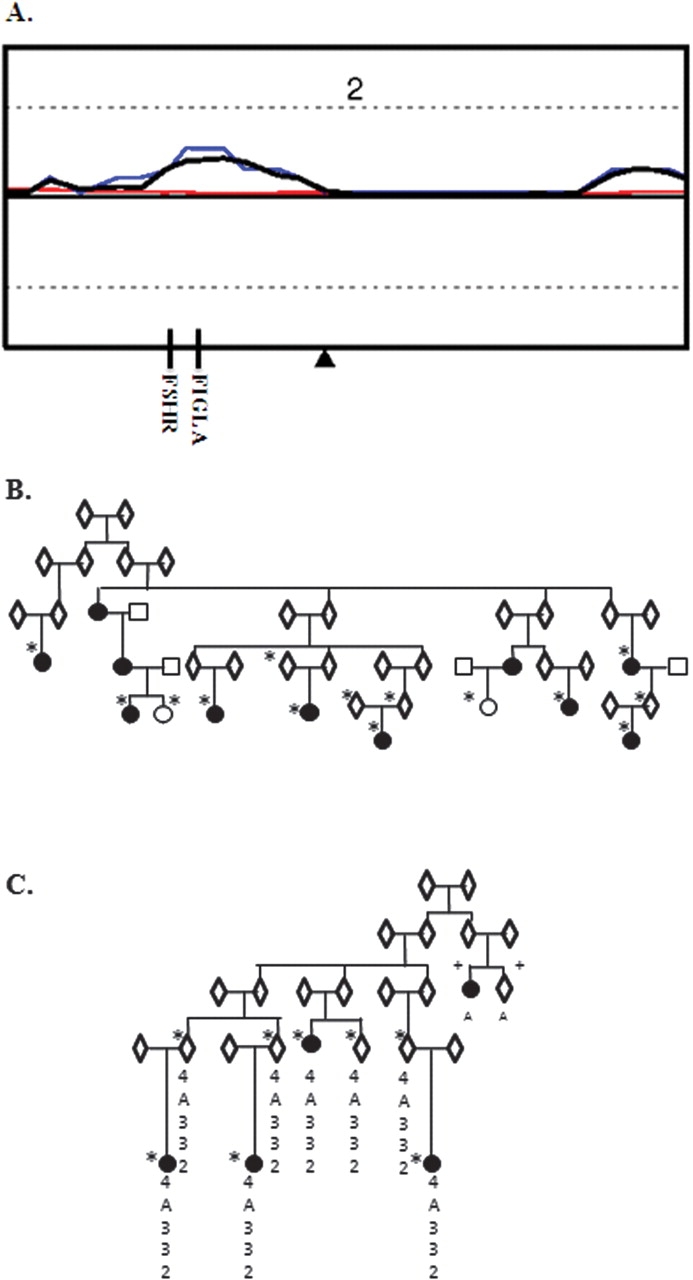
Linkage analyses in two UT DZ twinning families. (A) NPL results for chromosome 2 for the combined families (black), Family 1 (red) and Family 2 (blue). (B) UT Family 1 pedigree structure. (C) Family 2 pedigree structure. Sexes are indicated as ‘unknown’ to anonymize the families. Samples included in the genome scan are indicated by *, samples removed due to excessive genotype failures are indicated by +: the haplotype shared by all sampled MODZTs in Family 2 under the highest linkage peak on chromosome 2 is indicated. The two samples that were removed from the genome scan due to high genotyping failure rates were successfully PCR amplified and sequenced for the candidate gene screen. These samples were amplified and sequenced twice with no discrepant results.
Candidate gene screening
The four sampled MODZT from UT Family 2 shared a haplotype comprised of alleles shared identical by descent at four microsatellite markers covering chromosome 2 from ∼48–85 Mb (Fig. 3). This region included two potential candidate genes—FSHR and FIGLA, an oocyte specific transcription factor for which mutations have been found in a small number of women with primary ovarian failure (Zhao et al., 2008b). The 5′ and 3′ UTRs, exons and intron–exon boundaries, including at least 50 bases of intronic sequence to cover exonic splice sites, were sequenced for all five MODZT sampled in this family. We identified no novel variants in either gene, but three common variants segregated with the DZ twinning phenotype. Two of the variants were in exon 3 of FIGLA and were in complete linkage disequilibrium with each other, a non-synonymous G to C change causing an amino acid substitution of serine by threonine at position 141 (rs7566476) and a synonymous C to T change causing no change to the histidine at position 184 (rs7566541). In silico analyses of the p.S141T change using the programs SNPs3D (http://www.snps3d.org) and PMut (http://mmb2.pcb.ub.es:8080/PMut/) indicated this would have no effect on the function of the protein.
The third variant to segregate with DZ twinning in UT Family 2 was the G to A change in the 5′ UTR of FSHR located 29 bases from the start of exon 1 (rs1394205). This variant was present in both heterozygous and homozygous form in all sampled MODZT in this family, segregating with the microsatellite haplotype shared by other family members. As rs1394205 is potentially functional, we screened this variant in the four other UT families. Although present in both heterozygous and homozygous form this allele did not segregate with DZ twinning in any of the other four UT families.
Discussion
We report the largest genome-wide linkage scan to date to search for the gene or genes contributing to variation in DZ twinning. Although multiple ovulation is the more biologically relevant phenotype, given that heritability estimates of ovulation rates are higher than estimates calculated for twinning rate in sheep (Matos et al., 1997), we have studied families of MODZT as there are currently no reliable, non-invasive methods for measuring the number of oocytes released per cycle in humans that could be used in large epidemiology or genetic studies. Nevertheless, our analysis of 523 families including 1115 MODZT collected from Australia and New Zealand and NL identified a number of linkage peaks in the combined ANZ/NL dataset, one on chromosome 6 very close to the threshold for significant linkage, as well as linkage peaks specific to each cohort. Restricting the analyses to subgroups of families where at least one MODZT was <30 years of age at the birth of her twins, where multiple ovulation is more likely due to genetic influences than age, produced the highest linkage peaks on chromosome 1, although ordered subset analyses suggested these to be chance findings. Analyses of larger families, including one family collected in UT, USA, revealed family specific linkage peaks at additional chromosomal locations, some of which occurred directly over known candidate genes. Together our results suggest new candidate loci that may harbour common or rare genetic variants that play a role in familial DZ twinning, and highlight the complex and heterogeneous nature of inheritance underlying this trait, in agreement with previous studies (Palmer et al., 2006).
A previous linkage scan for genes contributing to DZ twinning in 14 large Flemish families reported peaks on chromosomes 2, 7 and 18 with maximum heterogeneity LOD scores of 1.41, 1.3 and 1.78, respectively (Derom et al., 2006). There was some evidence for linkage to the same region on chromosome 2 in the NL cohort, and on chromosome 7 for both the ANZ and NL cohorts, but no evidence for linkage on chromosome 18, where expLOD scores for the combined dataset and separate country cohorts were all negative. Likewise, LOD scores for our peak linkage regions were either extremely low (e.g. chromosome 6) or negative (e.g. chromosomes 1, 9, 12, 16 and 20) in the Flemish families (Derom et al., 2006).
In our combined ANZ/NL dataset, the highest linkage peak was found at the telomeric end of the long arm of chromosome 6, with a LOD score very close to the threshold for significant linkage, with additional suggestive linkage peaks on chromosomes 7, 9 and 16. Given that the simulations we performed indicated that only one expLOD score ≥1.670 (our threshold for suggestive linkage) was expected by chance in 1000 replicates, our data suggest the presence of multiple loci contributing to DZ twinning. Including families from populations with different demographic histories can be problematic if the frequencies of both the marker and disease alleles are different (Holliday et al., 2008), although previous studies did not detect large differences between the Australian and Dutch populations (Sullivan et al., 2007). We attempted to control for this by first removing all SNP loci with significantly different minor allele frequencies between populations before we combined the ANZ and NL cohorts. Next, as we expected DZ twinning to be genetically heterogeneous, we performed linkage analyses in MERLIN modelling for locus heterogeneity but these did not change or improve the linkage scores (data not shown). Additionally, families in both the ANZ and NL cohorts contributed to the combined linkage peaks, suggesting that the linkage signals were not confounded by problems due to population stratification. Interestingly, we note that the gene FAM120B (family with sequence similarity 120B) is located under the chromosome 6 peak. FAM120B is a co-activator of PPARG and estrogen receptor 1 (ESR1), and therefore may be a potential candidate gene for DZ twinning.
There are no obvious candidates in the other suggestive linkage regions, although there are potential candidates under other cohort-specific peaks. The highest peak in the NL cohort was located on chromosome 12. A potential candidate gene here is protein tyrosine phosphatase, non-receptor type 11 (PTPN11), which has a suggested role in oogenesis in Drosophila melanagaster and Caenorhabditis elegans (Perkins et al., 1996; Gutch et al., 1998). Involvement of this gene with human ovulation is suggested by reports of PTPN11 mutations in Noonan's syndrome, in which some families also contain DZ twins (Jamieson et al., 1994; Schollen et al., 2003), whereas male Noonan's patients have impaired Sertoli cell function (Marcus et al., 2008).
The highest linkage peak for the ANZ cohort was on chromosome 20, however, the peak on chromosome 1 increased in the combined, ANZ and NL cohorts when the analysis was restricted to families where at least one MODZT had her first set of twins before 30 years of age, the point at which age effects on ovulation typically become significant (Bulmer, 1970; Picard et al., 1989). Although this appears to be a chance finding in the combined dataset, most likely due to the reduced number of families included in the analysis, the large number of genes covered by this linkage peak includes kisspeptin 1 (KISS1), which together with its receptor KISS1R now appear to have a central role in the onset of puberty (Sills and Walsh, 2008). Together, our results suggest a number of chromosomal regions that may harbour new candidate loci for DZ twinning in humans.
Other possible candidates for DZ twinning genes include those encoding proteins with roles in the complex regulatory network within the hypothalamic–pituitary–ovarian axis, follicle-stimulating hormone beta polypeptide (FSHB) and its receptor FSHR, and luteinizing hormone receptor (LHCGR). Our results show no evidence of linkage to currently suggested candidates with the possible exception of PPARG on chromosome 3 for the NL cohort. Busjahn et al. (2000) previously reported linkage to PPARG in 181 DZ twin pairs, however, a follow-up study by Duffy et al. (2001) found no evidence for linkage to this region in five Australian and Dutch cohorts including >1200 DZ twins and 203 MODZTs, suggesting no association to either the multiple ovulation event or survival of a twin pregnancy that together result in the birth of DZ twins. Additional candidates include the ovary specific genes GDF9 and BMP15. Rare mutations in GDF9 contribute to DZ twinning in a small number of families (Montgomery et al., 2004; Palmer et al., 2006) but our results, like those of Derom et al. (2006), suggested no linkage to chromosome 5 or the chromosomal regions harbouring other genes from this pathway.
We have demonstrated that rare population and/or family specific variants in DZ twinning are likely to be important by our earlier work on the GDF9 gene, encoding a protein expressed by the oocyte in several species (McGrath et al., 1995; Bodensteiner et al., 1999). Heterozygous mutations in GDF9 and in another closely related member of the TGFβ family, BMP15, dramatically increase twinning rates in sheep (Hanrahan et al., 2004; Monteagudo et al., 2009). To date, two heterozygous loss-of-function mutations in GDF9 exon 1 located in the prepro region of the protein have been found in human MODZT: a 4 bp deletion in an ASP from a Dutch family (Montgomery et al., 2004) and a 2 bp deletion in ASPs from two unrelated Australian families (Palmer et al., 2006). One of the sisters carrying the 2 bp deletion had three sets of DZ twins while the three others had twins as well as singleton pregnancies, demonstrating that loss-of-function mutations in this gene can be of large effect although the overall penetrance is incomplete (Palmer et al., 2006).
The presence of additional family specific mutations of large effect is suggested by results presented here for some of our larger DZ twinning families. Several families showed single family specific linkage peaks distinct from peaks seen in their respective country cohorts. Most notably, two NL families had linkage peaks directly over the INHBB gene, while UT Family 2 produced a single linkage peak in the region of the FSHR and FIGLA genes on chromosome 2. No variants were found in the mature peptide region of the INHBB gene for either of the NL families investigated. Any potential variants contributing to DZ twinning in these families may lie in non-coding exonic or intronic sequence in the region surrounding INHBB, or perhaps in another gene entirely.
Although the three variants that segregated with DZ twinning in UT Family 2 are known polymorphisms, rs1394205 is located in the 5′ untranslated region of FSHR and may be a functional SNP that affects FSHR mRNA transcript and protein levels. Transcriptional activity of the rs1394205 ‘A’ allele has been shown to be significantly lower than that of the ‘G’ allele (56 ± 8%, P = 0.001) (Nakayama et al., 2006), and both post-menopausal and reproductive age ‘AA’ genotype carriers have significantly lower levels of serum estradiol than either ‘GA’ or ‘GG’ carriers (Nakayama et al., 2006; Achrekar et al., 2009) and a lower ovarian response, with increased exogenous FSH required to induce ovulation and reduced numbers of both pre-ovulatory follicles and oocytes subsequently retrieved (Achrekar et al., 2009). However, an earlier study had found that the rs1394205 variant had no correlation with either basal serum FSH levels or ovarian response to FSH (Wunsch et al., 2005). Levels of FSH are typically elevated in MODZT (Hoekstra et al., 2008b) and in women with multi-follicular growth (Beemsterboer et al., 2006). Any effect on FHSR responsiveness seems to be most pronounced in ‘AA’ homozygotes. The A allele was present on the shared haplotype and seen in members of UT Family 2 in both homozygous and heterozygous form and did not segregate with DZ twinning in any other UT family. Reduced responsiveness of FSHR at the level of individual follicles may allow more than one follicle to reach maturity. The role of this variant in multiple ovulation and DZ twinning should be further investigated.
Our studies identified a number of peaks of suggestive and highly suggestive linkage, most clearly for chromosome 6 in the total sample, chromosome 1 in the ANZ cohort (particularly when the analysis was restricted to families where at least one MODZT had her twins at <30 years of age) and for chromosome 12 in the NL cohort. Additionally, several families showed family specific linkage peaks. One of these was located over FSHR and the allele for a putative functional promoter variant that reduces FSHR transcriptional activity segregated with the haplotype shared by MODZT in this family. Our data suggest complex inheritance for familial DZ twinning, and together with evidence for rare variants in GDF9 (Palmer et al., 2006), suggest the presence of multiple genetic loci contributing to DZ twinning.
Funding
This work was supported by National Institute of Child Health and Human Development Grant HD042157 and G.W.M. is supported by a Research Fellowship from the Australian National Health and Medical Research Council.
Acknowledgements
We thank Kerry King, Barbara Haddon and Alison MacKenzie for co-ordination of recruitment. We also thank the Multiple Birth Associations of Australia (AMBA) and New Zealand (NZAMBA) for assistance with recruitment and the mothers of twins and their families for participation in the research.
References
- Abecasis GR, Cherny SS, Cookson WO, Cardon LR. GRR: graphical representation of relationship errors. Bioinformatics. 2001;17:742–743. doi: 10.1093/bioinformatics/17.8.742. doi:10.1093/bioinformatics/17.8.742. [DOI] [PubMed] [Google Scholar]
- Abecasis GR, Cherny SS, Cookson WO, Cardon LR. Merlin-rapid analysis of dense genetic maps using sparse gene flow trees. Nature Genet. 2002;30:97–101. doi: 10.1038/ng786. doi:10.1038/ng786. [DOI] [PubMed] [Google Scholar]
- Achrekar SK, Modi DN, Desai SK, Mangoli VS, Mangoli RV, Mahale SD. Poor ovarian response to gonadotrophin stimulation is associated with FSH receptor polymorphism. Reprod Biomed Online. 2009;18:509–515. doi: 10.1016/s1472-6483(10)60127-7. [DOI] [PubMed] [Google Scholar]
- Beemsterboer SN, Homburg R, Gorter NA, Schats R, Hompes PG, Lambalk CB. The paradox of declining fertility but increasing twinning rates with advancing maternal age. Hum Reprod. 2006;21:1531–1532. doi: 10.1093/humrep/del009. doi:10.1093/humrep/del009. [DOI] [PubMed] [Google Scholar]
- Bodensteiner KJ, Clay CM, Moeller CL, Sawyer HR. Molecular cloning of the ovine Growth/Differentiation factor-9 gene and expression of growth/differentiation factor-9 in ovine and bovine ovaries. Biol Reprod. 1999;60:381–386. doi: 10.1095/biolreprod60.2.381. doi:10.1095/biolreprod60.2.381. [DOI] [PubMed] [Google Scholar]
- Boomsma DI, Vink JM, van Beijsterveldt TC, de Geus EJ, Beem AL, Mulder EJ, Derks EM, Riese H, Willemsen GA, Bartels M, et al. Netherlands Twin Register: a focus on longitudinal research. Twin Res. 2002;5:401–406. doi: 10.1375/136905202320906174. doi:10.1375/136905202320906174. [DOI] [PubMed] [Google Scholar]
- Browning BL. FLOSS: flexible ordered subset analysis for linkage mapping of complex traits. Bioinformatics. 2005;22:512–513. doi: 10.1093/bioinformatics/btk012. doi:10.1093/bioinformatics/btk012. [DOI] [PubMed] [Google Scholar]
- Bulmer MG. The Biology of Twinning in Man. Oxford: Oxford University Press; 1970. [Google Scholar]
- Busjahn A, Knoblauch H, Faulhaber HD, Aydin A, Uhlmann R, Tuomilehto J, Kaprio J, Jedrusik P, Januszewicz A, Strelau J, et al. A region on chromosome 3 is linked to dizygotic twinning. Nat Genet. 2000;26:398–399. doi: 10.1038/82515. doi:10.1038/82515. [DOI] [PubMed] [Google Scholar]
- Derom C, Jawaheer D, Chen WV, McBride KL, Xiao X, Amos C, Gregersen PK, Vlietinck R. Genome-wide linkage scan for spontaneous DZ twinning. Eur J Hum Genet. 2006;14:117–122. doi: 10.1038/sj.ejhg.5201522. [DOI] [PubMed] [Google Scholar]
- Di Pasquale E, Beck-Peccoz P, Persani L. Hypergonadotropic ovarian failure associated with an inherited mutation of human bone morphogenetic protein-15 (BMP15) gene. Am J Hum Genet. 2004;75:106–111. doi: 10.1086/422103. doi:10.1086/422103. [DOI] [PMC free article] [PubMed] [Google Scholar]
- Duffy DL, Montgomery GW, Hall J, Mayne C, Healey SC, Brown J, Boomsma DI, Martin NG. Human twinning is not linked to the region of chromosome 4 syntentic with the sheep twinning gene FecB. Am J Med Genet. 2000;100:182–186. doi: 10.1002/ajmg.1255. doi:10.1002/ajmg.1255. [DOI] [PubMed] [Google Scholar]
- Duffy D, Montgomery G, Treloar S, Birley A, Kirk K, Boomsma D, Beem L, de Geus E, Slagboom E, Knighton J, et al. IBD sharing around the PPARG locus is not increased in dizygotic twins or their mothers. Nat Genet. 2001;28:315. doi: 10.1038/91074. doi:10.1038/91074. [DOI] [PubMed] [Google Scholar]
- Ewen KR, Bahlo M, Treloar SA, Levinson DF, Mowry B, Barlow JW, Foote SJ. Identification and analysis of error types in high-throughput genotyping. Am J Hum Genet. 2000;67:727–736. doi: 10.1086/303048. doi:10.1086/303048. [DOI] [PMC free article] [PubMed] [Google Scholar]
- Galloway SM, McNatty KP, Cambridge LM, Laitinen MPE, Juengel JL, Jokiranta S, McLaren RJ, Luiro K, Dodds KG, Montgomery GW, et al. Mutations in an oocyte-derived growth factor gene (BMP15) cause increased ovulation rate and infertility in a dosage-sensitive manner. Nat Genet. 2000;25:279–283. doi: 10.1038/77033. doi:10.1038/77033. [DOI] [PubMed] [Google Scholar]
- Gilfillan CP, Robertson DM, Burger HG, Leoni MA, Hurley VA, Martin NG. The control of ovulation in mothers of dizygotic twins. J Clin Endocrinol Metab. 1996;81:1557–1562. doi: 10.1210/jcem.81.4.8636367. doi:10.1210/jc.81.4.1557. [DOI] [PubMed] [Google Scholar]
- Gutch MJ, Flint AJ, Keller J, Tonks NK, Hengartner MO. The Caenorhabditis elegans SH2 domain-containing protein tyrosine phosphatase PTP-2 participates in signal transduction during oogenesis and vulval development. Genes Dev. 1998;12:571–585. doi: 10.1101/gad.12.4.571. doi:10.1101/gad.12.4.571. [DOI] [PMC free article] [PubMed] [Google Scholar]
- Hanrahan JP, Gregan SM, Mulsannt P, Mullen M, Davis GH, Powell R, Galloway SM. Mutations in the genes for oocyte-derived GDF9 and BMP15 are associated with both increased ovulation rate and sterility in Cambridge and Belclare sheep (Ovis aries) Biol Reprod. 2004;70:900–909. doi: 10.1095/biolreprod.103.023093. doi:10.1095/biolreprod.103.023093. [DOI] [PubMed] [Google Scholar]
- Hauser ER, Watanabe RM, Duren WL, Bass MP, Langefeld CD, Boehnke M. Ordered subset analysis in genetic linkage mapping of complex traits. Genet Epidemiol. 2004;27:53–63. doi: 10.1002/gepi.20000. doi:10.1002/gepi.20000. [DOI] [PubMed] [Google Scholar]
- Hoekstra C, Meijer P, Kluft C, Heutink P, Smit G, de Geus E, Smit JH, van Bruggen A, Montgomery GW, Boomsma DI. Genetics of dizygotic twinning: a feasibility study for a biobank. Twin Res. 2004;7:556–563. doi: 10.1375/1369052042663751. doi:10.1375/1369052042663751. [DOI] [PubMed] [Google Scholar]
- Hoekstra C, Willemsen G, van Beijsterveldt TC, Montgomery GW, Boomsma DI. Familial twinning and fertility in Dutch mothers of twins. Am J Med Genet A. 2008a;146A:3147–3156. doi: 10.1002/ajmg.a.32585. doi:10.1002/ajmg.a.32585. [DOI] [PMC free article] [PubMed] [Google Scholar]
- Hoekstra C, Zhao ZZ, Lambalk CB, Willemsen G, Martin NG, Boomsma DI, Montgomery GW. Dizygotic twinning. Hum Reprod Update. 2008b;14:37–47. doi: 10.1093/humupd/dmm036. doi:10.1093/humupd/dmm036. [DOI] [PubMed] [Google Scholar]
- Holliday EG, Mowry BJ, Nyholt DR. A reanalysis of 409 European-Ancestry and African American schizophrenia pedigrees reveals significant linkage to 8p23.3 with evidence of locus heterogeneity. Am J Med Genet B Neuropsychiatr Genet. 2008;147B:1080–1088. doi: 10.1002/ajmg.b.30722. doi:10.1002/ajmg.b.30722. [DOI] [PubMed] [Google Scholar]
- Jamieson CR, van der Burgt I, Brady AF, van Reen M, Elsawi MM, Hol F, Jeffery S, Patton MA, Mariman E. Mapping a gene for Noonan syndrome to the long arm of chromosome 12. Nat Genet. 1994;8:357–360. doi: 10.1038/ng1294-357. doi:10.1038/ng1294-357. [DOI] [PubMed] [Google Scholar]
- Kruglyak L, Daly MJ. Linkage thresholds for two-stage genome scans. Am J Hum Genet. 1998;62:994–997. doi: 10.1086/301792. doi:10.1086/301792. [DOI] [PMC free article] [PubMed] [Google Scholar]
- Lambalk CB, De Koning CH, Braat DD. The endocrinology of dizygotic twinning in the human. Mol Cell Endocrinol. 1998;145:97–102. doi: 10.1016/s0303-7207(98)00175-0. doi:10.1016/S0303-7207(98)00175-0. [DOI] [PubMed] [Google Scholar]
- Lander E, Kruglyak L. Genetic dissection of complex traits: guidelines for interpreting and reporting linkage results. Nat Genet. 1995;11:241–247. doi: 10.1038/ng1195-241. doi:10.1038/ng1195-241. [DOI] [PubMed] [Google Scholar]
- Landy HJ, Keith LG. The vanishing twin: a review. Hum Reprod Update. 1998;4:177–183. doi: 10.1093/humupd/4.2.177. doi:10.1093/humupd/4.2.177. [DOI] [PubMed] [Google Scholar]
- Lewis CM, Healey SC, Martin NG. Genetic contribution to DZ twinning. Am J Med Genet. 1996;61:237–246. doi: 10.1002/(SICI)1096-8628(19960122)61:3<237::AID-AJMG7>3.0.CO;2-R. doi:10.1002/(SICI)1096-8628(19960122)61:3<237::AID-AJMG7>3.0.CO;2-R. [DOI] [PubMed] [Google Scholar]
- Marcus KA, Sweep CG, van der Burgt I, Noordam C. Impaired Sertoli cell function in males diagnosed with Noonan syndrome. J Pediatr Endocrinol Metab. 2008;21:1079–1084. doi: 10.1515/jpem.2008.21.11.1079. [DOI] [PubMed] [Google Scholar]
- Martin NG, Shanley S, Butt K, Osborne J, O'Brien G. Excessive follicular recruitment and growth in mothers of spontaneous dizygotic twins. Acta Genet Med Gemellol (Roma) 1991;40:291–301. doi: 10.1017/s0001566000003470. [DOI] [PubMed] [Google Scholar]
- Matos CA, Thomas DL, Gianola D, Perez-Enciso M, Young LD. Genetic analysis of discrete reproductive traits in sheep using linear and nonlinear models: II. Goodness of fit and predictive ability. J Anim Sci. 1997;75:88–94. doi: 10.2527/1997.75188x. [DOI] [PubMed] [Google Scholar]
- McGrath SA, Esquela AF, Lee SJ. Oocyte-specific expression of growth/differentiation factor-9. Mol Endocrinol. 1995;9:131–136. doi: 10.1210/mend.9.1.7760846. doi:10.1210/me.9.1.131. [DOI] [PubMed] [Google Scholar]
- Meulemans WJ, Lewis CM, Boomsma DI, Derom CA, Van den Berghe H, Orlebeke JF, Vlietinck RF, Derom RM. Genetic modelling of dizygotic twinning in pedigrees of spontaneous dizygotic twins. Am J Med Genet. 1996;61:258–263. doi: 10.1002/(SICI)1096-8628(19960122)61:3<258::AID-AJMG10>3.0.CO;2-S. doi:10.1002/(SICI)1096-8628(19960122)61:3<258::AID-AJMG10>3.0.CO;2-S. [DOI] [PubMed] [Google Scholar]
- Miller SA, Dykes DD, Polesky HF. A simple salting out procedure for extracting DNA from human nucleated cells. Nucleic Acids Res. 1988;16:1215. doi: 10.1093/nar/16.3.1215. doi:10.1093/nar/16.3.1215. [DOI] [PMC free article] [PubMed] [Google Scholar]
- Monteagudo LV, Ponz R, Tejedor MT, Lavina A, Sierra I. A 17 bp deletion in the Bone Morphogenetic Protein 15 (BMP15) gene is associated to increased prolificacy in the Rasa Aragonesa sheep breed. Anim Reprod Sci. 2009;110:139–146. doi: 10.1016/j.anireprosci.2008.01.005. doi:10.1016/j.anireprosci.2008.01.005. [DOI] [PubMed] [Google Scholar]
- Montgomery GW, Duffy DL, Hall J, Kudo M, Martin NG, Hsueh AJ. Mutations in the follicle-stimulating hormone receptor and familial dizygotic twinning. Lancet. 2001;357:773–774. doi: 10.1016/S0140-6736(00)04164-7. doi:10.1016/S0140-6736(00)04164-7. [DOI] [PubMed] [Google Scholar]
- Montgomery GW, Zhao ZZ, Marsh AJ, Mayne R, Treloar SA, James MR, Martin NG, Boomsma DI, Duffy DL. A deletion mutation in GDF9 in sisters with spontaneous DZ twins. Twin Res. 2004;7:548–555. doi: 10.1375/1369052042663823. doi:10.1375/1369052042663823. [DOI] [PubMed] [Google Scholar]
- Moore RK, Erickson GF, Shimasaki S. Are BMP-15 and GDF-9 primary determinants of ovulation quota in mammals? Trends Endocrinol Metab. 2004;15:356–361. doi: 10.1016/j.tem.2004.08.008. [DOI] [PubMed] [Google Scholar]
- Mukhopadhyay N, Almasy L, Schroeder M, Mulvihill WP, Weeks DE. Mega2: data-handling for facilitating genetic linkage and association analyses. Bioinformatics. 2005;21:2556–2557. doi: 10.1093/bioinformatics/bti364. doi:10.1093/bioinformatics/bti364. [DOI] [PubMed] [Google Scholar]
- Nakayama T, Kuroi N, Sano M, Tabara Y, Katsuya T, Ogihara T, Makita Y, Hata A, Yamada M, Takahashi N, et al. Mutation of the follicle-stimulating hormone receptor gene 5'-untranslated region associated with female hypertension. Hypertension. 2006;48:512–518. doi: 10.1161/01.HYP.0000233877.84343.d7. doi:10.1161/01.HYP.0000233877.84343.d7. [DOI] [PubMed] [Google Scholar]
- Nyholt DR. On the probability of dizygotic twins being concordant for two alleles at multiple polymorphic loci. Twin Res Hum Genet. 2006;9:194–197. doi: 10.1375/183242706776382383. doi:10.1375/twin.9.2.194. [DOI] [PubMed] [Google Scholar]
- Palmer JS, Zhao ZZ, Hoekstra C, Hayward NK, Webb PM, Whiteman DC, Martin NG, Boomsma DI, Duffy DL, Montgomery GW. Novel variants in growth differentiation factor 9 in mothers of twins. J Clin Endocrinol Metab. 2006;91:4713–4716. doi: 10.1210/jc.2006-0970. doi:10.1210/jc.2006-0970. [DOI] [PubMed] [Google Scholar]
- Perkins LA, Johnson MR, Melnick MB, Perrimon N. The nonreceptor protein tyrosine phosphatase corkscrew functions in multiple receptor tyrosine kinase pathways in Drosophila. Dev Biol. 1996;180:63–81. doi: 10.1006/dbio.1996.0285. doi:10.1006/dbio.1996.0285. [DOI] [PubMed] [Google Scholar]
- Pharoah PD, Antoniou A, Bobrow M, Zimmern RL, Easton DF, Ponder BA. Polygenic susceptibility to breast cancer and implications for prevention. Nat Genet. 2002;31:33–36. doi: 10.1038/ng853. doi:10.1038/ng853. [DOI] [PubMed] [Google Scholar]
- Picard R, Fraser D, Hagay ZJ, Leiberman JR. Twinning in southern Israel; secular trends, ethnic variation and effects of maternal age and parity. Eur J Obstet Gynecol Reprod Biol. 1989;33:131–139. doi: 10.1016/0028-2243(89)90205-0. doi:10.1016/0028-2243(89)90205-0. [DOI] [PubMed] [Google Scholar]
- Purcell S, Neale B, Todd-Brown K, Thomas L, Ferreira MA, Bender D, Maller J, Sklar P, de Bakker PI, Daly MJ, et al. PLINK: a tool set for whole-genome association and population-based linkage analyses. Am J Hum Genet. 2007;81:559–575. doi: 10.1086/519795. doi:10.1086/519795. [DOI] [PMC free article] [PubMed] [Google Scholar]
- Rozen S, Skaletsky H. Primer3 on the WWW for general users and for biologist programmers. Methods Mol Biol. 2000;132:365–386. doi: 10.1385/1-59259-192-2:365. [DOI] [PubMed] [Google Scholar]
- Sawcer S, Jones HB, Judge D, Visser F, Compston A, Goodfellow PN, Clayton D. Empirical genomewide significance levels established by whole genome simulations. Genet Epidemiol. 1997;14:223–229. doi: 10.1002/(SICI)1098-2272(1997)14:3<223::AID-GEPI1>3.0.CO;2-6. doi:10.1002/(SICI)1098-2272(1997)14:3<223::AID-GEPI1>3.0.CO;2-6. [DOI] [PubMed] [Google Scholar]
- Schollen E, Matthijs G, Gewillig M, Fryns JP, Legius E. PTPN11 mutation in a large family with Noonan syndrome and dizygous twinning. Eur J Hum Genet. 2003;11:85–88. doi: 10.1038/sj.ejhg.5200915. doi:10.1038/sj.ejhg.5200915. [DOI] [PubMed] [Google Scholar]
- Sills ES, Walsh AP. The GPR54-Kisspeptin complex in reproductive biology: neuroendocrine significance and implications for ovulation induction and contraception. Neuro Endocrinol Lett. 2008;29:846–851. [PubMed] [Google Scholar]
- Sobel E, Lange K. Descent graphs in pedigree analysis: applications to haplotyping, location scores, and marker-sharing statistics. Am J Hum Genet. 1996;58:1323–1337. [PMC free article] [PubMed] [Google Scholar]
- Sullivan PF, Montgomery GW, Hottenga JJ, Wray NR, Boomsma DI, Martin NG. Empirical evaluation of the genetic similarity of samples from twin registries in Australia and the Netherlands using 359 STRP markers. Twin Res Hum Genet. 2007;9:600–602. doi: 10.1375/183242706778025026. doi:10.1375/twin.9.4.600. [DOI] [PubMed] [Google Scholar]
- Wilson T, Wu X-Y, Juengel JL, Ross IK, Lumsden JM, Lord EA, Dodds KG, Walling G, McEwan J, O'Connell AR, et al. Highly prolific Booroola sheep have a mutation in the intracellular kinase domain of bone morphogenetic protein 1B receptor which is expressed in both oocytes and granulosa cells. Biol Reprod. 2001;64:1225–1235. doi: 10.1095/biolreprod64.4.1225. doi:10.1095/biolreprod64.4.1225. [DOI] [PubMed] [Google Scholar]
- Wiltshire S, Cardon LR, McCarthy MI. Evaluating the results of genomewide linkage scans of complex traits by locus counting. Am J Hum Genet. 2002;71:1175–1182. doi: 10.1086/342976. doi:10.1086/342976. [DOI] [PMC free article] [PubMed] [Google Scholar]
- Woo J, Tong S, Campbell MJ, Wallace L, Meagher S, Montgomery GW, Chao F, Chan W, Vollenhoven B. Two corpora lutea seen at 6–3 weeks' gestation infers dizygosity among spontaneous same-sexed dichorionic twins. Twin Res Hum Genet. 2009;12:180–182. doi: 10.1375/twin.12.2.180. doi:10.1375/twin.12.2.180. [DOI] [PubMed] [Google Scholar]
- Wunsch A, Ahda Y, Banaz-Yasar F, Sonntag B, Nieschlag E, Simoni M, Gromoll J. Single-nucleotide polymorphisms in the promoter region influence the expression of the human follicle-stimulating hormone receptor. Fertil Steril. 2005;84:446–453. doi: 10.1016/j.fertnstert.2005.02.031. doi:10.1016/j.fertnstert.2005.02.031. [DOI] [PubMed] [Google Scholar]
- Zhao ZZ, Painter JN, Palmer JS, Webb PM, Hayward NK, Whiteman DC, Boomsma DI, Martin NG, Duffy DL, Montgomery GW. Variation in bone morphogenetic protein 15 is not associated with spontaneous dizygotic twinning. Hum Reprod. 2008a;23:2372–2379. doi: 10.1093/humrep/den268. doi:10.1093/humrep/den268. [DOI] [PMC free article] [PubMed] [Google Scholar]
- Zhao H, Chen ZJ, Qin Y, Shi Y, Wang S, Choi Y, Simpson JL, Rajkovic A. Transcription factor FIGLA is mutated in patients with premature ovarian failure. Am J Hum Genet. 2008b;82:1342–1348. doi: 10.1016/j.ajhg.2008.04.018. doi:10.1016/j.ajhg.2008.04.018. [DOI] [PMC free article] [PubMed] [Google Scholar]