

Abstract
Almost a billion persons lack access to improved drinking water, and diarrheal diseases cause an estimated 1.87 million deaths per year. Sodium dichloroisocyanurate (NaDCC) tablets are widely recommended for household water treatment to reduce diarrhea. Because NaDCC is directly added to untreated water sources, concerns have been raised about the potential health impact of disinfection by-products. This study investigated trihalomethane (THM) production in water from six sources used for drinking (0.6–888.5 nephelometric turbidity units) near Arusha, Tanzania. No sample collected at 1, 8, and 24 hours after NaDCC addition exceeded the World Health Organization guideline values for either individual or total THMs. Ceramic filtration, sand filtration, cloth filtration, and settling and decanting were not effective mitigation strategies to reduce THM formation. Chlorine residual and THM formation were not significantly different in NaDCC and sodium hypochlorite treatment. Household chlorination of turbid and non-turbid waters did not create THM concentrations that exceeded health risk guidelines.
Introduction
The health consequences of inadequate water supplies include an estimated 4 billion cases of diarrhea and 1.87 million deaths each year, mostly among young children in developing countries.1,2 In addition, waterborne diarrheal diseases lead to decreased food intake and nutrient absorption, malnutrition, reduced resistance to infection,3 and impaired physical growth and cognitive development.4 Recently, household drinking water treatment and safe storage options have been recognized as approaches that can reduce disease risk until the longer term goal of universal access to piped, treated water can be attained.5,6 Household water treatment and storage practices can prevent disease, and thereby support poverty alleviation and development goals.
Chlorination was first used for disinfection of public water supplies in the early 1900s, and is one factor that contributed to dramatic reductions in waterborne disease in cities in the United States.7 Chlorine gas, calcium hypochlorite powder, and concentrated or locally produced liquid sodium hypochlorite have historically been the chlorine donors used for water treatment. Sodium dichloroisocyanurate (NaDCC) is an organic compound that disassociates in water to form sodium cyanurate and hypochlorous acid. Use of NaDCC tablets in Bangladesh households was associated with a significant reduction of fecal coliform bacteria in stored drinking water than in controls (2.8 colonies/100 mL versus 604.1 colonies/100 mL).8 Medentech (Wexford, Ireland) is the largest producer of NaDCC tablets worldwide, distributing more than 900 million water purification tablets in 2008 for emergency and development purposes; in total potentially treating greater than 15 billion liters of water.
Although NaDCC has been widely used for emergency response and recreational water treatment, concerns about potential health impacts from sodium cyanurate had precluded approval as a long-term drinking water disinfectant.9 In 2004, NaDCC was approved by the U.S. Environmental Protection Agency for long-term drinking water use.10 In addition, the Joint Food and Agriculture Organization of the United Nations/World Health Organization (WHO) Expert Committee on Food Additives recommended a tolerable daily intake for NaDCC for long-term drinking-water disinfection of 0–2.0 mg/kg of body weight.11,12 This recommendation was formally adopted by the WHO into the Guidelines for Drinking Water Quality in the second addendum to the Third Edition.13
Sodium dichloroisocyanurate offers some advantages over other chlorine-based disinfectants for household water treatment in developing countries, including a shelf life of five years, resistance to degradation from sunlight, single-use packaging, and low weight in distribution. These advantages, in some cases, outweigh the disadvantage of higher cost per liter treated than locally-made sodium hypochlorite solution ($0.033/liter for sodium hypochlorite and $0.08/liter for NaDCC). As access to NaDCC has expanded in developing countries, where many water sources contain suspended and dissolved organic material, some health officials and implementing organizations have expressed concern about the formation of disinfection by-products in NaDCC-treated water and the attendant risk to consumers.
In 1974, it was discovered that hypochlorous acid and hypobromous acid react with naturally occurring organic matter to create four compounds with potential human health effects: chloroform (CHCl3), bromoform (CHBr3), bromodichloromethane (CHCl2Br), and dibromochloromethane (CHClBr2).14 These four compounds are collectively termed trihalomethanes (THMs). Initially, THM research focused on the effects of chloroform. However, further research has shown that chlorination of drinking water leads to the formation of many compounds that may or may not have mutagenic activity. More than 600 water disinfection byproducts have been identified in chlorinated tap water, including haloacetic acids.15 The THMs, and to a lesser extent the haloacetic acids, are currently used as indicator chemicals for all potentially harmful compounds formed by the addition of chlorine to water.
The WHO has established guideline values for the four THMs that are fully protective for cancer and non-cancer effects, based on epidemiologic and laboratory studies establishing a non-linear dose-response relationship between THM analyte and health impact. The guideline values are set below the expected threshold for these effects. Chloroform has been classified as possibly carcinogenic to humans, based on sufficient evidence for carcinogenicity in experimental animals but inadequate evidence in humans.16 The WHO guideline value for chloroform is 300 μg/L (or 300 parts per billion).17 Bromodichloromethane has been classified as probably carcinogenic to humans, with sufficient evidence in animals and inadequate evidence in humans.18 The WHO guideline value is 60 μg/L.19 The International Agency for Research on Cancer of the WHO has classified dibromochloromethane and bromoform as not classifiable in humans for carcinogenicity,18 and the WHO guideline values for both are 100 μg/L.19
The WHO also proposes the use of an additive toxicity guideline value, using a fractionation approach. The sum of the four actual values of the THMs divided by their guideline value should not be greater than one.19 Lastly, the WHO Guidelines specifically state that “Where local circumstances require that a choice must be made between meeting either microbiological guidelines or guidelines for disinfectants or disinfectant by-products, the microbiological quality must always take precedence, and where necessary, a chemical guideline value can be adopted corresponding to a higher level of risk. Efficient disinfection must never be compromised.”20
Most research on THMs has been conducted in water treatment plants in developed countries, analyzing THM formation potential of source waters and mitigation strategies such as the use of alternate disinfectants. The one exception is a 2008 study of household (point-of-use) drinking water treatment with sodium hypochlorite that documented THM concentrations did not exceed WHO individual analyte or additive guideline values 24 hours after sodium hypochlorite addition in waters with 4.23–305 nephelometric turbidity units (NTU) in Kenya.21 However, NaDCC was not tested. Previous research on THM formation with NaDCC has been limited. In Seine River water of 3–4 NTU, added NaDCC concentrations leading to chlorine residuals of 3.8–10 mg/L had chloroform concentrations of 2–21.7 μg/L 24 hours after treatment.22 Other THM analytes were not tested. In a study from the food industry, as added NaDCC concentration increased, leading to chlorine residuals of 6.98–210.11 mg/L, corresponding increases in THM concentrations did not occur, regardless of how the water was chlorinated before NaDCC addition.23 However, the THM concentrations increased with similarly increased sodium hypochlorite residuals. The utility of this data for household drinking water treatment is limited because the maximum household added hypochlorite concentration used would be 5 mg/L and water is unlikely to be chlorinated before NaDCC addition in developing countries.
In this report, we compare WHO THM Guidelines with THM levels formed by sodium dichloroisocyanurate and sodium hypochlorite disinfection of water from a variety of sources with varying turbidity levels in rural western Tanzania.
Methods
Setting.
This study was conducted in May 2008 in areas surrounding Arusha, Tanzania that are targeted by Filter Pure (Arusha, Tanzania) for ceramic filter promotion because of high source water turbidity.
Water collection and treatment procedures.
Source water was collected in eight cleaned 20-liter plastic jerry cans from each source the day before analysis occurred. A total of six representative water sources, including a river, lake, public tap, private lake, open well, and borehole connected to a tap, were analyzed over a four-day period (Figure 1). All study water sources were used for drinking by local communities.
Figure 1.
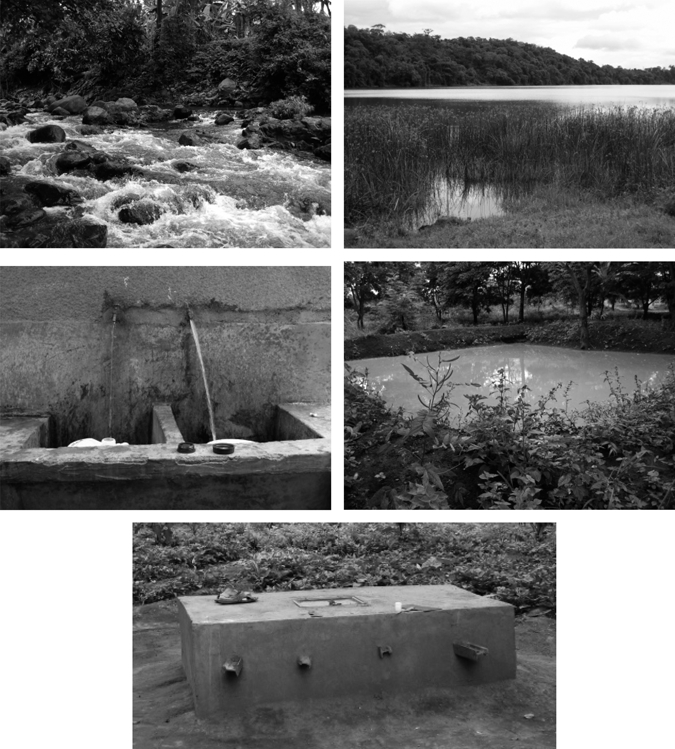
Water sources in study in Tanzania (clockwise from top left: river, pond, private pond, open well, borehole with tap). Public tap not pictured.
The eight household water treatments completed with the collected water are detailed in Table 1 and included 1) addition of WaterGuard brand sodium hypochlorite for comparison to previous study;21 2) addition of Aquatabs brand NaDCC; 3) addition of an experimental flavored Aquatabs NaDCC; 4) addition of trial flocculant/disinfectant Aquatabs aluminum sulfate and NaDCC tablet in 1.5-liter polyethylene terephthalate (PET) bottles; 5) filtration through a simple sand filter before NaDCC addition; 6) filtration through a ceramic filter before NaDCC addition; 7) filtration through a cloth filter before NaDCC addition; and, 8) settling for 12 hours and decanting supernatant water before NaDCC addition. All hypochlorite addition occurred in 20-liter jerry cans except where noted.
Table 1.
Water storage, clarification, and treatment procedures completed for each of six water sources, Tanzania
| Treatment* | Container size (liters) | Water clarification procedure | Disinfection procedure |
|---|---|---|---|
| 1 | 20 | None | Sodium hypochlorite |
| 2 | 20 | None | Sodium dichloroisocyanurate |
| 3 | 20 | None | Sodium dichloroisocyanurate |
| 4 | 1.5 | Aluminum sulfate/sodium dichloroisocyanurate tablet | |
| 5 | 20 | Filtered through simple sand filter | Sodium dichloroisocyanurate |
| 6 | 20 | Filtered through ceramic filter | Sodium dichloroisocyanurate |
| 7 | 20 | Filtered through locally-available cloth | Sodium dichloroisocyanurate |
| 8 | 20 | Settled for 12 hours and decanted | Sodium dichloroisocyanurate |
1 = addition of WaterGuard brand sodium hypochlorite; 2 = addition of Aquatabs brand NaDCC; 3 = addition of an experimental flavored Aquatabs sodium dichloroisocyanurate (NaDCC); 4 = addition of trial flocculant/disinfectant Aquatabs aluminum sulfate and NaDCC tablet in 1.5-liter polyethylene terephthalate bottles; 5 = filtration through a simple sand filter before NaDCC addition; 6 = filtration through a ceramic filter before NaDCC addition; 7 = filtration through a cloth filter before NaDCC addition; 8 = settling for 24 hours and decanting supernatant water before NaDCC addition.
The hypochlorite concentration used in the above treatments was 2 mg/L for clear water (turbidity < 10 NTU or from a protected source) and 4 mg/L for turbid waters (turbidity > 10 NTU from an unprotected source) for the NaDCC, and 1.875 mg/L for clear water (as defined above, 1 cap) and 3.75 mg/L (2 caps) for turbid water for sodium hypochlorite.24 Single doses were added to the tap, open well, and borehole samples. Double doses were added to the river, lake, and pond sources. The double dose was used in the 5.1 NTU river source despite the < 10 NTU turbidity to represent worst-case THM formation potential because users might double-dose an unprotected source.
Plastic jerry cans used for water storage were purchased locally. WaterGuard sodium hypochlorite solution distributed by Population Services International was obtained locally, and tested to ensure correct concentration with a portable iodometric digital titration kit (Hach, Loveland, CO) for high-range total chlorine using Method 8209. The three types of Aquatabs tablets were provided by Medentech to the researchers and transported to Tanzania, including 1) standard 67-mg Aquatab NaDCC tablet; 2) an experimental Aquatab 67-mg NaDCC flavored tablet; and 3) an experimental Aquatab flocculant tablet containing aluminum sulfate and NaDCC. The first two types of tablets were added to 20 liters of water and allowed to dissolve. The flocculant tablet was added to 1.5 liters of water in a clean PET water bottle, capped, and shaken for 1 minute. The mixture was uncapped and allowed to settle for 4 minutes, shaken for 10 seconds, and let sit uncapped for 15 minutes. The top layer was decanted into a clean 1.5-liter PET water bottle.
The simple sand filter was constructed in a 15-liter bucket (Figure 2) and was composed of a three-inch layer of gravel beneath a nine-inch layer of sand. Sand and gravel were chosen based on local availability at the ceramics facility and were rinsed with tap water before use until the water ran clear. Approximately three inches of head space was available above the sand layer, and a spigot was installed approximately two inches from the bottom of the bucket. Note that sand filters used in this study were simply sand filters. They were not biosand filters, a specific household water treatment filter that includes a biologically active schmutzdecke layer to assist in removal of microbiologic contaminants.
Figure 2.
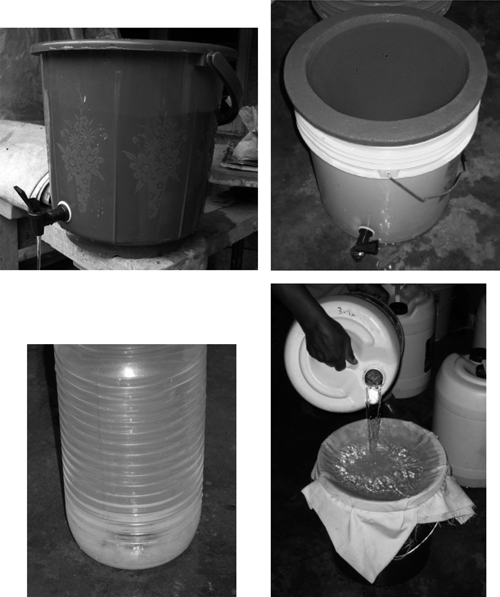
Treatment methods used in Tanzania (clockwise from left: simple sand filtration, ceramic filtration, cloth filtration, Medentech flocculation/disinfection tablet)
The ceramic filters used in the study were manufactured by Filter Pure, using a mixture of clay soil, sawdust, water, and colloidal silver. The mixture was pressed into a round-bottom filter, air-dried, and fired in a kiln at a gradually increasing temperature eventually reaching 900–950°C. Fired filters were placed in buckets fitted with a plastic spigot (Figure 2). Water filtered through the filter was poured into a clean jerry can before chlorine addition.
A commonly available cloth was used for filtration (Figure 2). For the settling/decanting testing, the 20 liters of water were allowed to stand for 12 hours. Eighteen liters of the supernatant water were then decanted into a clean jerry can, taking care not to resuspend any settled solids.
Water testing procedures.
Before any potential mitigation strategy or treatment, the sample water was first analyzed for turbidity, pH, conductivity, and free and total chlorine. A total organic carbon (TOC) sample was collected in a glass container, acidified, and stored on ice for later analysis.
At 1 hour, 8 hours, and 24 hours after chlorine addition, free and total chlorine was measured in each sample, and a THM sample was collected and stored on ice for later analysis. Based on extensive prior literature documenting absence of microbiologic indicators in water with chlorine residual, total coliform and Escherichia coli were not analyzed in this study.25–28
Turbidity was measured with a 2020 turbidimeter (LaMotte Company, Chestertown, MD) calibrated weekly with non-expired stock calibration solutions. The pH and conductivity were measured with a multimeter (Hanna Instruments Ltd., Bedfordshire, United Kingdom) calibrated weekly with non-expired stock calibration solutions. Free and total chlorine was measured immediately after collecting samples using a 1200 single wavelength chlorine colorimeter (LaMotte Company) and DPD-1 and DPD-3 tablets. The meter was calibrated daily using non-expired stock calibration solutions from 0 to 2.65 mg/L.
Water samples for total organic carbon analysis were collected in glass containers, acidified to a pH of < 2.0, stored below 6°C, and delivered to Analytical Services, Incorporated (Norcross, GA) within two weeks of collection. Method 9060 (using a carbonaceous analyzer to convert the carbon to gas) of the Environmental Protection Agency (Washington, DC) was used to analyze the samples, and all laboratory quality control guidelines were met.
Trihalomethane sampling.
Water samples for THM analysis were collected into a pre-cleaned 40-mL glass vial and immediately transferred into a pre-cleaned 12-mL glass vial containing 125 μL of a buffer-quench solution.29 The 12-mL vial was slightly overfilled to create an inverted meniscus and avoid air bubbles. The sample vials were then sealed with Teflon-lined silicone septa and stored in a chilled (4–8°C) and dark location before shipping. Samples were stored no longer than two weeks before shipment to the Division of Laboratory Sciences of the Centers for Disease Control and Prevention (Atlanta, GA) for THM analysis.
Water samples were analyzed for THMs (chloroform, bromodichloromethane, dibromochloromethane, and bromoform) using stable isotope dilution headspace SPME GC-MS.29 Briefly, water vials were removed from refrigerated storage and allowed to equilibrate to room temperature before analysis. Immediately after removal of the vial cap, water (5.0 mL) was removed using a pre-cleaned gas-tight syringe and transferred into a SPME headspace vial. Stable isotope labeled analog solution was added to the sample and the SPME vial immediately crimp-sealed using Teflon-lined septum.
We then analyzed samples using solid phase microextraction/gas chromatography–mass spectrometry (SPME/GC-MS) on a TraceMS (ThermoFisher, Austin, TX) attached to a Trace 2000 gas chromatograph equipped with a split/splitless injector and operated in the splitless mode. Because of the volatility of the THMs, a cryo-trap (model 961; Scientific Instrument Services, Ringoes, NJ) was used to cryofocus the analytes at the head of the GC column. Volatile organic compounds were chromatographically separated on a VRX capillary column (30 m × 0.25 mm internal diameter × 1.4 μm film; Restek, Bellefonte, PA) during a thermal gradient from 20°C to 200°C. Automated sampling was done using a CombiPAL autosampler (CTC Analytics AG, Zwingen, Switzerland) equipped with a 75-μm carboxen/polydimethylsiloxane/divinylbenzene SPME fiber assembly and heated/agitated headspace extraction (8 minutes for 500 rpm at 50°C). The fiber was promptly desorbed by insertion into the hot GC inlet (200°C). The mass spectrometer was equipped with an electron impact source and run in the selected ion monitoring mode at unit mass resolution. Xcalibur Quan software (ThermoFisher) was used for peak integration, calibration, and quantification. We integrated peaks with the integrated collaborative information systems integrator and confirmed by visual inspection. We calculated relative response factors on the basis of the relative peak areas of analyte quantitation ion and labeled analog ion. Quality control consisted of daily analysis of blind quality control material and pure water blanks. Trihalomethanes were quantified by comparing the ratios of analyte peak areas with labeled analog areas for both unknowns and freshly prepared calibrators.
Results
Source water quality.
All six source water samples were tested for chemical water quality parameters on the day of testing before any treatment was initiated (Table 2). The pH averaged 7.6, with no sample exceeding the WHO recommended value for chlorination alone treatment (maximum pH = 8.0).19 Conductivities ranged from 86 to 525 μS/cm. The TOC also had a large range, from 0 to 9.8 mg/L (SD = 3.7). Turbidity had a large range (0.6–888.5 NTU, SD = 360.6). However, only one sample was in the 10–100 NTU range normally used for a double chlorine dose. Turbidity and TOC were not correlated (R2 = 0.10).
Table 2.
Source water physical and chemical characteristics, Tanzania*
| Characteristic | Source 1: River | Source 2: Lake | Source 3: Tap | Source 4: Pond | Source 5: Open Well | Source 6: Borehole |
|---|---|---|---|---|---|---|
| Turbidity (NTU) | 5.1 | 18.7 | 0.6 | 888.5 | 1.9 | 0.9 |
| TOC (mg/L) | 2 | 9.8 | 0.6 | 5.6 | 0.7 | 0.9 |
| pH | 7.8 | 7.8 | 7.5 | 7.7 | 7.3 | 7.4 |
| Conductivity (μmhos/cm) | 86 | 393 | 238 | 397 | 522 | 525 |
| Free chlorine (mg/L) | BDL | BDL | 0.17 | BDL | BDL | BDL |
| Total chlorine (mg/L) | BDL | BDL | 0.18 | BDL | BDL | BDL |
NTU = nephelometric turbidity units; TOC = total organic carbon; BDL = below detection limit.
Quality control.
Duplicate sampling was conducted for each water quality parameter tested. Analysis of duplicate samples indicated a high degree of precision for all tests performed, with data easily meeting high quality control standards of below a 10% allowable relative percent different (RPD) (Table 3). The RPD of duplicate free (n = 16) and total (n = 14) chlorine samples were 4.7% and 2.9%, respectively. Duplicate turbidity measurements had an RPD (n = 11) of 5.9%. The pH (n = 8) and conductivity (n = 7) duplicate RPD were 0.39% and 0.73%, respectively. The RPDs of duplicate individual analyte THM samples (n = 19–35) ranged from 1.45% to 2.5%.
Table 3.
Quality control for water quality parameters, Tanzania
| Characteristic | Total samples collected | No. (%) of duplicated samples | Relative percent difference |
|---|---|---|---|
| Free chlorine | 150 | 16 (10.7) | 4.70 |
| Total chlorine | 150 | 14 (9.3) | 2.93 |
| Turbidity* | 45 | 11 (24.4) | 5.90 |
| pH* | 44 | 8 (18.2) | 0.39 |
| Conductivity* | 42 | 7 (16.7) | 0.73 |
| Trihalomethanes | 152 | 36 (23.7) | |
| Chloroform | 152 | 23 (15.1)† | 1.95 |
| Bromodichloromethane | 152 | 35 (23.0) | 1.55 |
| Dibromochloromethane | 152 | 32 (21.5) | 2.50 |
| Bromoform | 152 | 19 (12.5) | 1.45 |
Not all 48 possible tested because of laboratory timing.
Number of duplicates varies between trihalomethane analytes because of dropping duplicate samples collected when one or both samples were below the detection limit.
Overall data.
Post-treatment water sample THM concentrations from all treatment methods are shown in Table 4. The average chloroform concentration was 18.9 μg/L (range = < 4.0–97.6 μg/L, SD = 20.9 μg/L) across all samples. The average bromodichloromethane concentration was 3.8 μg/L (range = < 0.6–17.8 μg/L, SD = 3.5 μg/L). The average chlorodibromomethane concentration was 1.6 μg/L (range = < 0.1–7.3 μg/L, SD = 1.3 μg/L). The average concentration for the four THMs was 0.3 μg/L (range = < 0.1–1.2 μg/L, SD = 0.3 μg/L). No sample exceeded the WHO guideline values for any of the four THMs. Samples below the detection limits of 4.0, 0.6, 0.1, and 0.1 μg/L for chloroform, bromodichloromethane, chlorodibromomethane, and bromoform, respectively, were imputed as the detection limit divided by radical 2 for analysis and averaging purposes. The WHO additive ratio guideline was also not exceeded: ratios ranged from 0.018 to 0.666, with an average of 0.144 and an SD of 0.114.
Table 4.
Individual analyte trihalomethane results, all samples, Tanzania*
| Characteristic | Average (ppb, μg/L) | Minimum (ppb, μg/L) | Maximum (ppb, μg/L) | Standard deviation (ppb, μg/L) | World Health Organization guideline value (ppb, μg/L) |
|---|---|---|---|---|---|
| Chloroform | 18.9 | < 4.0 | 97.6 | 20.9 | 300 |
| Bromodichloromethane | 3.8 | < 0.6 | 17.8 | 3.5 | 60 |
| Dibromochloromethane | 1.6 | < 0.1 | 7.3 | 1.3 | 100 |
| Bromoform | 0.3 | < 0.1 | 1.2 | 0.3 | 100 |
ppb = parts per billion.
The relative percentage of each individual THM analyte by source is shown in Table 5. Most (95.0%) river water THMs was chloroform. Lake and pond water also had mostly chloroform (78.7% and 73.9%, respectively), but had a non-negligible percentage of bromodichloromethane (18.2% and 20.1%, respectively). In the groundwater sources (tap, open well, and borehole), we did not calculate analyte percentages because many chloroform results were below the detection limit, although the other three analytes were present above their detection limits.
Table 5.
Average trihalomethane analyte percentage and concentration by source, Tanzania
| Source | Chloroform | Bromodichloromethane | Dibromochloromethane | Bromoform |
|---|---|---|---|---|
| River | 95.0%, 47.1 μg/L | 4.6%, 2.3 μg/L | 0.2%, 0.1 μg/L | 0.1%, 0.1 μg/L |
| Lake | 78.7%, 24.4 μg/L | 18.2%, 5.6 μg/L | 2.8%, 0.9 μg/L | 0.2%, 0.1 μg/L |
| Tap* | –, 4.1 μg/L | –, 1.7 μg/L | –, 1.2 μg/L | –, 0.3 μg/L |
| Pond | 73.9%, 33.4 μg/L | 20.1%, 9.1 μg/L | 5.7%, 2.6 μg/L | 0.2%, 0.1 μg/L |
| Open well* | –, 4.5 μg/L | –, 2.6 μg/L | –, 2.8 μg/L | –, 0.7 μg/L |
| Borehole* | –, 4.8 μg/L | –, 2.2 μg/L | –, 1.8 μg/L | –, 0.4 μg/L |
Percentages not included for these sources because all average analyte concentrations were below the 4.0 μg/L minimum detection limit for chloroform.
For simplicity in the following analysis by treatment method, all results will be total THMs (TTHMs). Results from all treatments in each source are shown in Figure 3. A general trend of increasing TTHM concentration from 1 to 24 hours was seen in almost all samples. The maximum TTHM concentration 24 hours after treatment in the three groundwater sources (tap, open well, and borehole) was 28.5 μg/L in the sand-filtered borehole water. The maximum TTHM concentration across all samples was 119.8 μg/L in the flocculant/disinfectant tablet in pond water. To reduce turbidity in this sample, two tablets were used. Thus, this sample had a correspondingly higher added dichloroisocyanurate concentration.
Figure 3.
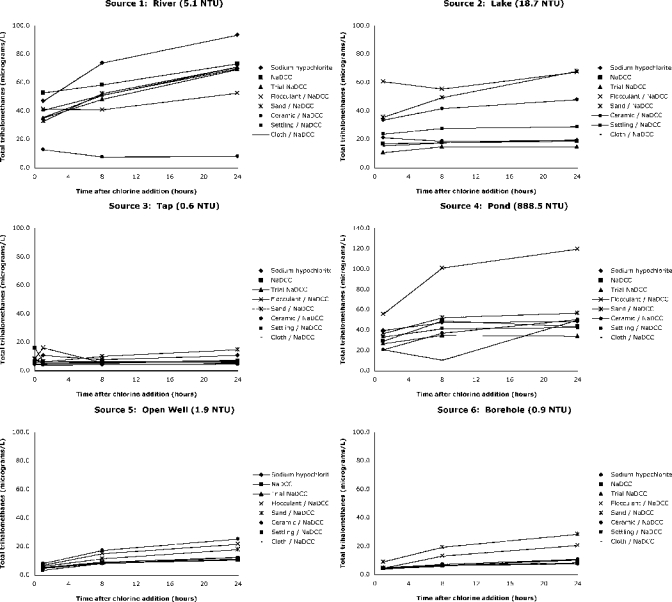
Total trihalomethane concentration over 24 hours in six sources with eight treatments, Tanzania.
Chlorination results.
The free chlorine residual concentration was maintained in all but the pond source for 24 hours in all samples (Figure 4). River, lake, open well, and borehole water residual levels were within the appropriate range (< 2.0 to > 0.2 mg/L) with all three treatments (sodium hypochlorite, NaDCC, and experimental NaDCC). Values were slightly higher in tap water when two NaDCC tablets were used, likely because of presence of pre-treatment chlorine residual. Chlorine residual was slightly less in sodium hypochlorite–treated samples than in NaDCC-treated samples, even after accounting for the slightly lower sodium hypochlorite concentration. This difference was not significant by Wilcoxon rank sum text (P = 0.69).
Figure 4.
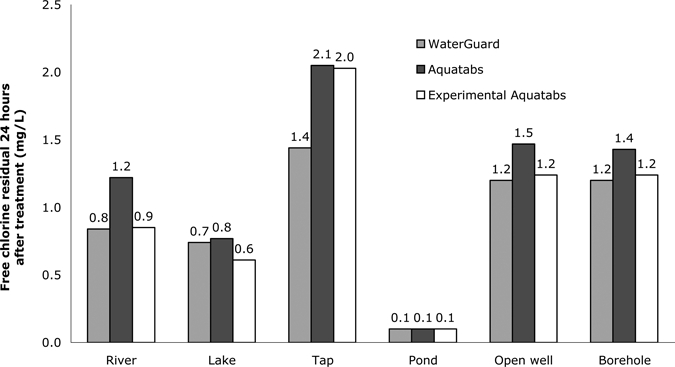
Chlorine residual concentration after 24 hours in waters treated with chlorination-only options, Tanzania.
No chlorination only sample exceeded any of the WHO guideline values for the four THMs up to 24 hours after chlorine addition. The average TTHM concentration in sodium hypochlorite–treated samples 24 hours after treatment was 31.8 μg/L (range = 7.7–93.6 μg/L, SD = 33.7 μg/L), and the average TTHM concentration in NaDCC-treated samples was 27.0 μg/L (range = 6.8–73.3 μg/L, SD = 26.4 μg/L). This difference was not statistically significant (P = 0.52). The average TTHM concentration in the experimental flavored NaDCC was 24.0 μg/L (range = 6.9–69.2 μg/L, SD = 24.3 μg/L).
The values for the additive guideline at 24 hours ranged from 0.074 to 0.365 μg/L, 0.061 to 0.301 μg/L, and 0.063 to 0.275 μg/L in the sodium hypochlorite-, NaDCC-, and experimental NaDCC-treated waters, respectively. River water samples had the highest additive values for sodium hypochlorite and experimental NaDCC treatments, and pond water had the highest value for NaDCC treatment. Tap water had the lowest value in all three treatments.
Potential mitigation strategies results.
As described in the Methods, five pre-treatment strategies to potentially mitigate THM production were tested in each of the six water sources: 1) the Medentech flocculant/disinfection tablet, 2) sand filtration, 3) ceramic filtration, 4) cloth filtration, and, 5) settling and decanting.
The Medentech flocculant/disinfectant tablet increased turbidity (from 0.4–17.3 NTU to 17.5–30 NTU) in five of the six sources (Table 6). In the highly turbid pond source, the use of two tablets reduced turbidity 60.7% from 861 to 338 NTU. Sand filtration increased turbidity (from 0–4.6 NTU to 7.0–15.4 NTU) in the four lowest turbidity sources, and reduced turbidity by 25.6% and 27.0%, in the lake and pond sources. Ceramic filtration reduced turbidity in all samples except in tap water with an NTU of 0.53. The efficacy of ceramic filtration increased as initial turbidity increased. Cloth filtration or settling and decanting did not significantly reduced turbidity in any of the water samples.
Table 6.
Turbidity change after treatment with potential mitigation strategy, Tanzania*
| Source | Flocculant/ disinfectant | Simple sand filtration | Ceramic filtration | Cloth filtration | Settling and decanting |
|---|---|---|---|---|---|
| River (5.1 NTU) | 260% | 166% | −47% | −7% | −24% |
| Lake (18.7 NTU) | 73% | −26% | −92% | −8% | −1% |
| Pond (888.5 NTU) | −61% | −27% | −99% | 1% | −17% |
NTU = nephelometric turbidity units. Negative percentages indicate a reduction in turbidity and positive percentages indicate an increase. Tap, open well, and borehole sources not included because of low initial turbidity.
The use of ceramic filtration before NaDCC was associated with a marginally significant reduction of chlorine residual 24 hours after chlorine addition compared with NaDCC only controls (P = 0.075). No other associations between treatment method and chlorine residual were noted.
We tested several locally available strategies for mitigating THM formation (settling and decanting and cloth, sand, and ceramic filtration). None of these treatments consistently reduced THM concentrations in all types of water tested. However, in the river source, ceramic filtration was effective in removing THM precursors, and the NaDCC flocculant/disinfectant tablet increased THM concentrations in the pond source (Figure 3).
Discussion
None of the disinfection methods evaluated in this study resulted in THM concentrations that exceeded individual or additive WHO guideline values. All disinfected water from surface water sources contained more chloroform than other THMs, indicating low bromine in the water supplies, which is consistent with a non-coastal study location. All ground water sources (tap, open well, borehole) had low TTHM concentrations, with a maximum of 28.5 μg/L 24 hours after chlorine addition. By inference, it appears that chloroform did not form the large majority of these samples TTHM concentration, although the relatively higher minimum detection limit of chlorform (4.0 μg/L compared with 0.1–0.6 μg/L) prevented calculation of the individual analyte contribution to TTHM in these sources.
The maximum chloroform value observed (97.6 μg/L) was only approximately 30% of the WHO guideline value (300 μg/L). These results are consistent with previous research on THM formation after sodium hypochlorite addition to turbid waters in developing countries,21 and confirm that appropriate chlorination of household water does not form THM at concentrations in excess of WHO guidelines. This result is not surprising. In contrast to public utilities in the United States and Europe, which devote considerable expense to reducing THM concentrations in their treated water through technology improvements as part of balancing the risk of waterborne disease and reducing disinfection by-products to mitigate potential risks,30 WHO simply considers health effects and health risk to potential users from exposure to a certain compound when developing guideline values.13 The WHO has defined the acceptable risk from the individual THMs as one extra cancer in every 100,000 persons who drink two liters of chlorinated water for 70 years. The WHO guidelines, which are considered separately from the goal of providing highly treated water through infrastructure, are applicable to health-based household chlorination water treatment interventions. The WHO currently does not regulate other disinfection by-products besides THMs, considering THMs to be surrogate compounds for all disinfection by-products in drinking water.
Although average chlorine residual concentration was slightly higher in NaDCC-treated water than in sodium hypochlorite–treated water 24 hours after chlorine addition, the difference was not statistically significant. In addition, this difference was not programmatically significant. The recommended minimum free chlorine residual concentration for household water treatment is 0.2 mg/L 24 hours after chlorine addition. Sodium hypochlorite and NaDCC treatment maintained concentrations above the minimum residual level in all sources except the pond source. There was no incidence where that minimum residual was maintained with one treatment and not with the other treatment. At 888.5 NTUs, the pond source was well above the recommend maximum turbidity (100 NTU) for chlorination-alone treatment and pre-treatment to reduce the turbidity < 100 NTU is recommended before chlorination. Residual chlorine concentration greater than 0.2 mg/L was seen 24 hours after chlorination in pond water samples treated with ceramic filtration and a double dose of flocculant/disinfection tablets.
The experimental flavored Aquatab and the flocculant/disinfectant Aquatab were not effective in increasing chlorine residual concentration 24 hours after chlorine addition or reducing THM formation. The flavoring was not expected to affect chlorine residual concentration or THM formation potential, and these results confirm this finding. The flocculant/disinfectant tablet did not reliably reduce turbidity in these samples, which was an unexpected result because the addition of a flocculant should have reduced turbidity. Medentech is conducting ongoing research to redesign this product using a higher quality flocculant than aluminum sulfate.
Filtration through a cloth, settling for 12 hours and decanting supernatant water, ceramic filtration, and sand filtration did not reduce TTHM concentrations 24 hours after chlorination compared with chlorination alone. Thus, these mechanisms are not effective THM mitigation strategies. These are not unexpected results because THM precursor compounds have been identified as primarily organic carbon particles smaller than 0.45 μm.31 It is unlikely that these gross filtration mechanisms tested in this study would remove such small particles, although ceramic filtration of river water yielded promising results. However, it was important to test these potential mitigation strategies because they 1) are practical and inexpensive strategies available to and used by the populations who are targeted by point-of-use water treatment intervention programs using sodium hypochlorite and sodium dichloroisocyanurate; 2) potentially reduce turbidity and increase user acceptability of chlorination as a treatment option; and 3) potentially decrease chlorine demand and maintain chlorine residual and safe storage for a longer period.
These source waters tested were appropriate for the THM study because they encompassed a wide range of representative developing world water sources. Although the turbidity range of source waters (0.6–888.5 NTU) was appropriate for the THM portion of the study, the distribution (0.6, 0.9, 1.9, 5.1, 18.7, and 888.5 NTU) was not ideal to assess the effectiveness of mitigation strategies at improving water quality. A 2.0 mg/L hypochlorite concentration is recommended for waters < 10 NTU, a 4.0 mg/L concentration for samples 10–100 NTU, and chlorination alone is not recommended in waters with turbidity > 100 NTU.24 Thus, locally available mitigation strategies are most appropriate in the 10–100 NTU range, when chlorination is recommended, but user acceptability is enhanced with a esthetic improvement to the water. Because of the unexpectedly low turbidity in unimproved sources (such as the open well and river) used for drinking water at the time of the study, only one sample was in the 10–100 NTU range. Previous laboratory research investigating the turbidity and chlorine demand reduction of cloth filtration, sand filtration, and settling and decanting in 10–300 NTU waters found all three locally available physical filtration mechanisms were effective in reducing turbidity.32 However, cloth filtration did not reduce turbidity at 10 NTU, but reduced turbidity more effectively as initial turbidity increased to 300 NTU. The cloth filtration turbidity reduction results are consistent with results presented herein, with no turbidity reduction seen in low-turbidity (< 20 NTU) sources.
The use of ceramic filters before chlorination appeared to reduce chlorine residual 24 hours after chlorine addition, although more research is needed to fully characterize this result. Ceramic filters used in this study were recently manufactured, and small particles not removed in firing may have leached into finished water and reacted with the disinfectant, exerting chlorine demand and reducing the free chlorine residual concentration available. Further testing on ceramic filtration before chlorination should use aged filters (as opposed to new filters) to fully characterize the effects of ceramic filtration on free chlorine residual concentration over time.
Further research is needed to 1) develop chemical models to describe THM formation after sodium dichloroisocyanurate addition in the laboratory setting by varying key controlling water quality parameters such as pH, bromide, TOC, and conductivity; and 2) characterize THM formation differences between various chlorine donors. Programmatically, such research might be of limited value because health gains associated with diarrheal disease reduction far outweigh any small potential risk from drinking water with THM concentrations significantly lower than WHO guidelines values. Further research on locally available mechanisms to reduce chlorine demand and turbidity is not indicated in the laboratory setting because this research has already been well established in the literature.32,33 Targeted research in specific locations where household chlorination is promoted with known high concentrations of THM precursors, such as bromine, is indicated. Bromine presence increases the health risks associated with THMs, as brominated THMs, with higher risk and therefore lower guideline values than chloroform, are formed.
Diarrheal diseases kill an estimated 1.8 million persons each year, and point-of-use chlorination options are proven interventions that can reduce diarrheal disease incidence and protect health in developing countries. Concerns have been raised about potential human health effects from disinfection byproducts that form during chlorination of raw water. The data presented herein clearly show that chlorination using sodium dichloroisocyanurate or sodium hypochlorite of turbid and non-turbid waters does not lead to THM concentrations that exceed WHO guideline values. No mitigation strategy tested in this study reduced THM formation potential consistently across source water types. Proper chlorination of household water does not form disinfection byproducts in excess of WHO guideline values and offers a valuable method for reducing diarrheal disease and saving lives in developing countries.
Acknowledgments
We thank Mesiaki Kimirei, Elias Nnko, Omary Bura, Petro William, Ndeshi Sauli, and Baba Juma (Filter Pure, Arusha, Tanzania) for assistance with sample collection and logistical coordination.
Footnotes
Financial support: This study was supported by Medentech, Ltd. and the United States Agency for International Development. A written agreement was signed specifying that the Centers for Disease Control and Prevention could interpret and publish data without influence from Medentech.
Authors' addresses: Daniele S. Lantagne, Enteric Diseases Epidemiology Branch, Centers for Disease Control and Prevention, Atlanta, GA, E-mail: dlantagne@cdc.gov. Fred Cardinali and Ben C. Blount, Division of Laboratory Sciences, National Center for Environmental Health, Centers for Disease Control and Prevention, Chamblee, GA, E-mails: fcardinali@cdc.gov and bblount@cdc.gov.
References
- 1.United Nations Children's Fund . The State of the World's Children: 2008. New York: United Nations Children's Fund; 2007. [Google Scholar]
- 2.Boschi-Pinto C, Velebit L, Shibuya K. Estimating child mortality due to diarrhoea in developing countries. Bull World Health Organ. 2008;86:710–717. doi: 10.2471/BLT.07.050054. [DOI] [PMC free article] [PubMed] [Google Scholar]
- 3.Baqui AH, Black RE, Sack RB, Chowdhury HR, Yunus M, Siddique AK. Malnutrition, cell-mediated immune deficiency, and diarrhea: a community-based longitudinal study in rural Bangladeshi children. Am J Epidemiol. 1993;137:355–365. doi: 10.1093/oxfordjournals.aje.a116682. [DOI] [PubMed] [Google Scholar]
- 4.Guerrant DI, Moore SR, Lima AA, Patrick PD, Schorling JB, Guerrant RL. Association of early childhood diarrhea and cryptosporidiosis with impaired physical fitness and cognitive function four-seven years later in a poor urban community in northeast Brazil. Am J Trop Med Hyg. 1999;61:707–713. doi: 10.4269/ajtmh.1999.61.707. [DOI] [PubMed] [Google Scholar]
- 5.Fewtrell L, Colford JM., Jr Water, sanitation and hygiene in developing countries: interventions and diarrhoea–a review. Water Sci Technol. 2005;52:133–142. [PubMed] [Google Scholar]
- 6.Clasen T, Schmidt WP, Rabie T, Roberts I, Cairncross S. Interventions to improve water quality for preventing diarrhoea: systematic review and meta-analysis. BMJ. 2007;334:782. doi: 10.1136/bmj.39118.489931.BE. [DOI] [PMC free article] [PubMed] [Google Scholar]
- 7.Cutler D, Miller G. The role of public health improvements in health advances: the twentieth-century United States. Demography. 2005;42:1–22. doi: 10.1353/dem.2005.0002. [DOI] [PubMed] [Google Scholar]
- 8.Clasen T, Saeed TF, Boisson S, Edmondson P, Shipin O. Household water treatment using sodium dichloroisocyanurate (NaDCC) tablets: a randomized, controlled trial to assess microbiological effectiveness in Bangladesh. Am J Trop Med Hyg. 2007;76:187–192. [PubMed] [Google Scholar]
- 9.Solsona F, Méndez J. Water Disinfection. PAHO/CEPIS/PUB/03.89. Washington, DC: Pan American Center for Sanitary Engineering and Environmental Sciences, Pan American Health Organization; 2003. [Google Scholar]
- 10.U.S. Environmental Protection Agency . Product Label for Occidental Chemical Corporation Sodium Dichloroisocyanurate. Washington, DC: U.S. Environmental Protection Agency; 2004. [Google Scholar]
- 11.World Health Organization . Sodium Dichloroisocyanurate in Drinking-Water: Background Document for Development of WHO Guidelines for Drinking-Water Quality. Geneva: World Health Organization; 2007. [Google Scholar]
- 12.World Health Organization Evaluation of certain food additives and contaminants: sixty-first report of the joint FAO/WHO expert committee on food additives. World Health Organ Tech Rep Ser. 2004;947:1–225. [Google Scholar]
- 13.World Health Organization . Guidelines for Drinking-Water Quality: Second Addendum to Third Edition. Geneva: World Health Organization; 2008. [Google Scholar]
- 14.Rook JJ. Formation of haloforms during chlorination of natural waters. Water Treat Exam. 1974;23:234–243. [Google Scholar]
- 15.Richardson SD, Simmons JE, Rice G. Disinfection byproducts: the next generation. Environ Sci Technol. 2002;36:198A–205A. doi: 10.1021/es022308r. [DOI] [PubMed] [Google Scholar]
- 16.International Agency for Research on Cancer . IARC Monographs on the Evaluation of Carcinogenic Risks to Humans, Volume 73: Some Chemicals that Cause Tumours of the Kidney or Urinary Bladder in Rodents and Some other Substances. Lyon, France: International Agency for Research on Cancer, World Health Organization; 1999. [Google Scholar]
- 17.World Health Organization . Trihalomethanes in Drinking-Water: Background Document for Development of WHO Guidelines for Drinking-Water Quality. Geneva: World Health Organization; 2005. [Google Scholar]
- 18.International Agency for Research on Cancer . IARC Monographs on the Evaluation of Carcinogenic Risks to Humans, Volume 52: Chlorinated Drinking-Water; Chlorination By-Products; Some other Halogenated Compounds; Cobalt and Cobalt Compounds. Lyon, France: International Agency for Research on Cancer, World Health Organization; 1991. [PMC free article] [PubMed] [Google Scholar]
- 19.World Health Organization . Guidelines for Drinking-Water Quality. Third Edition. Volume 1. Geneva: World Health Organization; 2004. Recommendations. [Google Scholar]
- 20.World Health organization . Guidelines for Drinking-Water Quality. Second Edition. Volume 1. Geneva: World Health Organization; 1993. Recommendations. [Google Scholar]
- 21.Lantagne D, Blount BC, Cardinali F, Quick RE. Disinfection by-product formation and mitigation strategies in point-of-use chlorination of turbid and non-turbid waters in western Kenya. J Water Health. 2008;6:67–82. doi: 10.2166/wh.2007.013. [DOI] [PubMed] [Google Scholar]
- 22.Baylac P, Sere O, Wanegue C, Luigi R. Comparaison du Pouvoir Desinfectant de la Chloramie T et du Dichloroisocyanurate de Sodium sur une Eau de Riviere. Saint-Cloud Cedex, France: Laboratoire Central, Departement de Microbiologie Alimentaire, Ministere de la Defense; 1996. [Google Scholar]
- 23.Macêdo J, Andrade N, Chaves J, Araújo J, Silva M, Jardão C. Formação de Trihalometanos em Soluções Sanificantes Utilizadas no Processo de Desinfecção de Indústrias de Alimentação. Paraná, Brazil: Sanepar; 2002. [Google Scholar]
- 24.Lantagne D. Sodium hypochlorite dosage for household and emergency water treatment. J Am Water Works Assoc. 2008;100:106–119. doi: 10.2166/wh.2017.012. [DOI] [PubMed] [Google Scholar]
- 25.Quick RE, Venczel LV, Mintz ED, Soleto L, Aparicio J, Gironaz M, Hutwagner L, Greene K, Bopp C, Maloney K, Chavez D, Sobsey M, Tauxe RV. Diarrhoea prevention in Bolivia through point-of-use water treatment and safe storage: a promising new strategy. Epidemiol Infect. 1999;122:83–90. doi: 10.1017/s0950268898001782. [DOI] [PMC free article] [PubMed] [Google Scholar]
- 26.Quick RE, Kimura A, Thevos A, Tembo M, Shamputa I, Hutwagner L, Mintz E. Diarrhea prevention through household-level water disinfection and safe storage in Zambia. Am J Trop Med Hyg. 2002;66:584–589. doi: 10.4269/ajtmh.2002.66.584. [DOI] [PubMed] [Google Scholar]
- 27.Crump JA, Okoth GO, Slutsker L, Ogaja DO, Keswick BH, Luby SP. Effect of point-of-use disinfection, flocculation and combined flocculation-disinfection on drinking water quality in western Kenya. J Appl Microbiol. 2004;97:225–231. doi: 10.1111/j.1365-2672.2004.02309.x. [DOI] [PubMed] [Google Scholar]
- 28.Crump JA, Otieno PO, Slutsker L, Keswick BH, Rosen DH, Hoekstra RM, Vulule JM, Luby SP. Household based treatment of drinking water with flocculant-disinfectant for preventing diarrhoea in areas with turbid source water in rural western Kenya: cluster randomised controlled trial. BMJ. 2005;331:478. doi: 10.1136/bmj.38512.618681.E0. [DOI] [PMC free article] [PubMed] [Google Scholar]
- 29.Cardinali FL, Ashley DL, Morrow JC, Moll DM, Blount BC. Measurement of trihalomethanes and methyl tertiary-butyl ether in tap water using solid-phase microextraction GC-MS. J Chromatogr Sci. 2004;42:200–206. doi: 10.1093/chromsci/42.4.200. [DOI] [PubMed] [Google Scholar]
- 30.U.S. Environmental Protection Agency . Stage 2 Disinfectants and Disinfection Byproduct Rule (Stage 2 DBP rule): Basic Information. Washington, DC: U.S. Environmental Protection Agency; 2006. [Google Scholar]
- 31.Chow AT, Guo F, Gao S, Breuer R, Dahlgren RA. Filter pore size selection for characterizing dissolved organic carbon and trihalomethane precursors from soils. Water Res. 2005;39:1255–1264. doi: 10.1016/j.watres.2005.01.004. [DOI] [PubMed] [Google Scholar]
- 32.Kotlarz N, Lantagne D, Preston K, Jellison K. Turbidity and chlorine demand reduction using locally available physical water clarification mechanisms before household chlorination in developing countries. J Water Health. 2009;7:497–506. doi: 10.2166/wh.2009.071. [DOI] [PubMed] [Google Scholar]
- 33.Preston K, Lantagne D, Kotlarz N, Jellison K. Turbidity and chlorine demand reduction using alum and moringa flocculation before household chlorination in developing countries. J Water Health. 8:60–70. doi: 10.2166/wh.2009.210. [DOI] [PubMed] [Google Scholar]