

Abstract
Malaria is a location-specific, dynamic infectious disease transmitted by mosquitoes to humans and is influenced by environmental, vector, parasite, and host factors. The principal purposes of malarial epidemiology are 1) to describe the malarial distribution in space and time along with the physical, biologic, and social etiologic factors and 2) to guide control objectives for either modeling impact or measuring progress of control tactics. Mapping malaria and many of its causative factors has been achieved on many different levels from global distribution to biologic quantitative trait localization in humans, parasites, and mosquitoes. Despite these important achievements, a large degree of uncertainty still exists on the annual burden of malarial cases. Accurate, sensitive detection and treatment of asymptomatic reservoirs important to infectious transmission are additional components necessary for future control measures. Presently spurred by the leadership and funding of Bill and Melinda Gates, the malarial community is developing and implementing plans for elimination of malaria. The challenge for malariologists is to digitally integrate and map epidemiologic factors and intervention measures in space and time to target effective, sustainable control alongside research efforts.
Keywords: antimalarials; basic reproduction number; epidemiologic factors; epidemiologic measurements; infectious disease incubation period; malaria; malaria, falciparum; malaria, vivax
INTRODUCTION
Malaria has coexisted with the human population for millennia. Some human malarial parasites based on mitochondrial sequences are estimated to be 50,000–100,000 years old (1). Both mitochondrial DNA analysis and chromosome-wide single nucleotide polymorphism analysis point to a Plasmodium falciparum population expansion from a bottleneck about 10,000 years ago, postulated to coincide with “slash and burn” agriculture development and also adaptation of the Anopheles gambiae mosquito (2, 3). About 1880, the causative organism was identified by Laveran (4, 5) while investigating febrile illness in Algerian soldiers. Ross and Smyth (6) implicated the mosquito as the vector about 20 years later by observing pigmented cells outside the mosquito stomachs of bird malaria. The finding was quickly verified in human malarias. Almost 50 years later, Shortt and colleagues (7–9) identified the liver stage of human malaria in 1948.
Thus, approximately 1900 marked the beginning of malarial interventions with the first few decades devoted to “sanitation” of Anopheles. Mosquito control had much success, notably in the Panama Canal effort (10, 11), in the Zambian copper belt (12), and in the eradication of transplanted A. gambiae from Brazil that narrowly avoided a disaster (13). This first half of a century did shrink the global land distribution of malaria from the preintervention area of 77.5 million km2 to 58.5 million km2 (14). Another concept of malarial control developed in this half century was “Anophelism without malaria,” meaning that one did not have to eradicate all “Anopheles” mosquitoes to eradicate malaria, which has happened in many temperate zones including the United States. Most of these successful control programs coupled control with research activities (15).
The second part of the last century was marked by great optimism for eradication of malaria. The potent insecticide dichlorodiphenyltrichloroethane (DDT) was successfully launched as part of the global malarial eradication effort. Later the safe, inexpensive quinoline drug, chloroquine, was added for prevention. The end of malaria was forecasted (16). Unfortunately, the development of both insecticide resistance and chloroquine resistance, in addition to operational, political, and financial issues, halted malaria-eradication efforts. In a timely pioneering mapping effort, the Russian, Lysenko, constructed a global endemicity map using diverse data sources of many malariometrics to project worldwide malarial distribution inferred from expert opinion, population increases, rainfall, and temperature data (14, 17). In 1975 after the abandonment of systematic global eradication efforts, the global land area for malarial risk had shrunk to 48 million km2 (14). Continued efforts in China, South America, and the Middle East have resulted in a nadir of approximately 40 million km2 for the global malarial risk in the early 1990s. This land area of malarial risk has plateaued over the past 20 years.
Despite the global land area of risk reduction of almost 50% over the last century, the absolute population at risk for malaria has actually increased in this time period. The world population from 1900 to the present has more than quadrupled from 1 billion to close to 7 billion. While the percentage of the world population exposed to malaria has decreased from 77% to 50% from 1900 to 2000, the actual number of people estimated at risk for malaria increased steadily from 0.8 billion to 3.4 billion because of population increases in malaria-endemic regions (14).
UNCERTAINTY IN THE MALARIA BURDEN
The annual burden of malaria is still not accurately counted, and almost 95% of the burden is inferred from laboratory-confirmed cases representing less than 5% of the total (18). In 1952, on the basis of his own expert opinion, Russell (19) described the number of annual cases estimated at 350 million with a 1% mortality from a world population of 2.4 billion. Strüchler (20) refined the crude estimate to 489 million cases in 1986 inclusive of 234 million due to P. falciparum with a 1% mortality. This estimate was obtained by simply multiplying the population under age 15 years exposed to malaria in 97 countries by incidence rates in Africa of 1.0 per child per year and 0.2 per child per year in all the other malarious countries (20). In the 1990s, estimates from the World Health Organization (WHO) ranged from 213 to 273 million annual clinical cases of malaria, although the basis for those estimates was not transparent (21).
In a groundbreaking methodological report, Snow et al. (22) refined estimations of P. falciparum malaria in 2002 to 515 million, with a range of 300–600 million. They refined the endemic prevalence map of Lesenko ignoring country borders and incorporated active case detection studies in Africa and passive national reporting systems in non-African countries. The data in contrast to Strüchler's 2 rates were based on 83 independent annual incidence patterns from 22 countries in 5 regions. Clinical malaria was defined as fever with parasitemia, and the ranges were interquartile ranges. On the basis of 2006 data, the WHO published in 2008 a more country-specific estimation summarized with 247 million malarial cases with a lower uncertainty estimate of 189 million and a higher uncertainty estimate of 327 million as the 5th–95th percentiles. P. falciparum accounted for 91% or 230 million (range, 175–300 million), very close to Strüchler's estimate (18). The WHO case definition was also fever and parasitemia. The method was based on a report by Cibulskis et al. (23), which for non-African countries reported case rates adjusted for health-care utilization and the likelihood of parasite-positive rates for the whole country and for African countries an empirical relation between malarial transmission risk and case incidence. This methodology was based largely on the work by Snow et al. (22). An important caveat to the WHO numbers is that the number of cases reported by the national malarial control programs was only 37% of this estimated global incidence. Laboratory-confirmed cases made up less than 5% of these global incidence cases (18).
In another milestone, a digital, global, full spatiotemporal geostatistical modeling framework was established to record malarial prevalences in a worldwide endemicity map in 2007 (24). The Malaria Atlas Project (MAP) was established. The project was based on almost 8,000 P. falciparum parasite rate surveys, which were geopositioned and passed strict inclusion criteria. The map incorporates environmental factors with human population density. These were used to make a continuous, age stratified, and urban-corrected malarial prevalence surface with model-based geostatistics in a Bayesian statistical framework. Validation procedures examined the accuracy of endemic rates and the uncertainty measurements. The project is continuously updated from ongoing prevalence measurements throughout the world. This is one of the first maps to report fine scale subcountry variations in malarial rates synthesizing population density, malariometrics, and environmental data. MAP had its roots in the Mapping Malaria Risk Project that also contributed early seminal maps in Africa of malarial risk-based population density and environments suitable for transmission (25–27).
The caveats to these reported numbers are the bias of research sampling in areas of higher malarial prevalence. There is a paucity of active surveillance data in areas with low transmission. In contrast, a recent malarial indicator survey study in Zambia was based on 120 clusters randomly chosen throughout the country (28). While the overall average population-adjusted parasitemia risk was 20%, the geostatistical Bayesian model created a more detailed map of regional risk to guide intervention measures. Further complicating the numbers is the underestimation by blood film microscopy compared with polymerase chain reaction (PCR), which can average 50% of PCR numbers (29).
In a comparison of the 24 countries with higher malarial burdens in Figure 1, 24 countries or a quarter of the 105 countries at risk of malaria account for more than 80% of malarial cases. Sixteen countries in Africa comprise 72% of the total world malarial burden. For most of these African countries, the population at risk living in an endemic area defined as 1 case/1,000 population averages 87% of the total population in contrast to the 8 higher risk, non-African countries, where the population at risk for malaria is less than 25% of the total (18). These African high-prevalence countries have uncertainty in case estimates, which range from 30% to 50% of the total numbers reported.
Figure 1.
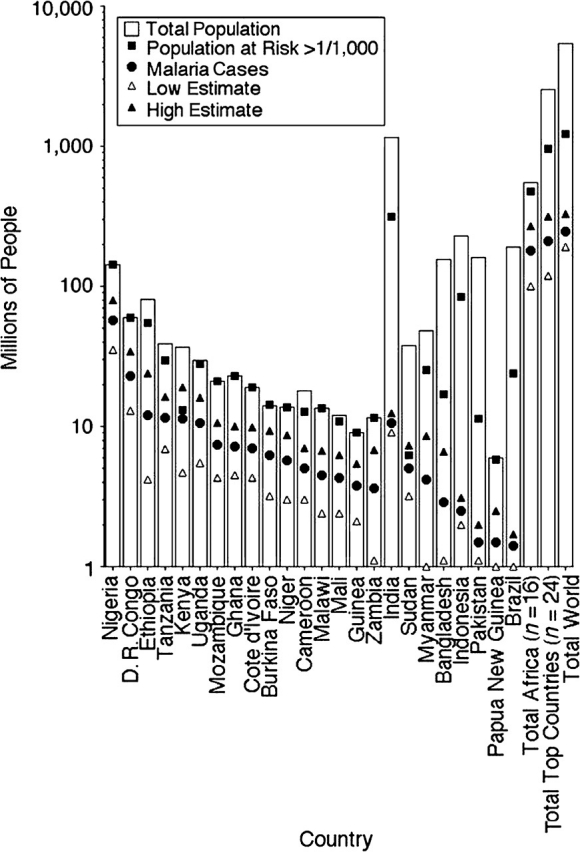
Population burden of malaria. The 16 top African countries and 8 non-African countries account for more than 80% of all yearly malaria cases. For African countries, the population at risk (filled square) is close to the total population (white bar), while for Southeast Asia nations the population at risk is more than the total population of many African nations. The reported numbers of malaria cases (filled circles) are shown with low and high estimates (triangles). Data are from the World Malaria Report 2008 from the World Health Organization (18). “D. R. Congo” is Democratic Republic of Congo.
Greater uncertainty of the non-P. falciparum malaria burden
In the malarial numbers for 2008 and 2009, WHO estimated 91% of clinical malaria to be P. falciparum with about 9% Plasmodium vivax or other species, which is only 17 million cases. This number is extremely low. In contrast, the world health report in 1999 had estimated 70–80 million cases annually of P. vivax (21). A more recent estimate places the burden of P. vivax infection at 132–391 million cases annually (30). In Southeast Asia, P. vivax can account for 50% of the malarial disease. In Africa, with 5% of infections, P. vivax accounts for about 12 million cases. Price et al. (30) estimate 90–248 million cases in Southeast Asia alone on the basis of the combination of population densities and prevalence rates shown in environmental mapping and malaria-endemic mapping. A conservative point estimate for P. vivax might be approximately half of P. falciparum totals. The African numbers are underrepresented by reliance on thick films, which fail to identify by species. The numbers in Southeast Asia have a large range. Although travelers provide an imperfect random sampling of malarial exposure because of obvious destination bias, the 2:1 ratio is supported by ratios of P. falciparum to P. vivax in children travelers returning to the United Kingdom, Europe, and Japan from 1992 to 2002 (31) and also to the United States from 1991 to 2007, where there were 19,500 P. falciparum cases compared with 10,400 P. vivax cases (32–46).
Global numbers for Plasmodium malariae and Plasmodium ovale are absent. The burdens of P. ovale and P. malariae are even more underrepresented in blood film surveys. P. ovale can, in a cursory blood film examination, resemble P. vivax except for the rarer oval infected erythrocytes or number of nuclei in schizonts. P. malariae, in addition to also being missed on thick blood film examinations, is also commonly asymptomatic with lower parasite densities. Most of P. malariae infections detected by epidemiologic surveys are geographically in sub-Saharan Africa and the Southwest Pacific, while in the Middle East, the Americas, and Southeast Asia, this infection is infrequent. P. ovale has a similar but more focal distribution (47). Coinfections with P. falciparum are frequent with the interesting observation that, in the dry season when P. falciparum densities decrease, P. malariae densities increase (48). In a series of studies from Papua New Guinea, PCR detected 2–10 times as much incidence of P. malariae or P. ovale (47). In the returning travelers described from Japan, Europe, and the United States, P. ovale represented approximately 5% with P. malariae representing about 2.5% of the more than 35,000 total cases of malaria.
A reasoned compromise on the non-P. falciparum numbers would be to estimate 60% P. falciparum, 30% P. vivax, 6% P. ovale, and 3% P. malariae. This would conservatively translate to 250 million, 130 million, 25 million, and 12 million, respectively, for each species. These numbers are about half of the estimates for P. falciparum (22) and P. vivax by the Oxford group but closer to the WHO estimate.
Plasmodium knowlesi has in the past been thought of as a primate Plasmodium. Recently, substantial sustained zoonosis has been demonstrated in hundreds of human cases in Malaysia and Southeast Asia (49). The true extent is still being explored.
MALARIAL DISEASE AND DIAGNOSIS
In 2010, a paucity of worldwide malarial disease receives a laboratory-confirmed diagnosis. Malaria can be grouped into 2 types of disease: one of an acute febrile illness in travelers or nonimmune persons or an acute disease in the setting of chronic infection in semiimmune individuals in endemic areas. Both are presentations of febrile illnesses with many nonmalarial etiologies. Depending on both the clinical and epidemiologic settings, malaria is both under- or overdiagnosed. In a nonimmune person, the presence of Plasmodium parasites and febrile or disease symptoms is synonomous with the diagnosis of malaria. In an endemic setting with 50%–70% of adults or older children who are parasitemic, febrile illness from other causes can appear to be malaria, leading to an overdiagnosis. In severe illness requiring hospitalization, large studies have demonstrated that 30%–50% of children presumed to have malaria actually have bacteremia or other nonmalarial diseases (50). Malaria is underdiagnosed in the setting of chronic infection manifesting with short duration self-limiting febrile symptoms.
The diagnosis of malaria is made by clinical grounds of fever and an illness, by blood film microscopy, by an immunochromatographic rapid diagnostic test (RDT) that detects malarial antigens, by polymerase chain reaction, or rarely by serologic testing (51). The RDT and PCR as commonly used yield a dichotomous positive or negative result. Both are amenable to antigen quantification (52, 53) or DNA semiquantitation (54, 55). Malaria diagnosis is a density-dependent process. For blood film microscopy, parasite densities over 1,000/μL are quickly detected in a few minutes, while lower density parasitemia can require up to 20 minutes per patient. Similarly, the RDT has a greater sensitivity with a higher parasite density. Although PCR is considered both more sensitive and specific than blood film or RDT, this is not always the case, especially at lower parasite densities in the range of 1–500/μL. P. falciparum also has from 10-fold to 100-fold higher pyrogenic density than P. vivax or P. ovale. The fever threshold also increases in the setting of semiimmunity, such that in an endemic setting P. falciparum parasitiemia of more than 5,000–10,000/μL can often be asymptomatic. Often, epidemiologic research studies attempt to correlate antigenemia or DNA density to blood film microscopy. Because of diverse kinetics, they should be considered as different metrics each with separate, but overlapping implications for severe or asymptomatic disease (56, 57). Blood film microscopy for P. falciparum can vary by log amounts in the space of 12–24 hours because of the shifting biomass from the sequestered pool of endothelium-adherent parasites in the tissues to the blood stream (58, 59). The nonadherent P. vivax, P. ovale, and P. malariae are less subject to the large daily flucuations (60, 61). Both the P. falciparum HRP-2 antigen and the glycolytic aldolase and lactate dehydrogenase enzymes have different clearance kinetics, with HRP-2 persisting for days to weeks while the glycolytic enzymes disappear in a few days (53). A person presenting febrile and anemic with a 1% parasitemia of 20,000 parasites/μL and a hemoglobin of 17 g/dL may have very different levels of parasite antigenemia depending on the duration of parasitemia before presentation. The quantification of antigen then has diminished correlation to blood film parasitemia. In regard to the kinetics of parasite DNA after treatment, large kilobase fragments like the merozoite surface protein 2 disappear in a few days. However, smaller fragments of less than 200 kilobases detected by real-time PCR can persist for a longer period of time (62). A body burden of 10 million parasites is approximately 1–10 parasites/μL. Prepatent parasitemia less than this threshold or parasitemia following effective drug treatment is not detectable by common sampling methods.
Another area of diagnostic challenge is detection of gametocytes that have lower parasitemias of approximately 1–1,000 parasites/μL (63, 64). The detection is more complicated as the absence of gametocytes by blood film microscopy does not preclude mosquito transmission. Unlike symptomatic malarial disease that is density dependent, infectiousness by mosquitoes is not a gametocyte density-dependent process. A study in northwest Thailand demonstrated significant transmission by mosquitoes in feeding assays among individuals who were not ill enough to report to a clinic. They were detected on active screening surveys. Twenty-one percent of persons having blood films negative for gametocytes were infectious for mosquitoes. Those who were able to infect mosquitoes who did not seek help from the clinic were infectious for a longer period of time than those who went to the clinic and received treatment. The study authors concluded that the main reservoir of malarial infectiousness was oligosymptomatic persons remaining in the village (65).
Previous work has indicated that the presence of reticulocytes and/or anemia was associated with higher gametocyte carriage (66–68). There are also studies that associate sickle trait and disease with higher gametocyte carriage (69). In contrast, a single study of hemoglobin E and gametocytes noted decreased carriage. To the extent that hemoglobinopathies or thalassemias are associated with anemia or increased reticulocytosis, they may be an important source of asymptomatic gametocyte carriage with low parasite densities.
The prevalence of disease also greatly influences the diagnostic test application, especially because the blood film and RDT are more suitable for detection of symptomatic presentations. They do not perform as well in asymptomatic active case detection with a higher number of lower parasitemic and nonparasitemic individuals. A quick review of receiver-operated curves illustrates that, as prevalence decreases from 10% to 1% in active case detection studies, the specificity requirements increase such that a 99% specificity is necessary to equally segregate false positives and true positives (70, 71). In other words, in a group of 1,000 individuals screened and with a prevalence of 1%, a 99% sensitive and specific test will yield 10 false positives and 10 true positives. Similarly, for a 95% sensitive and specific test with a prevalence of 5%, the numbers of false positives and true positives are equal at 50 from a group of 1,000. A 90% sensitive and specific test in a prevalence of 10% has 100 false positives and true positives. If the sensitivity and specificity are less than (1 − prevalence), the false-positive ratio to true positive is greater than 1. This applies especially to the application of Real Time PCR, where low density positive samples have to be distinguished from false positives on the basis of contamination (72) or negative samples (73). Because they are low-density parasitemias, correlation with blood films or antigen levels is also difficult in this subset.
MALARIAL EPIDEMIOLOGIC FACTORS
The epidemiologic factors that govern malaria are ideally investigated altogether. This, however, is difficult to achieve on a management level. The level of endemic malaria traditionally has been divided into 4 groups on the basis of malariometric rates: hypoendemic, <10%; mesoendemic, 10%–49%; hyperendemic, 50%–74%; and holoendemic, ≥75%. As seen in Figure 2A, an age-dependent relation exists within endemic areas for parasite prevalence. This has led to sometimes confusing comparisons between epidemiologic surveys performed in different age groups and at different seasons of the year. Smith et al. (74) have recently compared 4 different mathematical models to standardize prevalence rates among 121 different studies. Although the group aged 2–10 years is a useful plateau for comparative studies, sometimes rates do not stabilize until the age of 5 years. Studies reporting rates in children under age 2 years can be more problematic to compare.
Figure 2.
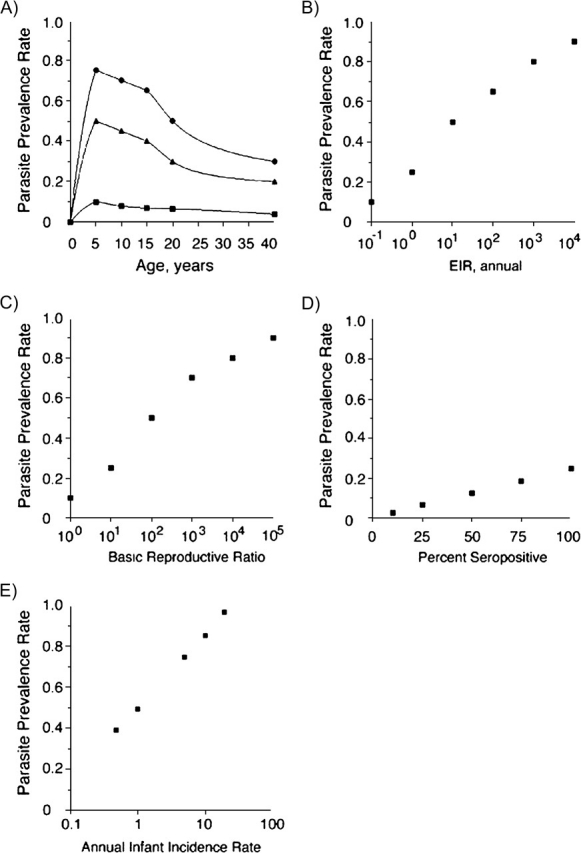
Relation of malaria intensity measures. In A, age-dependent parasite prevalence rates grouped into the 4 traditional endemic transmission regions with human measures of intensity show a peak in young children. Large reductions in mosquito transmission measures can still sustain high parasite prevalences. Parasite prevalence rates decrease little with 10-fold decreases in entomologic inoculation rates (EIRs) (B) and almost 100-fold decreases in the basic reproductive ratio (R0) (C). In D, the rates of seropositivity to malaria antigens quickly saturate to near 100% at both prevalence near 25% with low EIR and R0 less than 10. In E, the less used measure of intensity associating infant malaria rates is useful in hyperendemic and holoendemic settings with prevalence over 50%.
The mosquito definitive host, human host, and Plasmodium parasite weave a complex web of interrelations among environmental conditions to determine and sustain the amount of parasites distributed in a focal, dynamic fashion in space and time in Table 1. The mathematical models describing these relations can be equally complex.
Table 1.
Malaria Epidemiologic Factors and Control Measures
| Epidemiologic Factors | Human Genetic Resistance | |||
| Environment | Mosquito | Parasite | Humans | |
| Standing water | Density | Multiplication rate | Genetic resistance | Thalassemias |
| Temperature | Duration of sporogony | Virulence | Nutrient status, age | Hemoglobinopathies (i.e., sickle trait) |
| Humidity | Blood meal frequency | Drug resistance | Coinfection—worms, HIV | Duffy factor negative |
| Altitude | Mosquito lifespan | Antigenic diversity | Behavior, pregnancy, deforestation | Glucose-6-phosphate deficiency |
| Species permissiveness | Housing, occupational exposure | Hereditary spherocytosis | ||
| Behavior of biting habits | Cytokine mutations | |||
| Control Measures | ||||
| Larval control | Indoor residual spraying | Rapid diagnostic tests | Intermittent presumptive treatment of children or during pregnancy | |
| Water engineering | Bednets | Effective drug therapy | Health infrastructure | |
| Education | ||||
Abbreviation: HIV, human immunodeficiency virus.
Environmental factors
Four main environmental factors include mean daily temperature, humidity, altitude to approximately 2,500 m, and amount of water for larval habitats. Northern and southern distribution maps were defined by the lower limits of the 15°C isotherm as the minimal temperature to sustain sporogony or development through mosquito stages (75). The lower limit threshold does vary with human Plasmodium species from 14.5°C to 16°C (75). This temperature has to be sustained for at least 7 days for the parasite to mature in the mosquito. Higher temperatures shorten days of development for both mosquito and parasite, but temperatures over 30°C shorten the lifespan of the mosquito. Relative humidity over 60% increases mosquito longevity (75). The relative amount of standing water in the environment provides for larval habitats. Satellite information defining the vegetative index has been useful for modeling malaria (76).
Mosquito factors
Measurable mosquito determinants, which control the transmission of malaria, relate to mosquito lifespan, behavior, and genetic susceptibility or refractoriness. Because of the interplay between duration of parasite sporogonic development (Table 2) and adult lifespan, shortening the lifespan of mosquitoes by even a day or two can have dramatic effects on transmission potential (77). Indeed, most insecticides do not have to kill mosquitoes to interrupt malarial transmission but can shorten the adult mosquito lifespan such that the Plasmodium parasite is unable to develop. Shortening the mosquito lifespan but maintaining reproductive potential eliminates reproductive selection of insecticide resistance. An important additional basis of insecticide-treated bednets besides preventing biting mosquitoes is to shorten the lifespan of mosquitoes when they rest on the net after feeding. The behavior of mosquitoes that greatly affects malarial transmission includes human versus animal biting habits, indoor or outdoor feeding, or resting habits. One of the epidemiologic intensity indices for malaria is the vectorial capacity that relates the density of mosquitoes in relation to humans, man-biting habits per day, daily survivorship of mosquitoes, and the parasite incubation or sporogonic period (75). Vectorial capacity can be expressed mathematically by using measures of these mosquito factors. Bednets were designed and validated for indoor, midnight-biting A. gambiae in Africa. An open question is the effectiveness in forest malaria in Southeast Asia where individuals can encounter mosquitoes at dawn or dusk.
Table 2.
Plasmodium Dynamics of Parasitemia
| Species | Mean Temperature Threshold for Sporogony, °C | Sporogony Length, days × minimum degrees | Hepatic Hypnozoite | Average Duration of Untreated Infection, months | Maximum Duration of Untreated Infection, years | Erythrocyte Cycle, hours | Age of Infected Erythrocyte | Prepatent Period, days | Pyrogenic Density, parasites/μL | Peak Parasitemia Range, parasites/μL | Peak Parasitemia Geometric Mean, parasites/μL | Gametocyte Density, parasites/μL |
| Plasmodium falciparum | 16 | 111 | No | 2 | 2 | 48 | All | 8–15 | 1,000 | 1,000–1,000,000 | 5,000–50,000 | 1–10,000 |
| Plasmodium vivax | 14.5 | 105 | Yes | 1 | 4 | 48 | Reticulocyte | 9–15 | 100–200 | 600–20,000 | 8,600 | 1–1,000 |
| Plasmodium ovale | —a | Yes | 2–4 | 4 | 48 | Reticulocyte | 12–20 | 100–200 | 400–30,000 | 6–7,000 | —a | |
| Plasmodium malariae | 16 | 144 | No | 2–24 | >40 | 72 | Old | 16–60 | 3,000 | 1,000–50,000 | 9,000 | 1–300 |
—, not established.
Among the more than 3,000 species and 40 genera of mosquitoes, only 30–40 species from the Anopheles genus transmit Plasmodium by the bite of an infective female mosquito. Many Anopheles mosquitoes can also transmit bird or reptilian Plasmodium but not mammalian Plasmodium. Even among the very efficient A. gambiae in Africa, interindividual variation of transmission efficiency is apparent. Modern molecular mapping has focused on 2 differential transmission phenotypes: 1) A. gambiae transmission of primate or murine Plasmodium or 2) A. gambiae transmission of the natural parasite P. falciparum. Genetic loci for encapsulation of the primate Plasmodium cynomolgi have been mapped to a pen1 location (78). Recently, the transmission with P. falciparum in A. gambiae was mapped and validated with the antiparasitic thioester-containing protein 1 (79) and also separately with the Anopheles Plasmodium-responsive leucine-rich repeat 1 (80, 81).
The insecticide resistance genetic markers have separately led to selection and spread of Anopheles mosquitoes efficient in malarial transmission (82). The knock-down resistance has appeared in separate species (83, 84). DDT resistance has been chromosomally localized (82). Other metabolic resistance mechanisms remain to be localized on the Anopheles genome (85).
Plasmodium factors
The parasite itself contributes to the epidemiologic distribution of malaria (Table 2). Drug resistance such as chloroquine resistance, a high multiplication rate in the human host, antigenic diversity, and possibly unknown virulence factors all contribute to disease in individuals and transmission potential. The spread of chloroquine resistance from foci in Cambodia and Brazil is well documented and contributed to increases in malarial prevalence worldwide (86). Microsatellite markers on either side of the P. falciparum chloroquine-resistant protein demonstrate reduced diversity (87, 88). Interestingly, there is also evidence of selective sweeps for the antifolate drugs despite frequent observations of independent origin of resistance (89). In Malawi, wild-type chloroquine-sensitive parasites have replaced widespread dispersal of chloroquine-resistant genotypes implicating no selective survival advantage to chloroquine resistance (90).
There is some evidence that merozoite invasion-binding ligands may also increase the multiplication rate among P. falciparum isolates (91). The more efficient invasion rate leads to a higher multiplication rate per erythrocyte cycle, which can both increase transmission potential and possibly cause more severe disease. P. vivax and P. ovale have a built-in ceiling on more efficient multiplication rates being limited to invasion and development in reticulocytes. The dogma with a modicum of evidence in P. malariae is that this species invades only mature erythrocytes, while P. falciparum can invade erythrocytes of all ages.
In the case of P. falciparum, the erythrocyte stages past the ring stage, such as the trophozoite and schizonts, very rarely circulate but, instead, are sequestered in tissues by parasite ligands that have been exported outside the parasite to the surface of the erythrocyte membrane to bind to host endothelial receptors. The intensive successful search for the chloroquine-resistant loci yielded a sequence of Duffy binding-like genes, which were characterized on the surface of the knob structures ultrastructurally implicated in binding (92). This gene family has about 50 gene orthologs with high diversity (93). Antibodies to these ligands have been shown to confer protection to severe disease but not to parasitemia. An unproven rationale for P. falciparum binding is to prevent splenic clearance of parasites. However, only a minority of the more than 100 Plasmodium species infecting mammals, birds, and reptiles sequester. Other loci have been selected throughout the Plasmodium genome on the basis of either possible drug resistance or possibly virulence (94).
Human factors
Humans have had millions of years to evolve mechanisms to resistance to the malarial parasite. An age-dependent prevalence rate in endemic areas relates to gradual humoral, antibody-dependent acquisition to disease but not to parasitemia. In hyperendemic and holoendemic settings, most clinical disease manifestation presents in individuals before the age of 5 years, while peak prevalence rates are in individuals aged 10–15 years (75). Interestingly, the age-dependent immunity carries over to the ability to clear chloroquine-resistant parasites when given chloroquine. Children aged 1–5 years are least able to clear chloroquine-resistant parasites, while those over the age of 5 years clear more than 50% of infections with chlorquine-resistant parasites (95). Whether this presumed humoral ability to make drugs work better can be translated into a vaccine construct is underexplored.
Genetic resistance to malarial infection and disease listed in Table 1 has been long studied. Duffy blood group antigen-negative individuals residing in western Africa are unable to support invasion of P. vivax parasites and have completely absent blood-stage parasitemia (96). There does exist one report of a few individuals, Duffy negative, who are P. vivax parasitemic (97). The hemoglobinopathies, such as hemoglobin S, C, and E, demonstrate disease-limiting protection (98–100). The homozygous individual can still present with febrile illness but very rarely have severe life-threatening disease. Electron microscopy surface visualization and immunofluorescent microscopy have revealed an abnormal number and distribution of the knobs (101–103). Parasites still adhere in endothelial beds but not as much to cause severe disease. An interesting mapping question asks whether these parasites stick downstream from highly adherent parasites or just not as tightly as those causing severe disease in individuals with normal hemoglobin. Disordered alpha or beta hemoglobin production in the thalassemias also confers protection from disease but not from parasitemia by unresolved mechanisms (104). The deficiency of glucose-6-phosphate dehydrogenase has also been selected for malarial resistance (105). This is one of the most common genetic enzyme deficiencies in humans. Researchers have detected areas by haplotype maps on human chromosomes indicative of malarial selection (106). Even after malaria is permanently eradicated, these abnormal genes will persist for centuries as a semipermanent imprint upon the human genome by Plasmodium.
Other related factors affecting the outcome of malarial disease and possibly transmission potential include macro- and micronutrient deficiencies (107), pregnancy (108), coinfection with helminths (109–112), or viral diseases (113, 114). Behavioral modifications on the individual or society level affect the distribution of malaria. Deforestation leads to restriction of forest Anopheles dirius species. Housing construction, like screens, can prevent nocturnal mosquito biting. Malaria has also been correlated to occupational exposure, such as relocation of miners or harvesters on tea plantations (115).
Measures of malarial intensity factors
All of the above-named factors can be interrelated with changes in an environmental, vector, parasite, or human factor affecting malarial distribution and measurement of malariometrics. Different formulas have been useful to follow malarial factors affecting prevalence. The entomologic inoculation rate (EIR) measures the number of infected mosquitoes capable of transmission to humans that bite or inoculate Plasmodium sporozoites over a period of time, most commonly a year. These rates can vary from 1 to 1,000/year. As seen in Figure 2B, drastic reductions in the EIR from the hundreds down to the tens still can be associated with greater than 50% prevalence rates. The EIR is measured by all-night human landing catches of all mosquitoes and determining the number with sporozoites in salivary glands.
The EIR is related to the basic reproductive ratio (R0). Smith et al. (116) have correlated among 121 different African populations roughly a 10-fold higher R0 than EIR (Figure 2C) (116). Estimations of R0 add more factors by measuring how many humans a single human is capable of infecting in stable conditions. The duration of human infection can prolong infectiveness to mosquitoes. The density of infective mosquitoes and, to a lesser extent, humans can also perturb the measurements. The heterogeneity in mosquito biting and also the heterogeneity in human host susceptibility also diminish the ideal conditions for measurement.
Two other measures of malarial intensity are useful only in specific transmission settings, as shown in Figure 2, parts D and E. The seropositive rate of reactivity to any parasite antigens quickly saturates to 100% with parasite prevalences near 25% (75). This measure will be very useful in the elimination endgame for locating persistent foci of infection in low-transmission settings. A last measure is the incidence per infant per year of malaria, which can be measured in high-transmission areas over 50% (75). These are the 4 classical measures of malarial intensity: prevalence rate (EIR), R0, seropositive rate, and infant incidence rate.
MALARIAL CONTROL AND ELIMINATION
Bill and Melinda Gates have spurred, with both ideas and funding, the malarial community to reconsider eradication. The concept has been further delineated into control stages, elimination stages, eradication stages, and extinction stages. These will generate separate issues among the 4 principal human malarial parasites and the zoonotic P. knowlesi where humans can be incidental hosts. This mirrors the attack, consolidation, and preparation for elimination phases of the eradication campaign in the 1950s and 1960s. The control or attack phases can be split into tactical phases measured by reduction in mortality, then reduction in mortality and morbidity, then reduction in mortality and morbidity, with reduction in parasite prevalence. After this has been achieved, then countrywide malarial control can be implemented with the goal of elimination in an elimination or consolidation phase.
The approaches used have been targeting the vector or eliminating the parasite by case detection and effective treatment. Vector control approaches include reducing the contact of people and mosquitoes by insecticide-treated nets, repellants, control of mosquito larval habitats by water reduction, or larvacides and destruction of mosquitoes through indoor residual spraying of DDT (117). Elimination of the parasite in the human host to date has relied principally on chemotherapy (118). Chemotherapy can be preventive by killing liver-stage parasites or eliminating parasites emerging from the liver as in travelers. Case detection and effective treatment can be based on passive or active screening but still consist of treatment of parasitemic individuals. Although true mass drug administration through medicated salts has been discredited, intermittent presumptive treatment of more targeted high-risk disease populations has been advocated and shown to be effective in pregnant women, infants, and children (119). Besides the toxic drug primaquine in individuals with glucose-6-phosphate dehydrogensase deficiency, we have few other safe, effective drugs to target the liver and gametocyte stages. Artemisinin does reduce the duration and magnitude of infectivity to mosquitoes after combination drug treatment. In temperate areas, either vector control strategies or drug treatment alone has been effective in elimination of Plasmodium from geographic areas.
Two vaccine candidates are in human efficacy trials. One is based on immunogenic, protective epitopes from the sporozoite stage, RTS,S (120, 121), and another is the irradiated, live, attenuated sporozoites stage vaccine (122). While effective vaccines can greatly augment malaria control strategies, they will be especially useful in the elimination phases to prevent resurgence in malaria.
MAPPING INTERVENTIONS
A working dynamic, geographic-based mapping and information system will enable the integration of malarial control efforts and epidemiologic data to guide management of the disease and its impact at local and countrywide levels. Malaria needs to be mapped on many different layers from country level to district level to village level to household level to inform control efforts. Spatial aspects of malarial risk and control have long been recognized (123). Malaria is focused around mosquito-breeding sites with a limited transmission distance of a few kilometers. Mosquito-breeding sites do not always follow higher human population densities. Compounding the local transmission is the diverse range of EIRs over the limited area of even 10–20 km. In Sierra Leone, the annual EIR varied from 1–10 to 100–300 over a 3–4 km2 area (123). Malaria can also be spatially clustered on household levels within villages, resulting in a small number of households with greater malarial burdens. The clustering can also occur around rivers or streams, which may not be apparent without a map. Many areas of malarial transmission appear to conform to the 20/80 rule where 20% of the host population contributes to approximately 80% of the transmission potential (124). This implies that, if control programs target the essential 20% core, they will be more effective. This heterogeneous pattern of malarial risk also makes untargeted control ineffective because of missing the high-risk individuals and locations, as well as overtreating areas that contribute little, if anything, to malarial maintenance (123). Because of the high basic infection rate (R0) for malaria that may be in the hundreds and sometimes thousands (116), missing these high-transmission individuals or locations can effectively negate costly malarial control efforts.
Spatial targeting of malarial control requires the ability to distinguish households or other spatial clusters with different malarial incidence. This information then has to be communicated to target an intervention. The intervention tools may vary depending on the malarial situation. Not all malarial endemic patterns may be amenable to targeted intervention (123).
MAP aims “to develop the science of malaria cartography” (125, p. e473). This needed project is starting on a global country level to map malarial prevalence year to year in an open-source accessible fashion. The data input is parasite prevalence rates based on laboratory diagnosis. The parasite prevalence can vary by age, which requires standardization (74). The MAP geographically locates archival parasite prevalence data to generate its “map.” MAP also recently incorporated land census data into their “map” of East Africa (126). Alongside MAP is mapping inherited blood disorders relevant to malarial epidemiology, like the thalassemias and hemoglobinopathies (127). Malarial drug resistance patterns have also been proposed to be mapped under the World Antimalarial Resistance Network (WARN) (128). This effort will combine pharmacokinetic data, drug-resistant single nucleotide polymorphisms, and parasite incidence data to create a real time spatial record of potential spread of drug resistance.
Geographic information systems (GIS) have been incorporated into many research studies of malaria and malarial control recently. Hakre et al. (129) used GIS to map malarial rates over a 10-year period in Belize for 156 villages. These authors found that transmission varied among geographic areas and among seasons. In Ghana, intensive GIS monitoring in a high-endemic area revealed that the individual household location in villages impacted malarial disease and vector transmission. Importantly, the houses near the forest on the outskirts of villages had more malaria, but in a heterogeneous fashion (130). Another malarial mapping project centered in Zimbabwe was pioneered in the early 1990s by Shiva Murugasampillay and used GIS and the software, Healthmapper (WHO, Geneva, Switzerland). Much of Zimbabwe was mapped with parasite prevalence and other epidemiologic indicators. Kreuels et al. (130) proposed adding malarial control process indicators, such as indoor residual spraying, bednet distribution, or drug coverage. Population, rainfall, and temperature data, as well as base maps of health facilities and districts, also could be incorporated as additional data layers. The group created the Healthmapper malarial module to integrate rainfall data into an early warning system for malarial epidemics (131). In the town of Dindigul within Tamil Nadu, India, a GIS malarial surveillance system that was associated with more than 33 parameters and malariometrics, including mosquito larva densities, was used to develop a high-resolution monitoring system (132). Gaudart et al. (133) in Mali studied 173 households identified by GIS with about 1,300 children over 5 years in a space-time cluster analysis. The group identified high-risk zones, which persisted over time. They postulated that the GIS methods led to better targeting of malarial control efforts (133).
CONCLUSIONS
Although we have made progressive strides in the epidemiologic studies of malaria by increasing the utilization of diagnostic tests, we will need to greatly augment the coverage of sensitive malarial detection. Mapping and modeling studies rely on accurate, precise diagnostic definitions of malaria and infected mosquitoes. Sustainable, effective control coupled with research will rely on integrated mapping in time and space of the complex epidemiologic factors that govern malarial distribution.
Acknowledgments
Author affiliation: The Malaria Research Institute, W. Harry Feinstone Department of Molecular Microbiology and Immunology, The Johns Hopkins Bloomberg School of Public Health, Baltimore, MD 21205.
This work was supported by the Johns Hopkins Malaria Research Institute and by the National Institutes of Health (grant RO1 AI45774-09).
Conflict of interest: D. J. S., in conjunction with Johns Hopkins University, holds patent licenses on malarial novel diagnostic devices for urine, saliva, and blood. He holds no interests in the companies.
Glossary
Abbreviations
- DDT
dichlorodiphenyltrichloroethane
- EIR
entomologic inoculation rate
- GIS
geographic information systems
- MAP
Malaria Atlas Project
- PCR
polymerase chain reaction
- RDT
rapid diagnostic test
- WHO
World Health Organization
References
- 1.Joy DA, Feng X, Mu J, et al. Early origin and recent expansion of Plasmodium falciparum. Science. 2003;300(5617):318–321. doi: 10.1126/science.1081449. [DOI] [PubMed] [Google Scholar]
- 2.Volkman SK, Barry AE, Lyons EJ, et al. Recent origin of Plasmodium falciparum from a single progenitor. Science. 2001;293(5529):482–484. doi: 10.1126/science.1059878. [DOI] [PubMed] [Google Scholar]
- 3.Mu J, Duan J, Makova KD, et al. Chromosome-wide SNPs reveal an ancient origin for Plasmodium falciparum. Nature. 2002;418(6895):323–326. doi: 10.1038/nature00836. [DOI] [PubMed] [Google Scholar]
- 4.Laveran A. Un nouveau parasite trouve dans le sang des malade atteints de fievre palustre. Origine parasitaire des accidents de l'impaludisme. (In French) Bull Acad Natl Med Paris. 1880;9:1235–1236. [Google Scholar]
- 5.Laveran CL. Classics in infectious diseases: a newly discovered parasite in the blood of patients suffering from malaria. Parasitic etiology of attacks of malaria: Charles Louis Alphonse Laveran (1845–1922) Rev Infect Dis. 1982;4(4):908–911. doi: 10.1093/4.4.908. [DOI] [PubMed] [Google Scholar]
- 6.Ross R, Smyth J. On some peculiar pigmented cells found in two mosquitos fed on malarial blood. 1897. Wilderness Environ Med. 1999;10(1):29–33. doi: 10.1580/1080-6032(1999)010[0029:osppcf]2.3.co;2. [DOI] [PubMed] [Google Scholar]
- 7.Shortt HE, Fairley NH, Covell G, et al. The pre-erythrocytic stage of Plasmodium falciparum. Trans R Soc Trop Med Hyg. 1951;44(4):405–419. doi: 10.1016/s0035-9203(51)80019-1. [DOI] [PubMed] [Google Scholar]
- 8.Shortt HE, Garnham PC. Pre-erythrocytic stage in mammalian malaria parasites [letter] Nature. 1948;161(4082):126. doi: 10.1038/161126a0. [DOI] [PubMed] [Google Scholar]
- 9.Shortt HE, Garnham PC, Covell G, et al. The pre-erythrocytic stage of human malaria, Plasmodium vivax [letter] Br Med J. 1948;1(4550):547. doi: 10.1136/bmj.1.4550.547. [DOI] [PMC free article] [PubMed] [Google Scholar]
- 10.Simmons JS. Malaria in Panama. Baltimore, MD: Johns Hopkins University Press; 1939. [Google Scholar]
- 11.Gorgas WC. Sanitation in Panama. London, United Kingdom: Appleton; 1915. [Google Scholar]
- 12.Utzinger J, Tozan Y, Doumani F, et al. The economic payoffs of integrated malaria control in the Zambian copperbelt between 1930 and 1950. Trop Med Int Health. 2002;7(8):657–677. doi: 10.1046/j.1365-3156.2002.00916.x. [DOI] [PubMed] [Google Scholar]
- 13.Killeen GF, Fillinger U, Kiche I, et al. Eradication of Anopheles gambiae from Brazil: lessons for malaria control in Africa? Lancet Infect Dis. 2002;2(10):618–627. doi: 10.1016/s1473-3099(02)00397-3. [DOI] [PubMed] [Google Scholar]
- 14.Hay SI, Guerra CA, Tatem AJ, et al. The global distribution and population at risk of malaria: past, present, and future. Lancet Infect Dis. 2004;4(6):327–336. doi: 10.1016/S1473-3099(04)01043-6. [DOI] [PMC free article] [PubMed] [Google Scholar]
- 15.Alilio MS, Bygbjerg IC, Breman JG. Are multilateral malaria research and control programs the most successful? Lessons from the past 100 years in Africa. Am J Trop Med Hyg. 2004;71(2 suppl):268–278. [PubMed] [Google Scholar]
- 16.Russell PF. World-wide malaria distribution, prevalence, and control. Am J Trop Med Hyg. 1956;5(6):937–965. doi: 10.4269/ajtmh.1956.5.937. [DOI] [PubMed] [Google Scholar]
- 17.Lysenko A, Semashko I. Geography of malaria. A medico-geographic profile of an ancient disease. In: Lebedew A, editor. Itogi Nauki:Medicinskaja Geografija. (In Russian) Moscow, Russia: Academy of Sciences, USSR; 1968. pp. 25–146. [Google Scholar]
- 18.World Health Organization. World Malaria Report 2008. Geneva, Switzerland: WHO Press; 2008. pp. 1–190. ( http://www.who.int/malaria/publications/atoz/9789241563697/en/index.htm) [Google Scholar]
- 19.Russell PF. The present status of malaria in the world. Am J Trop Med Hyg. 1952;1(1):111–123. doi: 10.4269/ajtmh.1952.1.111. [DOI] [PubMed] [Google Scholar]
- 20.Strüchler D. How much malaria is there worldwide? Parasitol Today. 1989;5(2):39–40. doi: 10.1016/0169-4758(89)90188-9. [DOI] [PubMed] [Google Scholar]
- 21.World Health Organization. World Health Report 1999: Making a Difference. Geneva, Switzerland: World Health Organization; 2000. ( http://www.who.int/whr/1999/en/index.html) [Google Scholar]
- 22.Snow RW, Guerra CA, Noor AM, et al. The global distribution of clinical episodes of Plasmodium falciparum malaria. Nature. 2005;434(7030):214–217. doi: 10.1038/nature03342. [DOI] [PMC free article] [PubMed] [Google Scholar]
- 23.Cibulskis RE, Bell D, Christophel EM, et al. Estimating trends in the burden of malaria at country level. Am J Trop Med Hyg. 2007;77(6 suppl):133–137. [PubMed] [Google Scholar]
- 24.Hay SI, Guerra CA, Gething PW, et al. A world malaria map: Plasmodium falciparum endemicity in 2007. PLoS Med. 2009 doi: 10.1371/journal.pmed.1000048. 6(3):e1000048. (doi:10.1371/journal.pmed.1000048) [DOI] [PMC free article] [PubMed] [Google Scholar]
- 25.Le Sueur D, Binka F, Lengeler C, et al. An atlas of malaria in Africa. Afr Health. 1997;19(2):23–24. [PubMed] [Google Scholar]
- 26.Omumbo J, Ouma J, Rapuoda B, et al. Mapping malaria transmission intensity using geographical information systems (GIS): an example from Kenya. Ann Trop Med Parasitol. 1998;92(1):7–21. doi: 10.1080/00034989860120. [DOI] [PubMed] [Google Scholar]
- 27.Omumbo JA, Hay SI, Snow RW, et al. Modelling malaria risk in East Africa at high-spatial resolution. Trop Med Int Health. 2005;10(6):557–566. doi: 10.1111/j.1365-3156.2005.01424.x. [DOI] [PMC free article] [PubMed] [Google Scholar]
- 28.Riedel N, Vounatsou P, Miller JM, et al. Geographical patterns and predictors of malaria risk in Zambia: Bayesian geostatistical modelling of the 2006 Zambia national malaria indicator survey (ZMIS) Malar J. 2010 doi: 10.1186/1475-2875-9-37. 9:37. ( http://www.ncbi.nlm.nih.gov/pmc/articles/PMC2845589/pdf/1475-2875-9-37.pdf) [DOI] [PMC free article] [PubMed] [Google Scholar]
- 29.Okell LC, Ghani AC, Lyons E, et al. Submicroscopic infection in Plasmodium falciparum-endemic populations: a systematic review and meta-analysis. J Infect Dis. 2009;200(10):1509–1517. doi: 10.1086/644781. [DOI] [PubMed] [Google Scholar]
- 30.Price RN, Tjitra E, Guerra CA, et al. Vivax malaria: neglected and not benign. Am J Trop Med Hyg. 2007;7(6 suppl):79–87. [PMC free article] [PubMed] [Google Scholar]
- 31.Stäger K, Legros F, Krause G, et al. Imported malaria in children in industrialized countries, 1992–2002. Emerg Infect Dis. 2009;15(2):185–191. doi: 10.3201/eid1502.080712. [DOI] [PMC free article] [PubMed] [Google Scholar]
- 32.Mali S, Steele S, Slutsker L, et al. Malaria surveillance—United States, 2006. MMWR Surveill Summ. 2008;57(5):24–39. [PubMed] [Google Scholar]
- 33.Thwing J, Skarbinski J, Newman RD, et al. Malaria surveillance—United States, 2005. MMWR Surveill Summ. 2007;56(6):23–40. [PubMed] [Google Scholar]
- 34.Skarbinski J, James EM, Causer LM, et al. Malaria surveillance—United States, 2004. MMWR Surveill Summ. 2006;55(4):23–37. [PubMed] [Google Scholar]
- 35.Eliades MJ, Shah S, Nguyen-Dinh P, et al. Malaria surveillance—United States, 2003. MMWR Surveill Summ. 2005;54(2):25–40. [PubMed] [Google Scholar]
- 36.Shah S, Filler S, Causer LM, et al. Malaria surveillance—United States, 2002. MMWR Surveill Summ. 2004;53(1):21–34. [PubMed] [Google Scholar]
- 37.Filler S, Causer LM, Newman RD, et al. Malaria surveillance—United States, 2001. MMWR Surveill Summ. 2003;52(5):1–14. [PubMed] [Google Scholar]
- 38.Newman RD, Barber AM, Roberts J, et al. Malaria surveillance—United States, 1999. MMWR Surveill Summ. 2002;51(1):15–28. [PubMed] [Google Scholar]
- 39.Mungai M, Roberts J, Barber AM, et al. Malaria surveillance—United States, 1996. MMWR CDC Surveill Summ. 2001;50(SS-1):1–24. [PubMed] [Google Scholar]
- 40.MacArthur J, Levin AR, Mungai M, et al. Malaria surveillance—United States, 1997. MMWR CDC Surveill Summ. 2001;50(ss-1):25–52. [PubMed] [Google Scholar]
- 41.Holtz TH, Kachur SP, MacArthur JR, et al. Malaria surveillance—United States, 1998. MMWR CDC Surveill Summ. 2001;50(5):1–20. [PubMed] [Google Scholar]
- 42.Williams HA, Roberts J, Kachur SP, et al. Malaria surveillance—United States, 1995. MMWR CDC Surveill Summ. 1999;48(1):1–23. [PubMed] [Google Scholar]
- 43.Kachur SP, Reller ME, Barber AM, et al. Malaria surveillance—United States, 1994. MMWR CDC Surveill Summ. 1997;46(5):1–18. [PubMed] [Google Scholar]
- 44.Barat LM, Zucker JR, Barber AM, et al. Malaria surveillance—United States, 1993. MMWR CDC Surveill Summ. 1997;46(2):27–47. [PubMed] [Google Scholar]
- 45.Zucker JR, Barber AM, Paxton LA, et al. Malaria surveillance—United States, 1992. MMWR CDC Surveill Summ. 1995;44(5):1–17. [PubMed] [Google Scholar]
- 46.Causer LM, Newman RD, Barat LM, et al. Malaria surveillance—United States, 2000. MMWR CDC Surveill Summ. 2002;51(SS-5):9–24. [Google Scholar]
- 47.Mueller I, Zimmerman PA, Reeder JC. Plasmodium malariae and Plasmodium ovale—the “bashful” malaria parasites. Trends Parasitol. 2007;23(6):278–283. doi: 10.1016/j.pt.2007.04.009. [DOI] [PMC free article] [PubMed] [Google Scholar]
- 48.Bousema JT, Drakeley CJ, Mens PF, et al. Increased Plasmodium falciparum gametocyte production in mixed infections with P. malariae. Am J Trop Med Hyg. 2008;78(3):442–448. [PubMed] [Google Scholar]
- 49.Cox-Singh J, Davis TM, Lee KS, et al. Plasmodium knowlesi malaria in humans is widely distributed and potentially life threatening. Clin Infect Dis. 2008;46(2):165–171. doi: 10.1086/524888. [DOI] [PMC free article] [PubMed] [Google Scholar]
- 50.Bronzan RN, Taylor TE, Mwenechanya J, et al. Bacteremia in Malawian children with severe malaria: prevalence, etiology, HIV coinfection, and outcome. J Infect Dis. 2007;195(6):895–904. doi: 10.1086/511437. [DOI] [PubMed] [Google Scholar]
- 51.Moody A. Rapid diagnostic tests for malaria parasites. Clin Microbiol Rev. 2002;15(1):66–78. doi: 10.1128/CMR.15.1.66-78.2002. [DOI] [PMC free article] [PubMed] [Google Scholar]
- 52.Desakorn V, Dondorp AM, Silamut K, et al. Stage-dependent production and release of histidine-rich protein 2 by Plasmodium falciparum. Trans R Soc Trop Med Hyg. 2005;99(7):517–524. doi: 10.1016/j.trstmh.2004.11.014. [DOI] [PubMed] [Google Scholar]
- 53.Dondorp AM, Desakorn V, Pongtavornpinyo W, et al. Estimation of the total parasite biomass in acute falciparum malaria from plasma PfHRP2. PLoS Med. 2005 doi: 10.1371/journal.pmed.0020204. 2(8):e204. (doi:10.1371/journal.pmed.0020204) [DOI] [PMC free article] [PubMed] [Google Scholar]
- 54.Malhotra I, Dent A, Mungai P, et al. Real-time quantitative PCR for determining the burden of Plasmodium falciparum parasites during pregnancy and infancy. J Clin Microbiol. 2005;43(8):3630–3635. doi: 10.1128/JCM.43.8.3630-3635.2005. [DOI] [PMC free article] [PubMed] [Google Scholar]
- 55.de Monbrison F, Angei C, Staal A, et al. Simultaneous identification of the four human Plasmodium species and quantification of Plasmodium DNA load in human blood by real-time polymerase chain reaction. Trans R Soc Trop Med Hyg. 2003;97(4):387–390. doi: 10.1016/s0035-9203(03)90065-4. [DOI] [PubMed] [Google Scholar]
- 56.Daubersies P, Sallenave-Sales S, Magne S, et al. Rapid turnover of Plasmodium falciparum populations in asymptomatic individuals living in a high transmission area. Am J Trop Med Hyg. 1996;54(1):18–26. doi: 10.4269/ajtmh.1996.54.18. [DOI] [PubMed] [Google Scholar]
- 57.Farnert A, Snounou G, Rooth I, et al. Daily dynamics of Plasmodium falciparum subpopulations in asymptomatic children in a holoendemic area. Am J Trop Med Hyg. 1997;56(5):538–547. doi: 10.4269/ajtmh.1997.56.538. [DOI] [PubMed] [Google Scholar]
- 58.McKenzie FE, Bossert WH. The dynamics of Plasmodium falciparum blood-stage infection. J Theor Biol. 1997;188(1):127–140. doi: 10.1006/jtbi.1997.0478. [DOI] [PubMed] [Google Scholar]
- 59.McKenzie FE, Bossert WH. An integrated model of Plasmodium falciparum dynamics. J Theor Biol. 2005;232(3):411–426. doi: 10.1016/j.jtbi.2004.08.021. [DOI] [PubMed] [Google Scholar]
- 60.McKenzie FE, Jeffery GM, Collins WE. Plasmodium malariae blood-stage dynamics. J Parasitol. 2001;87(3):626–637. doi: 10.1645/0022-3395(2001)087[0626:PMBSD]2.0.CO;2. [DOI] [PMC free article] [PubMed] [Google Scholar]
- 61.McKenzie FE, Jeffery GM, Collins WE. Plasmodium vivax blood-stage dynamics. J Parasitol. 2002;88(3):521–535. doi: 10.1645/0022-3395(2002)088[0521:PVBSD]2.0.CO;2. [DOI] [PMC free article] [PubMed] [Google Scholar]
- 62.Ochola LB, Marsh K, Lowe B, et al. Estimation of the sequestered parasite load in severe malaria patients using both host and parasite markers. Parasitology. 2005;131(pt 4):449–458. doi: 10.1017/S0031182005008085. [DOI] [PubMed] [Google Scholar]
- 63.Drakeley C, Sutherland C, Bousema JT, et al. The epidemiology of Plasmodium falciparum gametocytes: weapons of mass dispersion. Trends Parasitol. 2006;22(9):424–430. doi: 10.1016/j.pt.2006.07.001. [DOI] [PubMed] [Google Scholar]
- 64.Drakeley CJ, Akim NI, Sauerwein RW, et al. Estimates of the infectious reservoir of Plasmodium falciparum malaria in The Gambia and in Tanzania. Trans R Soc Trop Med Hyg. 2000;94(5):472–476. doi: 10.1016/s0035-9203(00)90056-7. [DOI] [PubMed] [Google Scholar]
- 65.Pethleart A, Prajakwong S, Suwonkerd W, et al. Infectious reservoir of Plasmodium infection in Mae Hong Son Province, north-west Thailand. Malar J. 2004;3:34. doi: 10.1186/1475-2875-3-34. (doi:10.1186/1475-2875-3-34) [DOI] [PMC free article] [PubMed] [Google Scholar]
- 66.Drakeley CJ, Secka I, Correa S, et al. Host haematological factors influencing the transmission of Plasmodium falciparum gametocytes to Anopheles gambiae s.s. mosquitoes. Trop Med Int Health. 1999;4(2):131–138. doi: 10.1046/j.1365-3156.1999.00361.x. [DOI] [PubMed] [Google Scholar]
- 67.Trager W, Gill GS. Enhanced gametocyte formation in young erythrocytes by Plasmodium falciparum in vitro. J Protozool. 1992;39(3):429–432. doi: 10.1111/j.1550-7408.1992.tb01476.x. [DOI] [PubMed] [Google Scholar]
- 68.Trager W, Gill GS, Lawrence C, et al. Plasmodium falciparum: enhanced gametocyte formation in vitro in reticulocyte-rich blood. Exp Parasitol. 1999;91(2):115–118. doi: 10.1006/expr.1998.4347. [DOI] [PubMed] [Google Scholar]
- 69.Robert V, Tchuinkam T, Mulder B, et al. Effect of the sickle cell trait status of gametocyte carriers of Plasmodium falciparum on infectivity to anophelines. Am J Trop Med Hyg. 1996;54(2):111–113. doi: 10.4269/ajtmh.1996.54.111. [DOI] [PubMed] [Google Scholar]
- 70.Linden A. Measuring diagnostic and predictive accuracy in disease management: an introduction to receiver operating characteristic (ROC) analysis. J Eval Clin Pract. 2006;12(2):132–139. doi: 10.1111/j.1365-2753.2005.00598.x. [DOI] [PubMed] [Google Scholar]
- 71.Sackett DL, Haynes RB, Guyatt GH, et al. Clinical Epidemiology. 2nd ed. Boston, MA: Little and Brown and Company; 1991. [Google Scholar]
- 72.Khairnar K, Martin D, Lau R, et al. Multiplex real-time quantitative PCR, microscopy and rapid diagnostic immuno-chromatographic tests for the detection of Plasmodium spp: performance, limit of detection analysis and quality assurance. Malar J. 2009;8:284. doi: 10.1186/1475-2875-8-284. (doi:10.1186/1475-2875-8-284) [DOI] [PMC free article] [PubMed] [Google Scholar]
- 73.de Pagter PJ, Schuurman R, de Vos NM, et al. Multicenter external quality assessment of molecular methods for the detection of human herpesvirus 6 [published online ahead of print] J Clin Microbiol. 2010 doi: 10.1128/JCM.01145-09. (doi:10.1128/JCM.01145–09) [DOI] [PMC free article] [PubMed] [Google Scholar]
- 74.Smith DL, Guerra CA, Snow RW, et al. Standardizing estimates of the Plasmodium falciparum parasite rate. Malar J. 2007;6:131. doi: 10.1186/1475-2875-6-131. (doi:10.1186/1475-2875-6-131) [DOI] [PMC free article] [PubMed] [Google Scholar]
- 75.Wernsdorfer WH, McGregor I. Malaria: Principles and Practice of Malariology. Vol 2. Edinburgh, United Kingdom: Churchill Livingstone; 1988. [Google Scholar]
- 76.Kiang R, Adimi F, Soika V, et al. Meteorological, environmental remote sensing and neural network analysis of the epidemiology of malaria transmission in Thailand. Geospat Health. 2006;1(1):71–84. doi: 10.4081/gh.2006.282. [DOI] [PubMed] [Google Scholar]
- 77.Shiff C. Integrated approach to malaria control. Clin Microbiol Rev. 2002;15(2):278–293. doi: 10.1128/CMR.15.2.278-293.2002. [DOI] [PMC free article] [PubMed] [Google Scholar]
- 78.Gorman MJ, Severson DW, Cornel AJ, et al. Mapping a quantitative trait locus involved in melanotic encapsulation of foreign bodies in the malaria vector. Anopheles gambiae. Genetics. 1997;146(3):965–971. doi: 10.1093/genetics/146.3.965. [DOI] [PMC free article] [PubMed] [Google Scholar]
- 79.Blandin SA, Wang-Sattler R, Lamacchia M, et al. Dissecting the genetic basis of resistance to malaria parasites in Anopheles gambiae. Science. 2009;326(5949):147–150. doi: 10.1126/science.1175241. [DOI] [PMC free article] [PubMed] [Google Scholar]
- 80.Riehle MM, Markianos K, Lambrechts L, et al. A major genetic locus controlling natural Plasmodium falciparum infection is shared by East and West African Anopheles gambiae. Malar J. 2007;6:87. doi: 10.1186/1475-2875-6-87. (doi:10.1186/1475-2875-6-87) [DOI] [PMC free article] [PubMed] [Google Scholar]
- 81.Riehle MM, Xu J, Lazzaro BP, et al. Anopheles gambiae APL1 is a family of variable LRR proteins required for Rel1-mediated protection from the malaria parasite, Plasmodium berghei. PLoS One. 2008;3(11) doi: 10.1371/journal.pone.0003672. e3672. (doi: 10.1371/journal.pone.0003672) [DOI] [PMC free article] [PubMed] [Google Scholar]
- 82.Ranson H, Jensen B, Wang X, et al. Genetic mapping of two loci affecting DDT resistance in the malaria vector Anopheles gambiae. Insect Mol Biol. 2000;9(5):499–507. doi: 10.1046/j.1365-2583.2000.00214.x. [DOI] [PubMed] [Google Scholar]
- 83.Bass C, Nikou D, Donnelly MJ, et al. Detection of knockdown resistance (kdr) mutations in Anopheles gambiae: a comparison of two new high-throughput assays with existing methods. Malar J. 2007;6:111. doi: 10.1186/1475-2875-6-111. (doi:10.1371/journal.pone.0003672) [DOI] [PMC free article] [PubMed] [Google Scholar]
- 84.Diabaté A, Baldet T, Chandre F, et al. First report of a kdr mutation in Anopheles arabiensis from Burkina Faso, West Africa. J Am Mosq Control Assoc. 2004;20(2):195–196. [PubMed] [Google Scholar]
- 85.Verhaeghen K, Van Bortel W, Trung HD, et al. Absence of knockdown resistance suggests metabolic resistance in the main malaria vectors of the Mekong region. Malar J. 2009;8:84. doi: 10.1186/1475-2875-8-84. (doi:10.1186/1475-2875-8-84) [DOI] [PMC free article] [PubMed] [Google Scholar]
- 86.Wellems TE, Plowe CV. Chloroquine-resistant malaria. J Infect Dis. 2001;184(6):770–776. doi: 10.1086/322858. [DOI] [PubMed] [Google Scholar]
- 87.Vieira PP, Ferreira MU, Alecrim MG, et al. pfcrt Polymorphism and the spread of chloroquine resistance in Plasmodium falciparum populations across the Amazon Basin. J Infect Dis. 2004;190(2):417–424. doi: 10.1086/422006. [DOI] [PubMed] [Google Scholar]
- 88.Wootton JC, Feng X, Ferdig MT, et al. Genetic diversity and chloroquine selective sweeps in Plasmodium falciparum. Nature. 2002;418(6895):320–323. doi: 10.1038/nature00813. [DOI] [PubMed] [Google Scholar]
- 89.McCollum AM, Poe AC, Hamel M, et al. Antifolate resistance in Plasmodium falciparum: multiple origins and identification of novel dhfr alleles. J Infect Dis. 2006;194(2):189–197. doi: 10.1086/504687. [DOI] [PubMed] [Google Scholar]
- 90.Laufer MK, Thesing PC, Eddington ND, et al. Return of chloroquine antimalarial efficacy in Malawi. N Engl J Med. 2006;355(19):1959–1966. doi: 10.1056/NEJMoa062032. [DOI] [PubMed] [Google Scholar]
- 91.Lantos PM, Ahouidi AD, Bei AK, et al. Erythrocyte invasion profiles are associated with a common invasion ligand polymorphism in Senegalese isolates of Plasmodium falciparum. Parasitology. 2009;136(1):1–9. doi: 10.1017/S0031182008005167. [DOI] [PubMed] [Google Scholar]
- 92.Su XZ, Heatwole VM, Wertheimer SP, et al. The large diverse gene family var encodes proteins involved in cytoadherence and antigenic variation of Plasmodium falciparum-infected erythrocytes. Cell. 1995;82(1):89–100. doi: 10.1016/0092-8674(95)90055-1. [DOI] [PubMed] [Google Scholar]
- 93.Smith JD, Gamain B, Baruch DI, et al. Decoding the language of var genes and Plasmodium falciparum sequestration. Trends Parasitol. 2001;17(11):538–545. doi: 10.1016/s1471-4922(01)02079-7. [DOI] [PubMed] [Google Scholar]
- 94.Volkman SK, Sabeti PC, DeCaprio D, et al. A genome-wide map of diversity in Plasmodium falciparum. Nat Genet. 2007;39(1):113–119. doi: 10.1038/ng1930. [DOI] [PubMed] [Google Scholar]
- 95.Djimdé AA, Doumbo OK, Traore O, et al. Clearance of drug-resistant parasites as a model for protective immunity in Plasmodium falciparum malaria. Am J Trop Med Hyg. 2003;69(5):558–563. [PubMed] [Google Scholar]
- 96.Oh SS, Chishti AH. Host receptors in malaria merozoite invasion. Curr Top Microbiol Immunol. 2005;295:203–232. doi: 10.1007/3-540-29088-5_8. [DOI] [PubMed] [Google Scholar]
- 97.Cavasini CE, Mattos LC, Couto AA, et al. Plasmodium vivax infection among Duffy antigen-negative individuals from the Brazilian Amazon region: an exception? Trans R Soc Trop Med Hyg. 2007;101(10):1042–1044. doi: 10.1016/j.trstmh.2007.04.011. [DOI] [PubMed] [Google Scholar]
- 98.Allison AC. Protection afforded by sickle-cell trait against subtertian malareal infection. Br Med J. 1954;1(4857):290–294. doi: 10.1136/bmj.1.4857.290. [DOI] [PMC free article] [PubMed] [Google Scholar]
- 99.Allison AC. Two lessons from the interface of genetics and medicine. Genetics. 2004;166(4):1591–1599. doi: 10.1534/genetics.166.4.1591. [DOI] [PMC free article] [PubMed] [Google Scholar]
- 100.Williams TN, Mwangi TW, Wambua S, et al. Sickle cell trait and the risk of Plasmodium falciparum malaria and other childhood diseases. J Infect Dis. 2005;192(1):178–186. doi: 10.1086/430744. [DOI] [PMC free article] [PubMed] [Google Scholar]
- 101.Fairhurst RM, Baruch DI, Brittain NJ, et al. Abnormal display of PfEMP-1 on erythrocytes carrying haemoglobin C may protect against malaria. Nature. 2005;435(7045):1117–1121. doi: 10.1038/nature03631. [DOI] [PubMed] [Google Scholar]
- 102.Arie T, Fairhurst RM, Brittain NJ, et al. Hemoglobin C modulates the surface topography of Plasmodium falciparum-infected erythrocytes. J Struct Biol. 2005;150(2):163–169. doi: 10.1016/j.jsb.2005.02.008. [DOI] [PubMed] [Google Scholar]
- 103.Cholera R, Brittain NJ, Gillrie MR, et al. Impaired cytoadherence of Plasmodium falciparum-infected erythrocytes containing sickle hemoglobin. Proc Natl Acad Sci U S A. 2008;105(3):991–996. doi: 10.1073/pnas.0711401105. [DOI] [PMC free article] [PubMed] [Google Scholar]
- 104.Roberts DJ, Casals-Pascual C, Weatherall DJ. The clinical and pathophysiological features of malarial anaemia. Curr Top Microbiol Immunol. 2005;295:137–167. doi: 10.1007/3-540-29088-5_6. (doi: 10.1007/3-540-29088-5_6) [DOI] [PubMed] [Google Scholar]
- 105.Beutler E, Duparc S. G6PD Deficiency Working Group. Glucose-6-phosphate dehydrogenase deficiency and antimalarial drug development. Am J Trop Med Hyg. 2007;77(4):779–789. [PubMed] [Google Scholar]
- 106.Sabeti PC, Reich DE, Higgins JM, et al. Detecting recent positive selection in the human genome from haplotype structure. Nature. 2002;419(6909):832–837. doi: 10.1038/nature01140. [DOI] [PubMed] [Google Scholar]
- 107.Shankar AH. Nutritional modulation of malaria morbidity and mortality. J Infect Dis. 2000;182(suppl 1):S37–S53. doi: 10.1086/315906. [DOI] [PubMed] [Google Scholar]
- 108.Rogerson SJ, Hviid L, Duffy PE, et al. Malaria in pregnancy: pathogenesis and immunity. Lancet Infect Dis. 2007;7(2):105–117. doi: 10.1016/S1473-3099(07)70022-1. [DOI] [PubMed] [Google Scholar]
- 109.Hartgers FC, Obeng BB, Kruize YC, et al. Responses to malarial antigens are altered in helminth-infected children. J Infect Dis. 2009;199(10):1528–1535. doi: 10.1086/598687. [DOI] [PubMed] [Google Scholar]
- 110.Nacher M, Gay F, Singhasivanon P, et al. Ascaris lumbricoides infection is associated with protection from cerebral malaria. Parasite Immunol. 2000;22(3):107–113. doi: 10.1046/j.1365-3024.2000.00284.x. [DOI] [PubMed] [Google Scholar]
- 111.Briand V, Watier L, Le Hesran JY, et al. Coinfection with Plasmodium falciparum and Schistosoma haematobium: protective effect of schistosomiasis on malaria in Senegalese children? Am J Trop Med Hyg. 2005;72(6):702–707. [PubMed] [Google Scholar]
- 112.Su Z, Segura M, Morgan K, et al. Impairment of protective immunity to blood-stage malaria by concurrent nematode infection. Infect Immun. 2005;73(6):3531–3539. doi: 10.1128/IAI.73.6.3531-3539.2005. [DOI] [PMC free article] [PubMed] [Google Scholar]
- 113.Orem J, Mbidde EK, Lambert B, et al. Burkitt's lymphoma in Africa, a review of the epidemiology and etiology. Afr Health Sci. 2007;7(3):166–175. doi: 10.5555/afhs.2007.7.3.166. [DOI] [PMC free article] [PubMed] [Google Scholar]
- 114.Karp CL, Auwaerter PG. Coinfection with HIV and tropical infectious diseases. I. Protozoal pathogens. Clin Infect Dis. 2007;45(9):1208–1213. doi: 10.1086/522181. [DOI] [PubMed] [Google Scholar]
- 115.Thang ND, Erhart A, Speybroeck N, et al. Malaria in central Vietnam: analysis of risk factors by multivariate analysis and classification tree models. Malar J. 2008;7:28. doi: 10.1186/1475-2875-7-28. (doi:10.1186/1475-2875-7-28) [DOI] [PMC free article] [PubMed] [Google Scholar]
- 116.Smith DL, McKenzie FE, Snow RW, et al. Revisiting the basic reproductive number for malaria and its implications for malaria control. PLoS Biol. 2007 doi: 10.1371/journal.pbio.0050042. 5(3):e42. (doi:10.1371/journal.pbio.0050042) [DOI] [PMC free article] [PubMed] [Google Scholar]
- 117.Clyde DF. Recent trends in the epidemiology and control of malaria. Epidemiol Rev. 1987;9:219–243. doi: 10.1093/oxfordjournals.epirev.a036303. ( http://epirev.oxfordjournals.org/cgi/reprint/9/1/219.pdf) [DOI] [PubMed] [Google Scholar]
- 118.White NJ. The role of anti-malarial drugs in eliminating malaria. Malar J. 2008 doi: 10.1186/1475-2875-7-S1-S8. 7(suppl 1):S8. (doi:10.1186/1475-2875-7-S1-S8) [DOI] [PMC free article] [PubMed] [Google Scholar]
- 119.White NJ. Intermittent presumptive treatment for malaria. PLoS Med. 2005 doi: 10.1371/journal.pmed.0020003. 2(1):e3. (doi:10.1371/journal.pmed.0020003) [DOI] [PMC free article] [PubMed] [Google Scholar]
- 120.Moorthy VS, Ballou WR. Immunological mechanisms underlying protection mediated by RTS, S: a review of the available data. Malar J. 2009;8(1):312. doi: 10.1186/1475-2875-8-312. (doi:10.1186/1475-2875-8-312) [DOI] [PMC free article] [PubMed] [Google Scholar]
- 121.Vekemans J, Leach A, Cohen J. Development of the RTS, S/AS malaria candidate vaccine. Vaccine. 2009;27(suppl 6):G67–G71. doi: 10.1016/j.vaccine.2009.10.013. [DOI] [PubMed] [Google Scholar]
- 122.Luke TC, Hoffman SL. Rationale and plans for developing a non-replicating, metabolically active, radiation-attenuated Plasmodium falciparum sporozoite vaccine. J Exp Biol. 2003;206(pt 21):3803–3808. doi: 10.1242/jeb.00644. [DOI] [PubMed] [Google Scholar]
- 123.Carter R, Mendis KN, Roberts D. Spatial targeting of interventions against malaria. Bull World Health Organ. 2000;78(12):1401–1411. [PMC free article] [PubMed] [Google Scholar]
- 124.Woolhouse ME, Dye C, Etard JF, et al. Heterogeneities in the transmission of infectious agents: implications for the design of control programs. Proc Natl Acad Sci U S A. 1997;94(1):338–342. doi: 10.1073/pnas.94.1.338. [DOI] [PMC free article] [PubMed] [Google Scholar]
- 125.Hay SI, Snow RW. The malaria Atlas Project: developing global maps of malaria risk. PLoS Med. 2006 doi: 10.1371/journal.pmed.0030473. 3(12):e473. (doi:10.1371/journal.pmed.0030473) [DOI] [PMC free article] [PubMed] [Google Scholar]
- 126.Tatem AJ, Noor AM, von Hagen C, et al. High resolution population maps for low income nations: combining land cover and census in East Africa. PLoS One. 2007 doi: 10.1371/journal.pone.0001298. 2(12):e1298. (doi:10.1371/journal.pone.0001298) [DOI] [PMC free article] [PubMed] [Google Scholar]
- 127.Hay S. Malaria Atlas Project—inherited blood disorders. ( http://www.map.ox.ac.uk/inherited-blood-disorders/). (Accessed March 1, 2010) [Google Scholar]
- 128.Sibley CH, Barnes KI, Plowe CV. The rationale and plan for creating a World Antimalarial Resistance Network (WARN) (electronic article) Malar J. 2007;6:118. doi: 10.1186/1475-2875-6-118. [DOI] [PMC free article] [PubMed] [Google Scholar]
- 129.Hakre S, Masuoka P, Vanzie E, et al. Spatial correlations of mapped malaria rates with environmental factors in Belize, Central America. Int J Health Geogr. 2004;3(1):6. doi: 10.1186/1476-072X-3-6. [DOI] [PMC free article] [PubMed] [Google Scholar]
- 130.Kreuels B, Kobbe R, Adjei S, et al. Spatial variation of malaria incidence in young children from a geographically homogeneous area with high endemicity. J Infect Dis. 2008;197(1):85–93. doi: 10.1086/524066. [DOI] [PubMed] [Google Scholar]
- 131.Grover-Kopec E, Kawano M, Klaver RW, et al. An online operational rainfall-monitoring resource for epidemic malaria early warning systems in Africa. Malar J. 2005 doi: 10.1186/1475-2875-4-6. 4:6. (doi: 10.1186/1475-2875-4-6) [DOI] [PMC free article] [PubMed] [Google Scholar]
- 132.Srivastava A, Nagpal BN, Saxena R, et al. GIS based malaria information for management system for urban malaria scheme in India. Comput Methods Programs Biomed. 2003;71(1):63–75. doi: 10.1016/s0169-2607(02)00056-1. [DOI] [PubMed] [Google Scholar]
- 133.Gaudart J, Poudiougou B, Dicko A, et al. Space-time clustering of childhood malaria at the household level: a dynamic cohort in a Mali village. BMC Public Health. 2006;6:286. doi: 10.1186/1471-2458-6-286. (doi:10.1186/1471–2458-6-286) [DOI] [PMC free article] [PubMed] [Google Scholar]