Abstract
Background/Aims
Association studies using unrelated individuals have become the most popular design for mapping complex traits. One of the major challenges of association mapping is avoiding spurious association due to population stratification. Principal component analysis (PCA) on genome-wide marker genotypes is one of the most popular population stratification control methods. It implicitly assumes that the markers are in linkage equilibrium, a condition that is rarely satisfied and that we plan to relax.
Methods
We carefully examined the impact of linkage disequilibrium (LD) on PCA, and proposed a simple modification of the standard PCA to automatically adjust for the correlations among markers.
Results
We demonstrated that LD patterns in genome-wide association datasets can distort the techniques for stratification control, showing ‘subpopulations’ reflecting localized LD phenomena rather than plausible population structure. We showed that the proposed method effectively removes the artifactual effect of LD patterns, and successfully recovers underlying population structure that is not apparent from standard PCA.
Conclusion
PCA is highly influenced by sets of SNPs with high LD, obscuring the true population substructure. Our shrinkage PCA applies to all available markers, regardless of the LD patterns. The proposed method is easier to implement than most existing LD adjusted PCA methods.
Key Words: PCA, Loadings, GWAS
Introduction
Over the past two decades, considerable effort has been expended to detect and map the genetic loci contributing to complex diseases. Association and linkage studies are the two main strategies for this purpose. Association studies using unrelated individuals have become the dominant study design for genome-wide association scans (GWAS), partly because accrual of patients and controls is easier than for family-based designs. It has been argued that direct association mapping is more powerful than linkage analysis for identifying loci with small effects [Risch and Merikangas, 1996]. Association mapping is typically also more precise, because the association of genotypes with disease drops rapidly in the vicinity of a risk locus, due to a large number of historical recombinations for an ancient variant [Cardon and Bell, 2001; Cardon and Palmer, 2003; Daly and Day, 2001; Elston, 1998; Schulze et al., 2002]. Several successful GWA studies have been reported recently, identifying genetic variants contributing to, for example, type 2 diabetes [Saxena et al., 2007; Scott et al., 2007; Sladek et al., 2007; Zeggini et al., 2007], breast cancer [Easton et al., 2007], and numerous other diseases. However, it has long been discussed that association studies are susceptible to underlying population stratification, which can produce spurious association [Cardon and Palmer, 2003]. A number of techniques have been proposed to account for population substructure in designs using unrelated individuals. These techniques include using aggregate summaries of association statistics to estimate the inflation produced by stratification (genomic control of Devlin and Roeder [1999]; Schork [2001]). Other approaches use marker genotypes to model the population structure directly, performing association tests conditional on the inferred structure (structured assessment of Pritchard et al. [2000a; 2000b]). Satten et al. [2001] and Zhu et al. [2002] developed similar approaches which account for uncertainty in stratum classification. Similarly, Zhang et al. [2003] have proposed to use principal component analysis (PCA) to estimate genetic background covariates, which then are used in adjusting tests of association. One limitation of the classical PCA methods is that the number of markers cannot exceed the number of subjects. Price et al. [2006] exploited the structure of rescaled genotype matrices to extend the PCA method to modern genome scans, in which hundreds of thousands of SNPs are genotyped. Due to the popularity of this approach (implemented in the software EigenSoft), we will refer to it as the ‘standard’ PCA approach.
A number of investigators have considered the number of markers required to identify and control for population stratification. Earlier efforts primarily envisioned stratification at the level of continental populations [Bacanu et al., 2000; Devlin and Roeder, 1999; Pritchard et al., 2000a], requiring as few as 20–500 markers [Pritchard and Rosenberg, 1999]. However, with so few markers, sensitivity can be poor under moderate stratification [Freedman et al., 2004; Hao et al., 2004]. For this reason, modern PCA-based methods are appealing, because they can in principle use the entire dataset for stratification control, ranging from moderate-scale candidate gene studies to whole genome scans.
Unfortunately, the use of all available data presents a problem as well. Except for genomic control, all of the methods described above assume that the markers used for stratification control are unlinked. Falush et al. [2003] proposed a procedure to identify population structure using correlated markers, but their method is limited and not applicable to situations with tightly linked markers. Price et al. [2006] initially suggested that markers in linkage disequilibrium (LD) have little effect on PC-based stratification analysis, but subsequently proposed reducing marker LD via regression [Patterson et al., 2006]. Fellay et al. [2007] utilized a ‘thinning’ approach in which only a subset of markers with low pairwise correlation was retained for stratification control. The use of thinning involves discarding large and potentially informative portions of the data, and identification of the low-correlation subset can require considerable computation, and perhaps iteration. Although the potential problems posed by dependent markers are increasingly recognized, to our knowledge the consequences of using dependent markers has not been carefully investigated.
In this paper, we demonstrate that LD patterns in genome-wide association datasets can distort the techniques for stratification control, showing ‘subpopulations’ that reflect localized LD phenomena rather than plausible population structure. Further analysis based on such spurious stratification may provide inadequate protection from genuine stratification, and may reduce mapping power in key regions of the genome. To account for the LD structure, we propose a simple modification of the standard PCA approach to automatically adjust for the correlations among markers and accurately infer population stratification. The usefulness of our approach is demonstrated by simulations and application to candidate gene and genome-wide association studies.
Material and Methods
When principal components are used to identify subpopulations, it is implicitly assumed that all variables are of similar importance [Chatfield and Collins, 1981; Morrison, 1976]. In association mapping, some groups of SNPs may be highly correlated (both positively and negatively) due to localized LD, while other sets of SNPs may have low correlation. Principal component (PC) analysis finds projections of the data with high variability. Correlated SNPs will therefore have high loadings, because correlated random variables can generate linear combinations with high variability. As we demonstrate, the net effect is to give higher weight to groups of correlated SNPs, although there is little reason to believe that such SNPs will perform well in differentiating among subpopulations. An intermediate goal, therefore, is to eliminate the distorting effect of the redundant information provided by groups of highly correlated SNP genotypes. The weighted PCA method of Greenacre [1984] was proposed for similar problems by using weights or new PCA metrics. In time series applications, Diamantaras and Kung [1996] have used weighted covariance matrices, with weights decreasing geometrically with the distance in time between observations. In atmospheric science, weights have been used to account for uneven spacing between sampling locations [Cheng, 2002]. Similar weighting ideas might be used in GWAS analysis, as pronounced LD is largely a localized phenomenon on the genome. However, the extent of LD between loci is not a fixed function of physical distance [Maniatis et al., 2002] and varies across subpopulations [Service et al., 2006]. The use of data-driven weighting would be preferred, to directly address the problematic effects of correlation in the data at hand. In addition, any weighting scheme must be scalable up to the common GWAS situation in which the number of variables (SNPs) is far larger than the number of observations. Accordingly, we propose a unified shrinkage method that deals with all markers simultaneously, effectively down-weighting SNPs that belong to highly correlated groups, while leaving independent SNPs unchanged.
Our proposed shrinkage method is a modification of the PCA method of Price et al. [2006]. Let gij represent the (i,j)-th element of the genotype matrix g, corresponding to SNP i and individual j, i = 1,…,M and j = 1,…,N. By convention, gij is coded numerically as the number of copies of a referent allele (the minor allele, say) for the SNP. Each row i of g is first mean-centered around μi = Σjgij/N (missing entries are excluded from the computation of μi and subsequently set to 0). Row i is then scaled by dividing each entry by the standard deviation , where is the estimated allele frequency at SNP i. Denoting the resulting matrix X, Price et al. [2006] define the k-th axis of variation to be the k-th eigenvector of C, where C = XTX. The coordinate j of the k-th eigenvector represents the ancestry of individual j along the k-th axis of variation. Unlike the classical application of principal components [Jolliffe, 2002] which is based on the M × M matrix D = XXT, standard PCA for genome-wide studies [Price et al., 2006] uses the N × N matrix C, which is typically of much smaller dimension in GWAS studies. The justification for this approach arises from the close relationship between singular value decomposition and PCA when the latter is performed on mean centered data (see, for example, Wall et al. [2003]). EigenSoft employs the singular value decomposition X = USVT, where U is an M × N matrix whose k-th column contains coordinates uik of each SNP i along the k-th principal component, S is a diagonal matrix of singular values, and V is an N × N matrix whose k-th column contains ancestries νjk of each individual j along the k-th principal component. It follows that XTX = VS2VT. Thus, the columns of V are the eigenvectors of the matrix XTX. After PC analysis, pairwise scatter plots of the top few PC axes are often used to investigate potential population stratification. In addition to the PCs, the loading coefficients associated with each PC can be calculated, but are often overlooked. Loadings calculate the contribution of each SNP for a given PC. When M ≤ N, the loadings can be uniquely determined; otherwise, they are not. For a given PC k, at SNP i, uik is the loading coefficient for the SVD analysis at the SNP. The loadings can be calculated as
where ek is the corresponding eigenvalue of the PC k. These loadings are closely related to the gamma coefficients
described in Price et al. [2006]. We have
when there are no missing genotypes at SNP i, and we therefore have
If some genotypes are missing at SNP i, the above equality remains approximately correct, unless the rate of missing genotypes is high.
EigenSoft treats each SNP in an equal manner. However, as we demonstrate below, the direct use of C in fact results in loadings that can be dominated by small groups of correlated SNPs. To correct for this phenomenon, we propose a new approach to weighted PC analysis. First, we define an M-vector w of SNP weights, and accompanying diagonal matrix W with weights w on the main diagonal. Then we create a new M × N matrix X = WX, which is directly substituted for X in the PC analysis as described in Price et al. [2006]. Therefore the shrinkage PCA is essentially standard PCA for shrunken genotype data.
Our choice of weights follows the logic that linear combinations of genotypes (which comprise the eigenvectors) should exert influence determined by the amount of independent information. We heuristically choose weights for SNP i, where is the observed squared Pearson correlation between i-th and i′-th SNPs. In practice, our summation over SNPs i′ in calculating the weights is performed only in the vicinity of i, in order to filter out the cumulative effect of random apparent correlation across the genome. We will refer to the set of such SNPs as window[i], and these SNPs may range up to several hundred kb from SNP i, as chosen by the researcher and appropriate to the platform. In addition, the effects of noise in the use of r2 (which must always be positive) is reduced by requiring that r2 exceed a threshold c. Thus the precise weighting scheme is
In this manner SNPs that are highly correlated with each other are down-weighted, de-emphasizing their importance. Our choice of weights has the following desirable characteristics. If all markers are independent and there exists no population stratification, for all i′ and therefore . If all pairs of m0 markers have r2 = 1 with each other and zero correlation with other markers, then the weighting factor is , effectively providing variance contributions of the m0 markers equivalent to that of a single marker. Finally, if correlation among all pairs of markers is non-zero but approximately equal, as would be produced in idealized models of population stratification, then the weights will also be constant. Therefore for some c, and the net effect is that markers are treated equally, as in standard PCA.
Plots of loading coefficients display the contribution of each SNP to a given PC, but also present a global picture of the influence of SNPs in regions of high LD. Our experience suggests that routinely checking plots of loading coefficients is very useful in identifying regions with high influence on a PC.
Simulation Set Ups and Real Data Descriptions
We simulate both candidate gene and GWAS association studies to thoroughly investigate the effects of LD on PC analysis. We then investigate the power and type I error issues from the downstream analysis after the PCA analysis by simulated GWAS data. We finally apply our proposed method to a real candidate gene association study and to a GWAS study. The following four different methods were applied and compared: (1) standard PCA with no LD correction; (2) shrinkage PCA; (3) regression PCA [Patterson et al., 2006] in EigenSoft, and (4) thinning PCA implemented in Plink [Purcell et al., 2007]. For the regression PCA, we followed the recommendation of EigenSoft, where previously 2 SNPs were used in the regression analysis. For the thinning PCA, we thinned out SNPs based on pairwise correlation, such that no pair of SNPs had r2 > 0.2 [Fellay et al., 2007]. For the weight wi of SNP i, the shrinkage PC method used 300 SNPs in its vicinity as the window, and c = 0.2, unless otherwise specified.
Simulation 1 (Candidate SNP Analysis)
First, a stratified population with two subpopulations was simulated. A total of 400 individuals were sampled, with 200 from each subpopulation. 200 markers were simulated, each with 3 possible genotypes and minor allele frequency ranging uniformly from 0 to 0.5. All markers were unlinked and in linkage equilibrium within each subpopulation. Next, a stratified population was simulated, with the same number of individuals and markers as described above. However, here two subsets of markers were chosen to be in high LD with each other within each subpopulation.
Simulation 2 (GWAS Data for Type I Error and Power Investigation)
In this simulation, a stratified population with three subpopulations was simulated, with 650 samples from population one, 300 samples from population two, and 50 samples from population three. ‘Seed SNPs’ were first generated using the Balding-Nichols model [Balding and Nichols, 1995] according to Fst values sampled from 0.062χ21. For each seed SNP, we created an LD block, within which the number of correlated SNPs follows the distribution of 0.7 poisson(10) + 0.3 poisson(100), and the SNPs correlate with the seed SNP (with correlations ranging from 0.4 to 0.8). In addition, one large LD block with 400 SNPs and high correlation (0.8) between the seed SNP and the other SNPs was simulated to the challenges posed by such a dominating block, which is similar to the difficulties posed by the presence of the large HLA region on chromosome 6. Previous studies have shown that even within European populations, SNPs with Fst values ranging from 0.1 to 0.3 between northern and southeastern subpopulations can be observed [Bauchet et al., 2007]. Accordingly, we augmented the original Fst values with an additional set of 20 independent SNPs with high Fst values between 0.1 and 0.3. We performed 10,000 simulations and within each simulation, the final number of SNPs was 100,000.
To investigate if the four PCA methods properly control false positive rates, we simulated a case-control outcome variable which was related to the subpopulations. Using z1 and z2 to denote the population (z1 = 1 or 0 for population two or otherwise; z2 = 1 or 0 for population three or otherwise), we simulated the data according to the following model:
The case/control status was independent of any SNP genotypes within each subpopulation. The top 3 PCs were included in the subsequent analyses. As a measure of false positive rate control, we compared the frequency with which the various approaches rejected at least one of the 20 SNPs with the highest Fst. This approach was computationally efficient, and we reasoned that inflation of type I error would be largely due to these SNPs. In this manner, by applying genome-wide appropriate thresholds to these SNPs for each of 10,000 simulations, we obtained a lower bound for the overall type I error. Further, the model with known strata was used as a gold standard to compare the PCA-based methods. We emphasize that the actual Fst values cannot be known to the researcher without knowledge of the subpopulation indices, and so stratification control is an essential part of the analytic process.
To compare the power, we next simulated the data from model
where g is the number of minor alleles in the causal SNP. The causal SNP was randomly chosen among the 100,000 SNPs in each simulation. To further investigate how the four PCA methods perform in mapping SNPs located in large LD blocks, we also restrict causal SNPs within the big LD block simulated as above. We included the top three PCs in the four PCA methods and compared them to the gold standard in which stratum membership was known and included as a class variable.
Real Data Analysis 1 (Candidate Gene Modifier Study of Cystic Fibrosis)
This real example is from a candidate gene modifier study of cystic fibrosis (CF) underway at the University of North Carolina and Case-Western Reserve University. Over 1,000 SNPs have been genotyped in 263 severe CF patients and 545 mild CF patients, using the Illumina 1,536 platform. Among these SNPs, 81 were autosomal ancestry-informative markers (AIMs), chosen as the most informative SNPs (in terms of allele frequencies) from a list of 200+ potential AIMs provided by Illumina, Inc. in 2006. These AIMs were genotyped for the express purpose of controlling population stratification for the remaining candidate SNPs. Among the 808 patients, 782 were self-reported Caucasians, 14 were Hispanic, 5 were African-American and the remaining 7 reported as belonging to ‘other’ ethnicity groups. The genotyped AIMs were carefully selected, with known high Fst values between the Caucasians and West African populations. At the time, the effect of LD on population stratification control was not explicitly considered, and several sets of SNPs exhibited appreciable correlation (2 SNPs on chromosome 1, 2 SNPs on chromosome 7, and 3 SNPs on chromosome 3, respectively).
Real Data Analysis 2 (Hapmap CEU and TSI Data)
In practice, substantial population stratification may be easily detected with any of the existing PCA methods. An important question is how those methods perform for subtle population stratification. Below, we address this issue by the phase 3 CEU and TSI Hapmap unrelated samples. The Plink formatted data was downloaded from the Hapmap website (http://ftp.hapmap.org/phase_3/?N=D). We removed all children whose parents are also Hapmap samples. Additionally, we excluded one CEU subject who has a very high estimated identical-by-descent (IBD) value (>0.8) with another CEU sample. The final dataset after the filtering contains a total of 185 samples (108 CEU and 77 TSI samples, respectively). The CEU samples are known to have the northern and western European ancestry, while the TSI samples are Toscans from Italy. Therefore, the two groups represent the northwestern and southern Europeans, respectively. We restrict our analysis to SNPs from one chromosome (which is chromosome 15 for this example) as performed in Miclaus et al. [2009] for further comparison between our shrinkage PCA and other three existing LD correction methods on their abilities in detecting subtle population stratifications.
Real Data Analysis 3 (GWAS Study of Schizophrenia)
A third real dataset is from a GWAS study of schizophrenia, obtained from the GAIN consortium. The filtered version of the corresponding General Research Use (GRU) dataset consisted of 2,601 individuals of European ancestry with 729,454 SNPs and was downloaded from the dbGaP database (version 2, accession number: phs000021.v2.p1). We filtered out highly related or duplicated samples, and markers with a high missingness rate (>5%) or a low minor allele frequency (<0.01). For simplicity, sex chromosome markers were excluded, and the final data set used for stratification analysis had 2,559 samples (1,152 cases, 1,368 controls, and 39 with missing case-control status) and 701,859 SNPs.
Results
Simulation 1 (Candidate SNP Analysis)
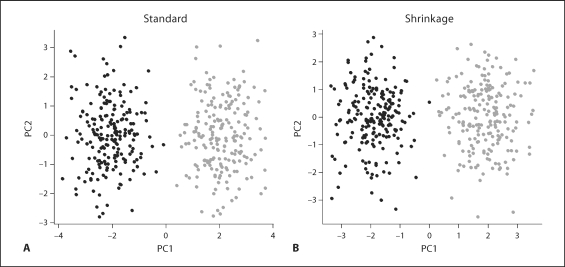
We applied both the standard PCA approach and our shrinkage PCA to the datasets. For the data with independent markers, scatter plots of the top two PCs are presented in figure 1. Clearly, when markers are in linkage equilibrium, both PCA methods give similar results.
Fig. 1.
Simulation 1 (independent markers). A stratified population with all SNPs independent within each subpopulation. 200 markers for 400 individuals were simulated as described in the text. The different subpopulations are indicated in gray and black. Both standard PCA (A) and shrinkage PCA (B) effectively separate individuals according to subpopulation.
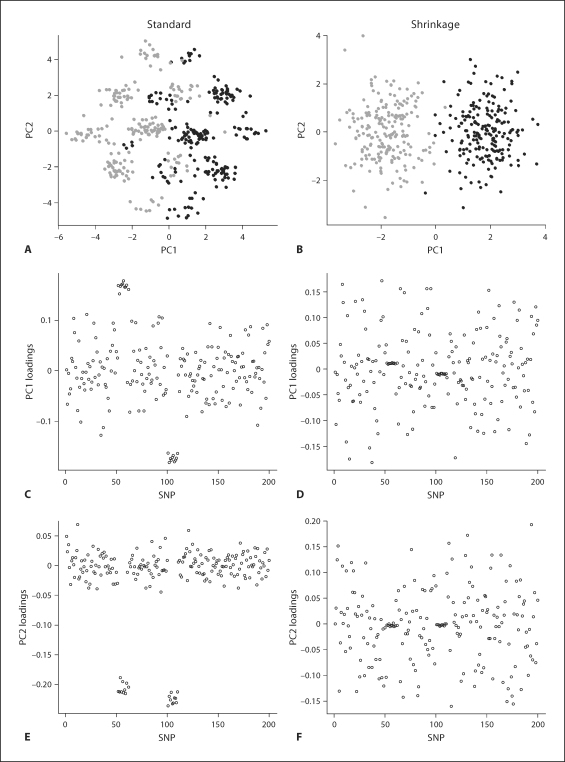
However, the results (fig. 2) of the data with some markers in LD tell a different story. Under standard PCA (fig. 2, left panels), the data points form groups that are mainly influenced by the SNPs in high LD. In this manner, subjects may be misclassified, or unnecessary extra stratification performed. Examination of the loadings for the first two PCs shows that they are dominated by the blocks of markers in high LD. The shrinkage approach (fig. 2, right panels), in contrast, retrieves the original subpopulations successfully. Examination of the loadings for the shrinkage PCA shows that the SNPs in the LD blocks have been downweighted considerably.
Fig. 2.
Simulation 1 (markers in LD). Standard PCA (left panels) vs. shrinkage PCA (right panels) in analysis of a stratified population with independent SNPs and two groups of highly dependent SNPs. The different subpopulations are indicated in gray and black. Distinct clumps appear in standard PCA (A), which might be falsely interpreted as subpopulations. A, B Scatter plots of PC1 versus PC2 for the two approaches. C–F Loadings of PC1 and PC2, respectively.
Simulation 2 (GWAS Data for Type I Error and Power Investigation)
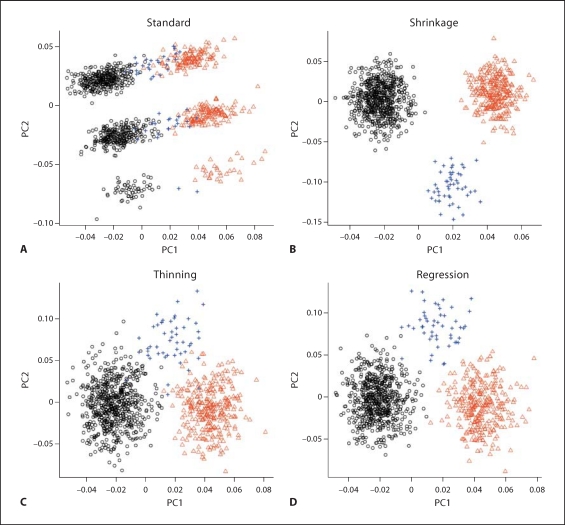
Scatter plots of the top two PCs from the four PCA methods are presented in figure 3. Clearly, standard PCA lacks the ability to correctly identify the three subpopulations, while the other three methods differentiate the three subpopulations with varying degrees of efficiency. Clearly, shrinkage PCA performs best.
Fig. 3.
Simulation 2 (GWAS data). Scatter plots of the top two PCs of the four PCA methods. The three different subpopulations are indicated by °, +, and ▹, respectively.
The false-positive frequencies for the null genetic model under population stratification are given in table 1. For the high Fst SNPs, standard PCA does not control false positives properly. For 100,000 markers, even if conservative Bonferroni family-wise error (FWER) thresholds are intended, the true FWER is much higher. For example, a p value threshold of 1 × 10⁻⁶ provides intended FWER values of no greater than 0.10. However, table 1 shows that the true type I error is nearly 1 for this setup. In contrast, our shrinkage method controls the rejection frequency for the null high Fst SNPs quite adequately (compared to the gold standard of known strata), as the top 20 SNPs with the highest Fst have a negligible effect on the type I error. Both thinning and regression methods perform substantially better than standard PCA. The regression PCA performs similarly to shrinkage PCA, and both perform slightly better than thinning PCA.
Table 1.
Rejection frequency in 10,000 simulations for 20 high Fst SNPs, under null genetic association
| p value threshold | Expected rejections, n | No adjustment | Known strata | Standard PCA | Shrinkage PCA | Thinning PCA | Regression PCA |
|---|---|---|---|---|---|---|---|
| 10−5 | 2 | 10,000 | 2 | 618 | 24 | 303 | 111 |
| 10−6 | 0.2 | 10,000 | 0 | 142 | 5 | 62 | 21 |
| 5 × 10⁻⁷ | 0.1 | 10,000 | 0 | 95 | 1 | 34 | 11 |
| 10−7 | 0.02 | 10,000 | 0 | 29 | 0 | 12 | 0 |
Column 1: The pointwise p value threshold for declaring statistical significance.
Column 2: The expected number of rejections out of 10,000 simulations in which at least one of 20 high Fst SNPs is rejected at a given p value threshold when population stratification is controlled.
Columns 3–8: The observed number of simulations out of 10,000 simulations in which at least one of the 20 high Fst SNPs was rejected at the given p value threshold.
Table 2 summarizes the power for the simulation in which causal SNPs are randomly distributed genome-wide. Clearly, all methods have similar power. When restricting power calculations to the causal SNPs located in the large LD block, we find from table 3 that standard PCA has substantially lower power than the other methods, which have comparable power to each other.
Table 2.
Power (casual SNP randomly distributed throughout whole genome)
| p value threshold | No adjustment | Known strata | Standard PCA | Shrinkage PCA | Thinning PCA | Regression PCA |
|---|---|---|---|---|---|---|
| 10−5 | 0.827 | 0.844 | 0.839 | 0.842 | 0.842 | 0.841 |
| 10−6 | 0.738 | 0.763 | 0.754 | 0.759 | 0.759 | 0.757 |
| 5 × 10⁻⁷ | 0.707 | 0.734 | 0.721 | 0.728 | 0.726 | 0.725 |
| 10−7 | 0.636 | 0.662 | 0.650 | 0.657 | 0.653 | 0.654 |
Columns 2–7: Each table entry represents the proportion of 10,000 simulations in which the causal SNP was rejected at the given p value threshold.
Table 3.
Power (casual SNP randomly distributed in the large LD block)
| p value threshold | No adjustment | Known strata | Standard PCA | Shrinkage PCA | Thinning PCA | Regression PCA |
|---|---|---|---|---|---|---|
| 10−5 | 0.973 | 0.970 | 0.296 | 0.967 | 0.969 | 0.967 |
| 10−6 | 0.923 | 0.917 | 0.155 | 0.909 | 0.914 | 0.909 |
| 5 × 10⁻⁷ | 0.902 | 0.894 | 0.125 | 0.884 | 0.892 | 0.885 |
| 10−7 | 0.835 | 0.827 | 0.074 | 0.814 | 0.824 | 0.816 |
Columns 2–7: Each table entry represents the proportion of 10,000 simulations in which the causal SNP was rejected at the given p value threshold.
Real Data Analysis 1 (Candidate Gene Modifier Study of Cystic Fibrosis)
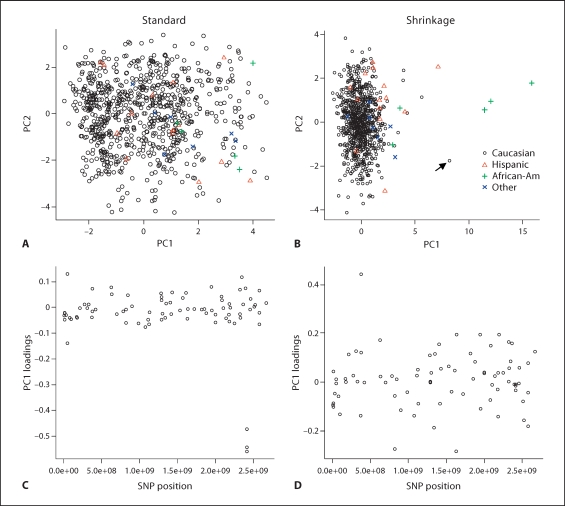
Standard PC analysis (fig. 4, left panels) shows that PCA analysis is highly influenced by the high LD SNPs, and similar results were observed for STRUCTURE analysis (see left panel of online supplementary fig. 1; for all online supplementary material, see www.karger.com/doi/10.1159/000288706). The right panels of figure 4 show the PC results from shrinkage PCA, which is much less sensitive to the LD among SNPs. The SNPs with high LD have loadings of large magnitude for PC1 in standard PCA analysis, while the shrinkage PC analysis eliminates this artificial effect. The results of our proposed method are clearly superior – the African-American and Hispanic subjects are more clearly distinguished from Caucasians on PC1 (fig. 4). Interestingly, one of the subjects labeled as Caucasian (indicated by an arrow in panel B), was flagged as an outlier by our shrinkage PC analysis, but not by standard PCA. A subsequent check of the recruitment database revealed a data entry error, and the subject was in fact a self-reported African-American. This example shows the utility of the shrinkage PCA approach in candidate gene studies, in which perhaps several hundred SNPs are genotyped. Despite the considerable attention generated by GWAS in recent years, we anticipate that smaller scale candidate gene studies will remain popular, due to cost considerations, or as follow-up studies to confirm results from genome scans. Similarly, after removing the SNPs in high LD (keeping one SNP from each LD block), STRUCTURE shows an improved separation of the ethnicity groups (right panel of online suppl. fig. 1).
Fig. 4.
Real data analysis 1. Scatter plots of the top two PCs of ancestry-informative markers from the CF candidate gene modifier study. The left panels are based on standard PCA, while the right panels are from shrinkage PCA.
Real Data Analysis 2 (Hapmap CEU and TSI Data)
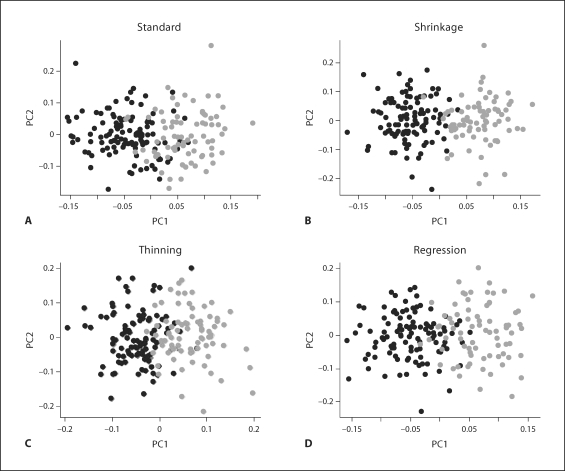
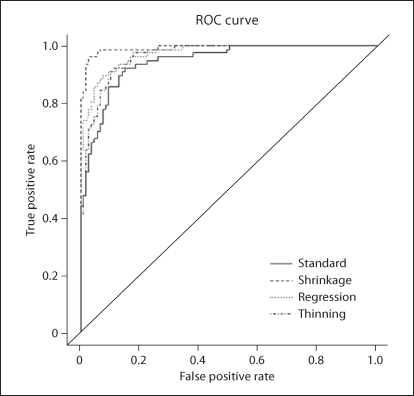
After removing SNPs with missing rates greater than 0.1 or minor allele frequency (MAF) less than 0.01, 38,711 SNPs remained. After performing the thinning procedure of Fellay et al. [2007], only 3,218 SNPs remained for thinning PCA. Figure 5 shows the scatter plots of the top 2 PCs of all four methods. Shrinkage PCA outperforms the other three methods in differentiating the two groups, also shown in figure 6, which compares the receiver operating characteristic (ROC) curves of the first PC in classifying the two subpopulations. The AUC (area under the curve) for the standard PCA is 0.945, which is significantly smaller than the AUC values from the shrinkage, regression and thinning PCA methods, which are 0.992, 0.964, and 0.973 (with corresponding p values of 0.001, 0.23, and 0.005 calculated by the method of DeLong et al. [1988]), respectively. In addition, we tested the Hardy-Weinberg disequilibrium SNP selection method in Miclaus et al. [2009], where SNPs were selected if their p value for Hardy-Weinberg equilibrium is <0.01. Only 254 SNPs were selected, which failed to detect the subtle population stratification in the data.
Fig. 5.
Real data analysis 2. Scatter plots of the top two PCs of 4 different methods with different colors for CEU (black) and TSI (grey).
Fig. 6.
Real data analysis 2. ROC curves of using the 1st PCs from the four PCA methods to classify the two subpopulations.
Real Data Analysis 3 (GWAS Study of Schizophrenia)
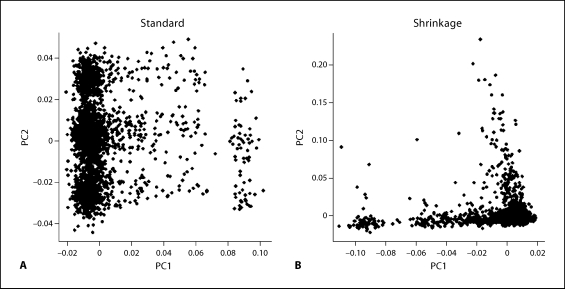
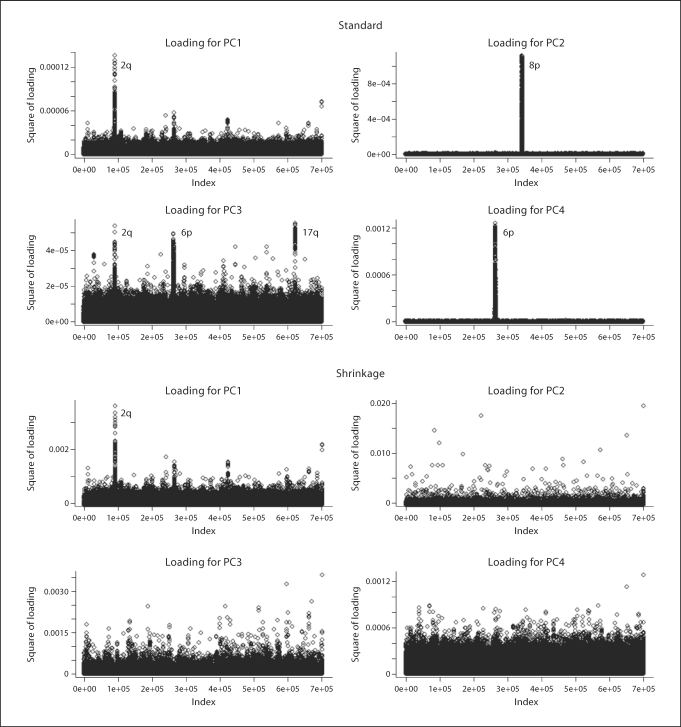
Scatter plots of the top 2 PCs from the standard and shrinkage PCA methods are presented in figure 7. Standard PCA analysis using the original data provides results with major groups that are almost certainly spurious. After the shrinkage PCA approach is applied, the result appears similar to previous analyses of populations with mixed European ancestry (e.g., fig. 2 in Price et al. [2006]). Plots of loading coefficients for these analyses are given in figure 8. The top 4 PCs from standard PCA are highly influenced by a few genomic regions. The lactase gene region on 2q21–2q22 is highly influential for PC1, which is consistent with a northern-southern cline in haplotype frequencies [Hollox et al., 2001]. Interestingly, our shrinkage PCA preserves this feature, and the correlation of PC1 from standard PCA and that of shrinkage PCA is 0.98. However, regions with high loadings on PC2 (8p23), PC3 (2q21, 6p21–22, 17q21) and PC4 (6p21–22) from standard PCA have all disappeared after the shrinkage PCA, suggesting that the high impact of those regions (except for lactase, captured in PC1) is simply due to high regional LD. The regions 8p23 and 17q21 coincide with two previously reported common inversions in European populations [Broman et al., 2003; Stefansson et al., 2005]. The chromosome 8 inversion region has been similarly reported by Fellay et al. [2007] in their GWAS study of HIV-1. These inversions have only been discovered in the last several years, and it is in many ways remarkable that they can be detected so readily using GWAS genotypes. Presumably, the LD is maintained by selection against crossovers in such regions, but not necessarily indicative of ancestry if well-mixed within the population. The 6p21 region coincides with the HLA region, for which extensive LD has been described [de Bakker et al., 2006]. We conclude that the shrinkage PCA approach provides appropriate downweighting, so as not to be unduly influenced by such regions, while retaining the influence of SNPs and regions indicative of true stratification.
Fig. 7.
Real data analysis 3. Scatter plots of the top two PCs. The left panel is based on standard PCA, while the right panel is from shrinkage PCA.
Fig. 8.
Real data analysis 3. Loadings of the top four PCs are displayed for standard PCA (top four panels) and the shrinkage PCA (bottom four panels). The x-axis refers to the serial SNP order on the genome rather than actual physical position.
Discussion
The PCA approach can capture both subtle and extensive variation due to stratification, and potentially to experimental features and batch effects in genotyping. With the availability of >105 genetic markers, self-reported ‘race’ may no longer be required as a proxy for ancestry. The principal components method is computationally efficient and uses the genotype matrix to infer continuous axes of genetic variation (eigenvectors), which then serve as covariates in the downstream analysis. This method is widely used in GWAS studies to robustly control for stratification effects, while preserving statistical power. However, PCA is highly influenced by sets of SNPs with high LD. Including SNPs with high LD for PCA may provide a distorted view of population substructures, and the distortion may be even greater for data with subtle population stratification. Our shrinkage PCA approach can effectively remove the artifactual effect of correlated SNPs and so successfully recover underlying population structure that is not apparent from standard PCA. Our proposed method is essentially a standard PCA approach, but performed on shrunken genotype data, and thus is straightforward to implement.
In addition to proposing shrinkage PCA, our paper also provides an overview of the effects of LD structure on PC analysis. For our simulated GWAS data where subtle population stratification exists, the shrinkage and regression methods have slightly lower false positive rates than the thinning method, and both performed very similarly. However, for data with substantial population substructures, all four PCA methods perform similarly (see simulation 3 in online suppl. materials and online suppl. fig. 2). Further, another advantage of the shrinkage PCA is that its calculation is straightforward, and is easier to implement than, for example, regression PCA.
Groups of SNPs in high LD may have an even greater effect on candidate gene studies than on GWAS studies. Although GWA studies are becoming a primary design for studying complex traits, candidate studies remain important, and are often employed for replication and validation. In this setting, a set of ancestry-informative markers is typically used, and our approach applies equally well in this setting.
Finally, we note that the shrinkage method intends to remove only the effects of local LD, as subtle long-range LD (for example, across chromosomes) reflects true population sub-structure, and our weighting scheme leaves the effects of long-range LD intact. However, other weighting schemes are possible. For the real data 2, we have varied the window size and correlation cut-off c. We have found that neither the window size nor the correlation threshold has large effects on the shrinkage PCA analysis, unless the window size is too small (online suppl. fig. 3 and 4). We suggest to pick a window size between 150 and 300 SNPs, depending on genotyping platforms and c equals 0.2, a number that the thinning PCA used in practice. Also, we point out that substructure inference is not simply a matter of an error control, as other types of procedures (such as genotype imputation at untyped SNPs) can depend on accurate ancestry inference.
Web Resources
The software, ShrinkagePCA, is available from our website http://www.bios.unc.edu/∼slee/sPCA.
Supplementary Material
Supplemental Materials
Acknowledgements
Supported in part by NIH grant (R01GM074175 and R01HL068890), the Carolina Environmental Bioinformatics Center (EPA RD-83272001), Cystic Fibrosis Foundation (Zou05P0) and a Gillings Innovation award in Statistical Genomics.
References
- Bacanu SA, Devlin B, Roeder K. The power of genomic control. Am J Hum Genet. 2000;66:1933–1944. doi: 10.1086/302929. [DOI] [PMC free article] [PubMed] [Google Scholar]
- Balding DJ, Nichols RA. A method for quantifying differentiation between populations at multi-allelic loci and its implications for investigating identity and paternity. Genetica. 1995;96:3–12. doi: 10.1007/BF01441146. [DOI] [PubMed] [Google Scholar]
- Bauchet M, McEvoy B, Pearson LN, Quillen EE, Sarkisian T, Hovhannesyan K, Deka R, Bradley DG, Shriver MD. Measuring European population stratification with microarray genotype data. Am J Hum Genet. 2007;80:948–956. doi: 10.1086/513477. [DOI] [PMC free article] [PubMed] [Google Scholar]
- Broman KW, Zuffardi O, Ledbetter DH, Weber JL: Common Long Human Inversion Polymorphism on Chromosome 8p. Lecture Notes-Monograph Series 2003, pp 237–245.
- Cardon LR, Bell JI. Association study designs for complex diseases. Nat Rev Genet. 2001;2:91–99. doi: 10.1038/35052543. [DOI] [PubMed] [Google Scholar]
- Cardon LR, Palmer LJ. Population stratification and spurious allelic association. Lancet. 2003;361:598–604. doi: 10.1016/S0140-6736(03)12520-2. [DOI] [PubMed] [Google Scholar]
- Chatfield C, Collins AJ. Introduction to Multivariate Analysis. London: Chapman and Hall; 1981. [Google Scholar]
- Cheng Q. New versions of principal component analysis for image enhancement and classification. IEEE. 2002;6:3372–3374. [Google Scholar]
- Daly AK, Day CP. Candidate gene case-control association studies: advantages and potential pitfalls. Br J Clin Pharmacol. 2001;52:489–499. doi: 10.1046/j.0306-5251.2001.01510.x. [DOI] [PMC free article] [PubMed] [Google Scholar]
- de Bakker PI, McVean G, Sabeti PC, Miretti MM, Green T, Marchini J, Ke X, Monsuur AJ, Whittaker P, Delgado M, et al. A high-resolution HLA and SNP haplotype map for disease association studies in the extended human MHC. Nat Genet. 2006;38:1166–1172. doi: 10.1038/ng1885. [DOI] [PMC free article] [PubMed] [Google Scholar]
- DeLong ER, Delong DM, Clarke-Pearson DL. Comparing the areas under two or more correlated receiver operating characteristic curves: a nonparametric approach. Biometrics. 1988;44:837–845. [PubMed] [Google Scholar]
- Devlin B, Roeder K. Genomic control for association studies. Biometrics. 1999;55:997–1004. doi: 10.1111/j.0006-341x.1999.00997.x. [DOI] [PubMed] [Google Scholar]
- Diamantaras KI, Kung SY. Principal Component Neural Networks: Theory and Applications. New York: John Wiley and Sons; 1996. [Google Scholar]
- Easton DF, Pooley KA, Dunning AM, Pharoah PD, Thompson D, Ballinger DG, Struewing JP, Morrison J, Field H, Luben R. Genome-wide association study identifies novel breast cancer susceptibility loci. Nature. 2007;447:1087–1095. doi: 10.1038/nature05887. [DOI] [PMC free article] [PubMed] [Google Scholar]
- Elston RC. Linkage and association. Genet Epidemiol. 1998;15:565–576. doi: 10.1002/(SICI)1098-2272(1998)15:6<565::AID-GEPI2>3.0.CO;2-J. [DOI] [PubMed] [Google Scholar]
- Falush D, Stephens M, Pritchard JK. Inference of population structure using multilocus genotype data linked loci and correlated allele frequencies. Genetics. 2003;164:1567–1587. doi: 10.1093/genetics/164.4.1567. [DOI] [PMC free article] [PubMed] [Google Scholar]
- Fellay J, Shianna KV, Ge D, Colombo S, Ledergerber B, Weale M, Zhang K, Gumbs C, Castagna A, Cossarizza A. A whole-genome association study of major determinants for host control of HIV-1. Science. 2007;317:944–947. doi: 10.1126/science.1143767. [DOI] [PMC free article] [PubMed] [Google Scholar]
- Freedman ML, Reich D, Penney KL, McDonald GJ, Mignault AA, Patterson N, Gabriel SB, Topol EJ, Smoller JW, Pato CN. Assessing the impact of population stratification on genetic association studies. Nat Genet. 2004;36:388–393. doi: 10.1038/ng1333. [DOI] [PubMed] [Google Scholar]
- Greenacre MJ. Theory and Applications of Correspondence Analysis. London: Academic Press; 1984. [Google Scholar]
- Hao K, Xu X, Laird N, Wang X. Power estimation of multiple SNP association test of case-control study and application. Genet Epidemiol. 2004;26:22–30. doi: 10.1002/gepi.10293. [DOI] [PubMed] [Google Scholar]
- Hollox EJ, Poulter M, Zvarik M, Ferak V, Krause A, Jenkins T, Saha N, Kozlov AI, Swallow DM. Lactase haplotype diversity in the Old World. Am J Hum Genet. 2001;68:160–172. doi: 10.1086/316924. [DOI] [PMC free article] [PubMed] [Google Scholar]
- Jolliffe IT. Principal Component Analysis. New York: Springer; 2002. [Google Scholar]
- Maniatis N, Collins A, Xu CF, McCarthy LC, Hewett DR, Tapper W, Ennis S, Ke X, Morton NE. The first linkage disequilibrium (LD) maps: delineation of hot and cold blocks by diplotype analysis. Proc Natl Acad Sci USA. 2002;99:2228–2233. doi: 10.1073/pnas.042680999. [DOI] [PMC free article] [PubMed] [Google Scholar]
- Miclaus K, Wolfinger R, Czika W. SNP selection and multidimensional scaling to quantify population structure. Genet Epidemiol. 2009;33:488–496. doi: 10.1002/gepi.20401. [DOI] [PubMed] [Google Scholar]
- Morrison DF. Multivariate Statistical Methods. Tokyo: McGraw-Hill; 1976. [Google Scholar]
- Patterson N, Price AL, Reich D. Population structure and eigenanalysis. PLoS Genet. 2006;2:e190. doi: 10.1371/journal.pgen.0020190. [DOI] [PMC free article] [PubMed] [Google Scholar]
- Price AL, Patterson NJ, Plenge RM, Weinblatt ME, Shadick NA, Reich D. Principal components analysis corrects for stratification in genome-wide association studies. Nat Genet. 2006;38:904–909. doi: 10.1038/ng1847. [DOI] [PubMed] [Google Scholar]
- Pritchard JK, Rosenberg NA. Use of unlinked genetic markers to detect population stratification in association studies. Am J Hum Genet. 1999;65:220–228. doi: 10.1086/302449. [DOI] [PMC free article] [PubMed] [Google Scholar]
- Pritchard JK, Stephens M, Donnelly P. Inference of population structure using multilocus genotype data. Genetics. 2000a;155:945–959. doi: 10.1093/genetics/155.2.945. [DOI] [PMC free article] [PubMed] [Google Scholar]
- Pritchard JK, Stephens M, Rosenberg NA, Donnelly P. Association mapping in structured populations. Am J Hum Genet. 2000b;67:170–181. doi: 10.1086/302959. [DOI] [PMC free article] [PubMed] [Google Scholar]
- Purcell S, Neale B, Todd-Brown K, Thomas L, Ferreira MAR, Bender D, Maller J, Sklar P, de Bakker PIW, Daly MJ. PLINK: a tool set for whole-genome association and population-based linkage analyses. Am J Hum Genet. 2007;81:559–575. doi: 10.1086/519795. [DOI] [PMC free article] [PubMed] [Google Scholar]
- Risch N, Merikangas K. The future of genetic studies of complex human diseases. Science. 1996;273:1516–1517. doi: 10.1126/science.273.5281.1516. [DOI] [PubMed] [Google Scholar]
- Satten GA, Flanders WD, Yang Q. Accounting for unmeasured population substructure in case-control studies of genetic association using a novel latent-class model. Am J Hum Genet. 2001;68:466–477. doi: 10.1086/318195. [DOI] [PMC free article] [PubMed] [Google Scholar]
- Saxena R, Voight BF, Lyssenko V, Burtt NP, de Bakker PI, Chen H, Roix JJ, Kathiresan S, Hirschhorn JN, Daly MJ. Genome-wide association analysis identifies loci for type 2 diabetes and triglyceride levels. Science. 2007;316:1331–1336. doi: 10.1126/science.1142358. [DOI] [PubMed] [Google Scholar]
- Schork NJ, Fallin D, Thiel B, Xu X, Broeckel U, Jacob HJ, Cohen D. The future of genetic case-control studies. Adv Genet. 2001;42:191–212. doi: 10.1016/s0065-2660(01)42023-2. [DOI] [PubMed] [Google Scholar]
- Schulze TG, McMahon FJ. Genetic Association mapping at the crossroads: which test and why? Overview and practical guidelines. Am J Med Genet. 2002;114:1–11. doi: 10.1002/ajmg.10042. [DOI] [PubMed] [Google Scholar]
- Scott LJ, Mohlke KL, Bonnycastle LL, Willer CJ, Li Y, Duren WL, Erdos MR, Stringham HM, Chines PS, Jackson AU. A genome-wide association study of type 2 diabetes in Finns detects multiple susceptibility variants. Science. 2007;316:1341–1345. doi: 10.1126/science.1142382. [DOI] [PMC free article] [PubMed] [Google Scholar]
- Service S, DeYoung J, Karayiorgou M, Roos JL, Pretorious H, Bedoya G, Ospina J, Ruiz-Linares A, Macedo A, Palha JA, et al. Magnitude and distribution of linkage disequilibrium in population isolates and implications for genome-wide association studies. Nat Genet. 2006;38:556–560. doi: 10.1038/ng1770. [DOI] [PubMed] [Google Scholar]
- Sladek R, Rocheleau G, Rung J, Dina C, Shen L, Serre D, Boutin P, Vincent D, Belisle A, Hadjadj S. A genome-wide association study identifies novel risk loci for type 2 diabetes. Nature. 2007;445:881–885. doi: 10.1038/nature05616. [DOI] [PubMed] [Google Scholar]
- Stefansson H, Helgason A, Thorleifsson G, Steinthorsdottir V, Masson G, Barnard J, Baker A, Jonasdottir A, Ingason A, Gudnadottir VG. A common inversion under selection in Europeans. Nat Genet. 2005;37:129–137. doi: 10.1038/ng1508. [DOI] [PubMed] [Google Scholar]
- Wall ME, Rechtsteiner A, Rocha LM. Singular value decomposition and principal component analysis. In: Berrar DP, Dubitzky W, Granzow M, editors. A Practical Approach to Microarray Data Analysis. Norwell, MA: Kluwer; 2003. pp. 91–109. [Google Scholar]
- Zeggini E, Weedon MN, Lindgren CM, Frayling TM, Elliott KS, Lango H, Timpson NJ, Perry JRB, Rayner NW, Freathy RM. Replication of genome-wide association signals in UK samples reveals risk loci for type 2 diabetes. Science. 2007;316:1336–1341. doi: 10.1126/science.1142364. [DOI] [PMC free article] [PubMed] [Google Scholar]
- Zhang S, Zhu X, Zhao H. On a semiparametric test to detect associations between quantitative traits and candidate genes using unrelated individuals. Genet Epidemiol. 2003;24:44–56. doi: 10.1002/gepi.10196. [DOI] [PubMed] [Google Scholar]
- Zhu X, Zhang SL, Zhao H, Cooper RS. Association mapping, using a mixture model for complex traits. Genet Epidemiol. 2002;23:181–196. doi: 10.1002/gepi.210. [DOI] [PubMed] [Google Scholar]
Associated Data
This section collects any data citations, data availability statements, or supplementary materials included in this article.
Supplementary Materials
Supplemental Materials


