ABSTRACT
The bacterial SeqA protein binds to hemi-methylated GATC sequences that arise in newly synthesized DNA upon passage of the replication machinery. In Escherichia coli K-12, the single replication origin oriC is a well-characterized target for SeqA, which binds to multiple hemi-methylated GATC sequences immediately after replication has initiated. This sequesters oriC, thereby preventing reinitiation of replication. However, the genome-wide DNA binding properties of SeqA are unknown, and hence, here, we describe a study of the binding of SeqA across the entire Escherichia coli K-12 chromosome, using chromatin immunoprecipitation in combination with DNA microarrays. Our data show that SeqA binding correlates with the frequency and spacing of GATC sequences across the entire genome. Less SeqA is found in highly transcribed regions, as well as in the ter macrodomain. Using synchronized cultures, we show that SeqA distribution differs with the cell cycle. SeqA remains bound to some targets after replication has ceased, and these targets locate to genes encoding factors involved in nucleotide metabolism, chromosome replication, and methyl transfer.
IMPORTANCE
DNA replication in bacteria is a highly regulated process. In many bacteria, a protein called SeqA plays a key role by binding to newly replicated DNA. Thus, at the origin of DNA replication, SeqA binding blocks premature reinitiation of replication rounds. Although most investigators have focused on the role of SeqA at replication origins, it has long been suspected that SeqA has a more pervasive role. In this study, we describe how we have been able to identify scores of targets, across the entire Escherichia coli chromosome, to which SeqA binds. Using synchronously growing cells, we show that the distribution of SeqA between these targets alters as replication of the chromosome progresses. This suggests that sequential changes in SeqA distribution orchestrate a program of gene expression that ensures coordinated DNA replication and cell division.
INTRODUCTION
In the bacterium Escherichia coli, chromosome replication initiates bidirectionally from a single locus, oriC, and terminates at the diametrically opposed ter region (1). Chromosome replication is triggered by the binding of the DnaA initiator protein to multiple sites at oriC, and this promotes unwinding of adjacent AT-rich DNA tracts (2–4). Once the DNA duplex has been opened, DnaC facilitates loading of the DnaB helicase and the replication apparatus can initiate chromosome replication (5). Chromosome replication has to be coordinated with the cell cycle to ensure that each replication origin fires only once and that progeny receive the correct number of chromosomes (6). New copies of oriC must be silenced to prevent secondary initiation events from occurring, and DNA methylation patterns are exploited to identify newly made oriC. Briefly, the oriC region is enriched with GATC motifs, which are targets for the Dam methylase that methylates the adenine in GATC sequences (7). At each target, both strands of the DNA double helix can be methylated, but because there is a lag between DNA synthesis and methylation, new copies of oriC are transiently hemi-methylated (i.e., methylated on only the template DNA strand). These transients are recognized by SeqA protein, which preferentially binds as a dimer to pairs of hemi-methylated GATC sites (8, 9). This binding sequesters oriC, thereby retarding full methylation and the binding of DnaA (10–12). This is believed to be a key regulatory mechanism in the control of bacterial chromosome replication.
There are 19,120 GATC motifs scattered throughout the E. coli K-12 chromosome, and these sites may also serve as binding targets for SeqA. Probably the best-known example is the dnaA gene and dnaAp2 promoter, which are located close to oriC and contain multiple GATC sites. When hemi-methylated, SeqA is able to bind to these sites and repress dnaA transcription 10-fold, presumably by occluding binding of RNA polymerase. Repression is transient and is relieved when the region becomes fully methylated by Dam, which competes with SeqA for binding at GATC motifs (13, 14). Thus, SeqA can regulate the initiation of replication by modulating DnaA levels as well as by sequestering oriC. Regulation by SeqA has also been shown at bacteriophage λ promoters and the Salmonella enterica std fimbrial operon, indicating that dnaA is not an isolated example of specific gene regulation by SeqA (15, 16).
The extent of the SeqA regulon in E. coli remains an open question. The DNA binding properties of SeqA have been meticulously studied at particular loci using in vitro DNA binding assays (8, 9, 17–20) and indirect in vivo methods (13, 14) but not on a genome-wide scale. Thus, Løbner-Olesen and colleagues (21) used transcriptomic approaches to investigate the E. coli SeqA regulon, but they found few connections between genes affected in a seqA mutant and the occurrence of GATC motifs, suggesting that many of the observed effects were indirect. Here, we have exploited chromatin immunoprecipitation (ChIP) to study the genome-wide distribution of SeqA protein. Recall that ChIP is a technique that permits the direct measurement in vivo of the binding of any factor to specific chromosome locations and that it can be applied easily to measure factor binding across whole chromosomes (22, 23). For E. coli, ChIP applications so far have focused mainly on RNA polymerase, transcription factors, and chromosome folding proteins (24), but proteins involved in DNA replication and its regulation have been studied in Bacillus subtilis (25, 26). In the present study, we have used ChIP in combination with microarrays (ChIP-chip) to compare SeqA binding patterns in unsynchronized, synchronized, and nonreplicating cultures of E. coli. We pinpoint the most stable SeqA binding loci and report that some of these coincide with genes encoding key proteins involved in cell division. We have also compared patterns of SeqA and RNA polymerase binding to show that there is an inverse correlation between transcription and SeqA binding.
RESULTS
Experimental design and generation of ChIP-chip data.
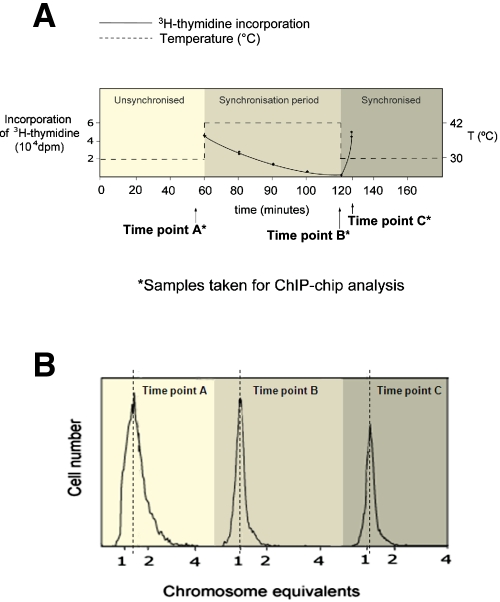
Our aim was to exploit ChIP-chip to determine the chromosome-wide DNA binding properties of SeqA. Since SeqA binding is dependent on the methylation state of the DNA, and thus the position of cells within the cell cycle, we have worked with E. coli K-12 strain CMT940, which carries the dnaC2 temperature-sensitive allele (27). CMT940 cells grow normally at 30°C. However, upon shift to 42°C, they are unable to initiate new rounds of DNA replication, but importantly, rounds of replication that are already under way are completed. Cells can be then be returned to 30°C to initiate synchronous chromosome replication. We selected 42°C for the nonpermissive temperature since it provides the most stringent inhibition of new replication rounds without affecting the kinetics of replication runout (28). Figure 1A shows a trace of [3H]thymidine incorporation in a CMT940 culture subjected to these temperature shifts. The data confirm that thymidine incorporation rates fall rapidly after cells are transferred from 30°C to 42°C and that, after 60 min, DNA replication has ceased. Thymidine incorporation increased 6-fold within minutes of cells being returned to 30°C. Complementary flow cytometry experiments presented in Fig. 1B show the number of chromosome equivalents for CMT940 cells at each temperature. Thus, CMT940 cells in unsynchronized cultures contain ~1.5 chromosomes; this decreases to 1.0 chromosome per cell after 60 min at 42°C, and when cultures are returned to 30°C, the number of chromosomes increases. Crucially, after 60 min at 42°C, >90% of the replication rounds had run to completion.
FIG 1 .
Time course of temperature shifts used to generate E. coli cultures for ChIP-chip analysis. The E. coli strain CMT940 used for these experiments carries the dnaC2 allele and can initiate chromosome replication normally at 30°C but not at 42°C. (A) Rates of DNA synthesis measured by thymidine incorporation (solid line) at different temperatures (dotted line) and the time points (A, B, and C) at which cultures were harvested for analysis. (B) Results from flow cytometry experiments with CMT940 cells at each time point.
For the ChIP-chip experiments described here, we harvested cells at three time points (Fig. 1A). Thus, for each ChIP-chip replicate, three cultures of CMT940 were grown at 30°C for 1 h and were thus unsynchronized. At this point (time point A), one of the cultures was harvested for ChIP-chip analysis and the two remaining cultures were shifted to 42°C. After an hour, at which point replication events were complete (29), a second culture was harvested for analysis (time point B). The remaining culture was then returned to 30°C, allowing synchronous initiation of chromosome replication, and harvested after 6 min (time point C). For each ChIP-chip experiment, DNA immunoprecipitated with anti-SeqA was labeled with Cy5 and DNA from a mock immunoprecipitation with no antibody was labeled with Cy3. Thus, DNA microarray probes with an elevated Cy5/Cy3 ratio correspond to regions of the genome bound by SeqA.
Overview of chromosome-wide SeqA binding.
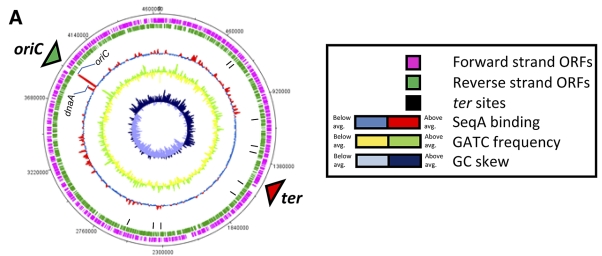
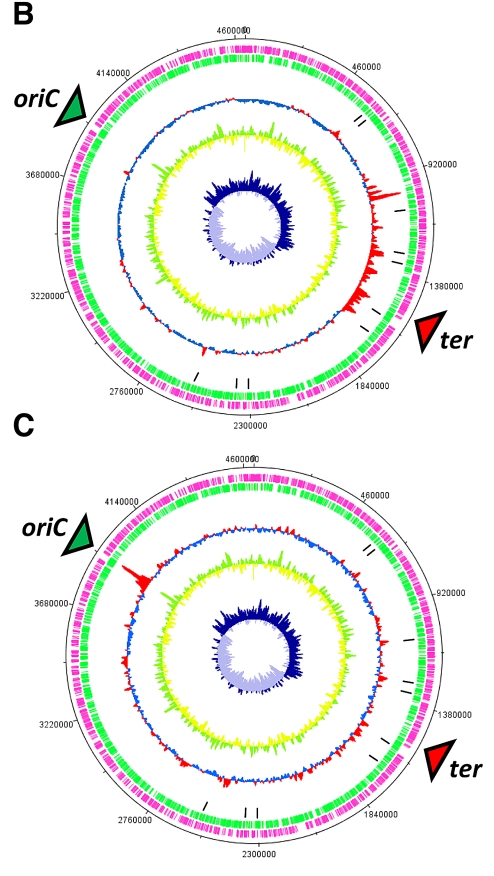
Figure 2 shows an overview of the SeqA binding profile at time points A, B, and C, derived from ChIP-chip data and plotted against the basic features of the E. coli chromosome and the local density of GATC motifs. In unsynchronized cells, the largest SeqA binding signal corresponds exactly with the location of oriC (Fig. 2A). A clear signal for SeqA binding is observed at the nearby dnaA locus, with binding being spread across the entire gene (see Fig. S1 in the supplemental material). Further SeqA binding signals, comparable in intensity to the signal seen at dnaA, are scattered throughout the genome, and these correspond well to locations where the frequency of GATC sites is higher (some examples are shown in Fig. S2 in the supplemental material). One hundred thirty-seven genes have a SeqA binding signal >4-fold above background levels (see Table S7 in the supplemental material). Of these genes, 24 are directly involved in nucleotide metabolism, DNA repair/replication, or methyl group transfer. Interestingly, SeqA binding across an ~1.3-Mbp segment that includes the ter region is greatly reduced. This region has a relatively low GATC content, and this most likely accounts for the reduced SeqA binding signal. Additionally, in unsynchronized cultures, weak SeqA binding signals in the ter region may be difficult to distinguish from experimental noise.
FIG 2 .
Genome-wide view of SeqA binding at different points in the cell cycle. The figure shows ChIP-chip data for SeqA binding plotted against features of the E. coli genome in the form of a genome atlas. (A) SeqA binding signal generated using unsynchronized cultures of E. coli (time point A); (B) SeqA binding after chromosome replication had been blocked for 1 h (time point B); (C) SeqA binding in cultures where chromosome replication had been reinitiated in synchronicity for a period of 6 min.
A very different SeqA binding profile is found in cells harvested at time point B, after chromosome replication has been blocked (Fig. 2B). Little or no SeqA binding is observed at the oriC and dnaA loci, while clear binding signals are apparent in the ter region. At time point C, in cells where chromosome replication has been reinitiated in synchronicity, SeqA binding predominantly occurs at oriC, with smaller binding signals scattered throughout the chromosome including the ter region (Fig. 2C). The full data set for each time point can be examined in the Artemis genome browser (see Materials and Methods and Tables S1 to S6 in the supplemental material).
DNA sequence requirements for SeqA binding in vivo.
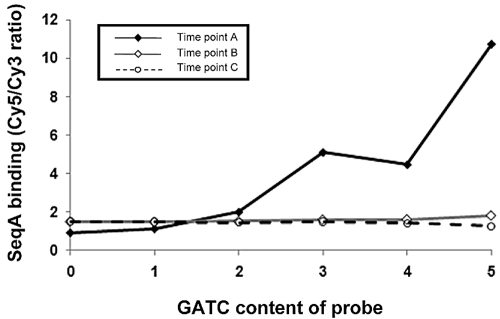
Figure 3 shows a comparison of the SeqA binding signal (i.e., the Cy5/Cy3 ratio) generated for each probe on the DNA microarray with the number of GATC sites present in each probe. Thus, probes with the same number of GATC motifs were grouped and the average SeqA binding signal was calculated for each group of probes for each time point. For the sample from the unsynchronized culture (time point A) there is a clear correlation between the SeqA binding signals and probe GATC content. In contrast, for the samples from synchronized cultures (time points B and C), there is little correlation. This is expected because it is only in the unsynchronized cells that each location with a GATC has an equal chance of being hemi-methylated. At time points B and C, many GATC motifs will be fully methylated and hence have a greatly reduced affinity for SeqA.
FIG 3 .
Relationship between SeqA binding and the occurrence of GATC motifs in vivo. The SeqA binding values are Cy5/Cy3 ratios generated from ChIP experiments analyzed using a DNA microarray. DNA microarray probes were grouped according to the number of GATC motifs present in the probe, and the average Cy5/Cy3 ratio was calculated for each group of probes. Data presented were generated from unsynchronized cultures of E. coli (time point A), cultures where chromosome replication had been blocked for 1 h (time point B), and cultures where chromosome replication had been reinitiated in synchronicity for a period of 6 min (time point C).
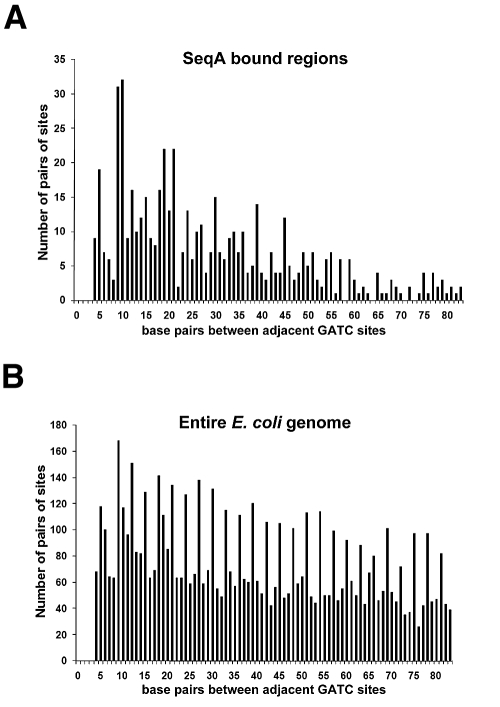
Previous work had shown that, in vitro, SeqA binds with a high affinity to pairs of GATC sites located on approximately the same face of the DNA helix (8). Thus, we investigated the relationship between adjacent GATC motif spacing and the SeqA binding signal at time point A. Regions of the genome with a SeqA binding signal greater than 1.5 were selected, and the spacing between adjacent GATC motifs was determined for these regions. As a control, we also determined the spacing between GATC motifs for the entire E. coli genome. The results of this analysis are plotted as a histogram in Fig. 4. For regions of the genome bound by SeqA, adjacent GATC sites are most frequently separated by close to 10 or 20 bp and there is a clear preference for adjacent GATC motifs to be located closer than ~50 bp apart (Fig. 4A). When the entire genome was analyzed in the same way, a different pattern of GATC motif spacing was observed (Fig. 4B). Note that when the entire genome is considered, periodicity can be observed in the frequency of GATC motif spacing. This is likely a consequence of codon usage.
FIG 4 .
Spacing of adjacent GATC motifs across the whole E. coli genome and in genomic regions bound by SeqA. The spacings between adjacent GATC motifs across regions of the E. coli genome bound by SeqA at time point A (A) and the entire E. coli genome (B) were compared. The data show that, in vivo, a gap of close to 10 or 20 nucleotides between GATC motifs is most favorable for SeqA binding.
Identification of stable SeqA binding targets.
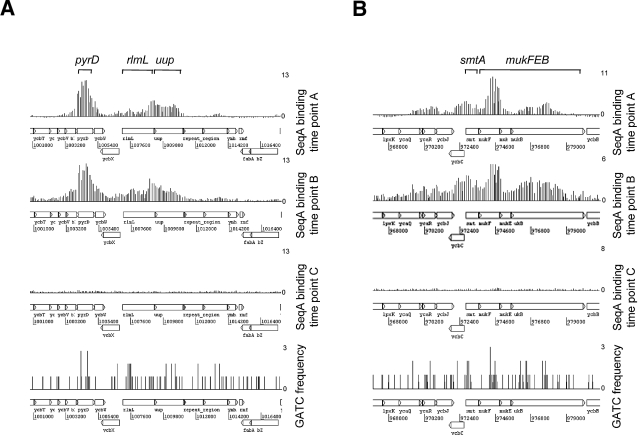
The ChIP-chip analysis of SeqA binding identifies many previously unknown SeqA binding loci. To identify the targets where SeqA association is the most stable, we selected regions that gave a strong SeqA binding signal in both unsynchronized cultures (time point A) and cultures where DNA replication had ceased (time point B). Our reasoning was that the experiment with the unsynchronized culture would identify a large number of targets, while the locations bound by SeqA after chromosome replication was blocked must retain SeqA for longer times. The 12 top targets are listed in Table 1. Strikingly, six of these have roles in DNA synthesis, chromosome replication, or methyl group transfer, and all are located at regions with an above-average density of GATC motifs. Figure 5A shows data for the pyrD-rlmL-uup locus, where the pyrD gene encodes an enzyme involved in pyrimidine nucleotide synthesis, rlmL encodes a methyltransferase, and uup encodes a protein involved in replication fork progression. All three genes are covered by SeqA, and binding coincides with a high density of GATC motifs. Figure 5B shows similar results with the mukFEB operon, which encodes proteins involved in chromosome segregation, and the adjacent smtA gene, which encodes a methyltransferase. Note that binding of SeqA close to both the pyrD and mukF regions is greatly reduced at time point C, shortly after the initiation of a replication round, presumably because SeqA is titrated off these targets due to increased hemi-methylation of DNA close to oriC.
TABLE 1 .
Stable SeqA targets outside the replication origin
| Gene | Function(s) | SeqA binding signala | Length (bp) | No. of GATC motifs | No. of GATC motifs/1,000 bpb |
|---|---|---|---|---|---|
| pyrD | Pyrimidine biosynthesis | 12.6 | 1,011 | 13 | 12.9 |
| dmsA | Dimethyl sulfoxide reductase, anaerobic respiration | 7.2 | 2,445 | 20 | 8.2 |
| rlmL | rRNA methylation, methyltransferase | 7.9 | 2,109 | 21 | 10.0 |
| uup | Possible role in replication fork progression | 6.0 | 1,908 | 14 | 7.3 |
| mukF | Chromosome segregation | 5.6 | 1,323 | 12 | 9.1 |
| smtA | S-Adenosylmethionine-dependent methyltransferase | 3.9 | 786 | 7 | 8.9 |
| ybiW | Predicted pyruvate formate lyase | 4.2 | 2,433 | 18 | 7.4 |
| etk | Protein-tyrosine kinase | 3.6 | 2,181 | 15 | 6.9 |
| potI | Putrescine transporter subunit | 3.2 | 846 | 10 | 11.8 |
| potH | Putrescine transporter subunit | 2.7 | 954 | 12 | 12.6 |
| ygiQ | Unknown, located in operon with ftsP | 2.7 | 2,220 | 21 | 9.5 |
| nfrA | Bacteriophage N4 receptor | 2.6 | 2,973 | 14 | 4.7 |
Taken from time point B.
Escherichia coli K-12 has an average of 4.1 GATC motifs per 1,000 bp.
FIG 5 .
Stable SeqA binding targets. The figure shows ChIP-chip data for SeqA binding close to the pyrD (A) and mukF (B) genes in vivo. Data presented were generated from unsynchronized cultures of E. coli (time point A), cultures where chromosome replication had been blocked for 1 h (time point B), and cultures where chromosome replication had been reinitiated in synchronicity for a period of 6 min (time point C). The ChIP-chip data sets have been aligned with a graph showing the locations of and frequencies at which GATC sites occur in the underlying DNA sequence.
Relationship between SeqA and RNA polymerase binding.
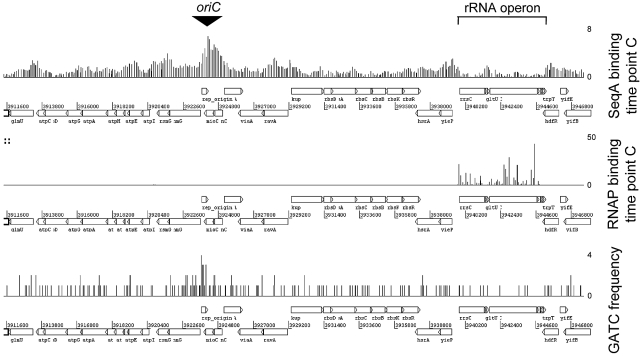
Our initial attempts to detect effects of SeqA on transcription, using reverse transcription (RT)-PCR and RNA extracted from CMT940 cells at different time points, was uninformative (data not shown). For example, we saw no changes in mukF and pyrD mRNA levels between time points B and C, despite SeqA binding at these loci and altering substantially (Fig. 5). We reasoned that a better strategy would be to compare genome-wide patterns of SeqA and RNA polymerase binding in unsynchronized cultures (time point A) using ChIP-chip (30). Thus, problems due to low levels of many transcripts, RNA instability, and cell cycle-dependent effects on gene transcription were avoided. Our data show that regions with a strong SeqA binding signal (for example, the locations listed in Table 1) tend to give a low RNA polymerase binding signal, while locations with a strong RNA polymerase binding signal (for example, the rRNA operons) are not bound by SeqA. Some examples of binding profiles are shown in Fig. S4 in the supplemental material, which shows an overall negative correlation between the binding of SeqA and RNA polymerase. The comparison was then repeated for a culture sampled shortly after synchronized initiation of replication (time point C). Figure 6 shows a detailed view of the SeqA and RNA polymerase binding data across the region encompassing both oriC and the rrnC rRNA operon at time point C. The inverse correlation between the binding of SeqA and RNA polymerase is most apparent in the rrnC operon, which has a lower GATC content than the surrounding DNA.
FIG 6 .
SeqA binding is reduced in rRNA operons. The figure shows ChIP-chip data for SeqA and RNA polymerase binding close to the replication origin and the rrnC rRNA operon. The data were generated from synchronized cultures of E. coli where chromosome replication had been reinitiated in synchronicity for a period of 6 min. The ChIP-chip data sets have been aligned with a graph showing the locations of and frequencies at which GATC sites occur in the underlying DNA sequence.
Evolution of the SeqA regulon.
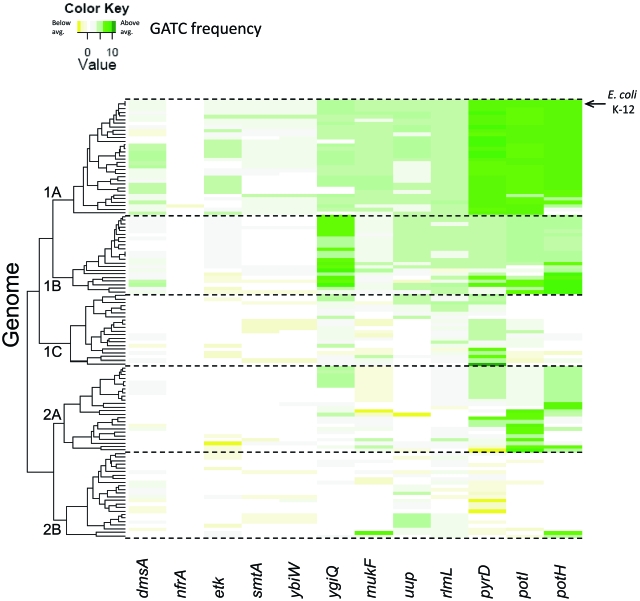
Since SeqA binding in E. coli K-12 is linked to the local density of GATC motifs, it might be possible to identify putative SeqA binding sites in other bacteria on the basis of their GATC content. Thus, we identified 123 bacterial genomes with a SeqA homologue. We then searched each genome for homologues of the genes listed in Table 1. If a candidate homologue was identified, the sequence was extracted and the density of GATC motifs was calculated for that gene. For each gene, we then compared the GATC density with the average GATC density across the whole of the corresponding genome, and the results are shown in Fig. 7 as a heat map (a higher-resolution version is shown in Fig. S3 in the supplemental material). The figure shows that most of the candidate genes have an increased density of GATC motifs in most genomes. Closer inspection shows that the genomes with SeqA homologues fall into five major evolutionary groups and that the frequency of occurrence of GATC sites in the selected genes is different for each group. The best conservation of above-average GATC frequency is seen in group 1A, which contains E. coli K-12 and closely related organisms. Conversely, there is hardly any retention of higher-than-average GATC frequency in group 2B, containing more distantly related genomes. Note that in many cases, this is because the target gene is simply not present (plotted as zero in Fig. 7). For example, Shewanella frigidimarina lacks mukF, ybiW, and nfrA, while Haemophilus somnus lacks pyrD, smtA, ybiW, etk, potI, potH, nfrA, and ygiQ.
FIG 7 .
Conservation of GATC motifs in SeqA binding targets. The figure shows a heat map describing the GATC motif contents of 123 bacterial genomes containing a seqA homologue (rows) and a group of genes bound by SeqA in our ChIP-chip analysis (columns). Genes that have a higher frequency of GATC motifs than the genome background are green, and genes with an average or less-than-average GATC motif content are yellow. The genomes are clustered into evolutionary groups. Group 1A contains Enterobacteriaceae, such as E. coli and Shigella, and group 1B also contains Enterobacteriaceae, including Salmonella and Klebsiella. Group 2B contains other gammaproteobacteria, such as Pasteurella multocida. A high-resolution version of this figure, complete with genome accession numbers, is available in the supplemental material (Fig. S3).
DISCUSSION
Previous attempts to define regions of the chromosome targeted by SeqA have relied on biochemistry, bioinformatics, and transcriptome analysis (31). Here, we have exploited ChIP-chip assays, which directly measure chromosome-wide DNA binding in vivo, to show that SeqA binding is dynamic and responsive to changes in the cell cycle and that it aligns with numerous genes that play key roles in cell replication. Our data are consistent with previous studies of cell cycle-dependent gene expression (13, 32–37). Thus, we observed SeqA binding to the dnaA, mukB, nrdA, seqA, mioC, and gidA genes, which are transiently repressed as they are replicated, but no binding at the minE, tus, ftsYEK, and rpoH loci, which are not subject to cell cycle-dependent regulation (37, 38). We note that many of the SeqA binding signals observed here stretch across thousands of base pairs, and possibly this is due to the formation of SeqA-DNA filaments that have been observed in vitro or looped domains (8, 39, 40).
SeqA binding correlates well with regions of high GATC content, and our analysis showed that a spacing of close to 10 or 20 nucleotides between GATC motifs was most favorable for SeqA binding. Additionally, a GATC motif spacing of ~50 nucleotides or more resulted in only low levels of SeqA binding (Fig. 4). This is consistent with previous in vitro studies (8). Interestingly, the highly expressed rRNA operons have evolved to have a particularly low occurrence of GATC sequences; the average number of these motifs per 1,000 bp for all seven rrn operons is 1.9, compared to a genome average of 4.1. Thus, we observed particularly low levels of SeqA binding to the rRNA genes (Fig. 6). We suggest that this represents a strategy used by the cell to minimize the effects of DNA replication on rRNA transcription.
The SeqA binding profile generated from unsynchronized cultures (Fig. 2A) gives an averaged view of SeqA binding at all points in the cell cycle. Interestingly, there is a lack of SeqA binding across an ~1.3-Mbp segment that corresponds to the chromosomal “Ter” macrodomain (41). This region is depleted in GATC motifs, consistent with the lack of SeqA binding signal observed. We speculate that the asymmetry in the chromosome-wide DNA binding profile of SeqA may be important for defining the orientation of nucleoids within the cell. Alternatively, the binding of SeqA could be reduced in this region to allow convergent replication forks to fuse correctly and complete genome duplication. Note that SeqA can be forced to bind in the ter region when new replication events are blocked (Fig. 2B). This is likely because high-affinity SeqA binding sites elsewhere in the genome have become fully methylated, so SeqA binds to the few remaining hemi-methylated GATC motifs that are in the ter region. Thus, upon the induction of a fresh round of replication, hemi-methylated GATC motifs arise elsewhere in the chromosome and SeqA rapidly dissociates from the ter region and rebinds oriC (Fig. 2C). Thus, progression of the replication fork triggers waves of SeqA relocation from hundreds of targets synchronized with the cell cycle.
SeqA binding is known to persist at some loci after passage of the replication fork (13). We identified several such sites, and one of these, the pyrD gene, overlaps a region previously found to remain associated with SeqA for some time after its replication (42). We suggest that SeqA either prevents full methylation of these targets by Dam or is able to bind these targets even when they are fully methylated. Note that we did not observe large changes in the expression of genes such as pyrD under conditions where SeqA was or was not bound (data not shown). We speculate that SeqA plays subtle roles at these targets that will be revealed only by focused studies. For example, SeqA-dependent effects may rely on the binding of other factors, such as transcriptional activators and repressors, that occurs only under specific conditions. Since we observed an overall negative correlation between the binding of RNA polymerase and SeqA, we suggest that SeqA binding most frequently hinders transcription (Fig. 6; see also Fig. S4 in the supplemental material).
The evolution of SeqA binding targets in E. coli and closely related pathogens is similar, but some more distantly related bacteria have a different set of SeqA targets (Fig. 7). This may be representative of different lifestyles, or SeqA may play a different role in those organisms. We note that recent studies of transcriptional regulatory proteins also conclude that, despite being conserved between organisms, regulators often control the transcription of different sets of genes (43, 44). In summary, SeqA binds to hundreds of targets distal to the replication origin, and by studying each of these targets in detail, previously undefined roles for SeqA in cell cycle regulation will be uncovered.
MATERIALS AND METHODS
E. coli strains and growth.
Strain CMT940 of E. coli K-12 was used for all experiments. CMT940 is a thermosensitive derivative of CM735 (45) into which the dnaC2 allele (27) was introduced by P1 transduction from strain PC2 (28). For all experiments, 50-ml cultures of E. coli CMT940 were grown in LB medium in a shaking water bath set at either 30°C (to permit chromosome replication) or 42°C (to block chromosome replication).
Thymidine incorporation assays and flow cytometry.
[3H]thymidine incorporation was used to track rates of DNA synthesis in cultures. Pulse labeling of cells with [3H]thymidine and subsequent measurement of trichloroacetic acid (TCA)-insoluble radioactivity in culture samples were done as described by Onogi et al. (46). DNA content per cell was measured by flow cytometry using a Bryte HS (Bio-Rad) cytometer.
ChIP and DNA microarray analysis.
ChIP assays were used to measure chromosome-wide DNA binding profiles of SeqA or RNA polymerase in synchronized and unsynchronized cultures of E. coli CMT940 using the protocols of Grainger and Busby (23). Assays were done in duplicate, and values presented here are averages of the results of those experiments. Briefly, cultures of E. coli CMT940 were treated with 1% formaldehyde and broken open by sonication, which also fragments cross-linked nucleoprotein. Cross-linked SeqA-DNA or RNA polymerase-DNA complexes were immunoprecipitated from cleared lysates by using rabbit polyclonal anti-SeqA antisera (kindly given by Felipe Molina and Kirsten Skarstad) or anti-RNA polymerase sera (Neoclone, Madison, WI). Parallel samples were isolated in mock precipitations with no antibody. Cross-links were then reversed, and after purification, DNA samples isolated with and without antibody were labeled with Cy5 and Cy3, respectively. To identify segments of DNA specifically associated with SeqA, the two labeled samples were combined and hybridized to a 43,450-feature DNA microarray (Oxford Gene Technology, Oxford, United Kingdom). For each probe, the Cy5/Cy3 ratio was measured, and this was plotted against the corresponding position on the E. coli chromosome, creating a profile of SeqA binding. Data presented here are the averages of results from replicate experiments and have been normalized so that the average Cy5/Cy3 ratio is 1. ChIP-chip data are presented using DNAPlotter (47) and the Artemis genome browser (48). The full data sets can be accessed in the supplementary tables, where they are in a format that can be viewed using DNAPlotter/Artemis, both of which are freely available at http://www.sanger.ac.uk/Software. Table S1 in the supplemental material is an annotation of the E. coli genome, and Tables S2 to S4 are averaged data sets from replicate SeqA ChIP-chip experiments. Users should first launch either DNAPlotter or Artemis. Table S1 in the supplemental material should then be opened before data in Table S2, S3, or S4 are added as a graph. Raw array data are in Table S5 in the supplemental material.
DNA sequence analysis.
To calculate the frequency of GATC motifs in E. coli, the genome sequence was divided into 60-bp windows. The number of GATC sequences in each window was plotted against the appropriate position on the genome and transferred to an Artemis-compatible file that is shown in Table S6 in the supplemental material.
To calculate the frequencies at which GATC motifs occur in potential SeqA binding targets in other organisms, we first identified all publically available complete bacterial genomes or whole-genome shotgun (WGS) sequences that contained a homologue of SeqA using BLASTp with an E value of <10−7. For each of the 221 identified genomes, the average GATC frequency per 1,000 bp was calculated as the total number of GATC motifs divided by genome size (kilobase pairs). Homologues of the SeqA targets pyrD, dmsA, rlmL, uup, murK, smtA, ybiW, etk, potI, potH, ygiQ, and nfrA were identified in each genome using BLASTp, with an E value of <10−5. If multiple genes were detected in each genome, only the highest BLAST hit was taken. If a homologous gene was detected, the number of GATC motifs per 1,000 bp was calculated for that gene. Homologues of all 12 potential SeqA binding loci were not found in every genome, specifically in incomplete WGS sequences; therefore, 98 WGS sequences under 500 kbp in length were excluded from further analysis. The difference between the average GATC frequency of each genome and the GATC frequency of specific genes was calculated and plotted in a heat map using the statistical package R (49). If a potential SeqA target gene was absent from a genome, then differences in GATC frequency could not be determined and therefore were plotted as zero.
Supplemental material
ACKNOWLEDGMENTS
This work was funded by a Wellcome Trust program grant to S.J.W.B. and a Wellcome Trust Research Career Development Fellowship awarded to D.C.G. M.A.S.-R. is a Marie Curie Early Stage Researcher on the DNAREC program.
We thank Peter McGlynn and Josep Casadesus for critically reading the manuscript and Alan Grossman and Alfonso Jiménez-Sánchez for encouragement and helpful discussions. We are grateful to Felipe Molina and Kirsten Skarstad for the gift of anti-SeqA antibodies, Elena Guzmán for her help with flow cytometry, and María Rosario Sepulveda for advice and support.
Footnotes
Citation Sánchez-Romero, M. A., S. J. W. Busby, N. P. Dyer, S. Ott, A. D. Millard, and D. C. Grainger. 2010. Dynamic distribution of SeqA protein across the chromosome of Escherichia coli K-12. mBio 1(1):e00012-10. doi:10.1128/mBio.00012-10.
REFERENCES
- 1. Higgins N. P. 2007. Mutational bias suggests that replication termination occurs near the dif site, not at Ter sites: what’s the dif? Mol. Microbiol. 64:1–4 [DOI] [PubMed] [Google Scholar]
- 2. Bramhill D., Kornberg A. 1998. A model for initiation at origins of DNA replication. Cell 54:915–918 [DOI] [PubMed] [Google Scholar]
- 3. Speck C., Messer W. 2000. Mechanism of origin unwinding: sequential binding of DnaA to double- and single-stranded DNA. EMBO J. 20:1469–1476 [DOI] [PMC free article] [PubMed] [Google Scholar]
- 4. Messer W. 2002. The bacterial replication initiator DnaA. DnaA and oriC, the bacterial mode to initiate DNA replication. FEMS Microbiol. Rev. 26:355–374 [DOI] [PubMed] [Google Scholar]
- 5. Kornberg A., Baker T. A. 1992. DNA replication. W. H. Freeman, New York, NY [Google Scholar]
- 6. Boye E., Løbner-Olesen A., Skarstad K. 2000. Limiting DNA replication to once and only once. EMBO Rep. 1:479–483 [DOI] [PMC free article] [PubMed] [Google Scholar]
- 7. Zyskind J. W., Smith D. W. 1986. The bacterial origin of replication, oriC. Cell 46:489–490 [DOI] [PubMed] [Google Scholar]
- 8. Brendler T., Sawitzke J., Sergueev K., Austin S. 2000. A case for sliding SeqA tracts at anchored replication forks during Escherichia coli chromosome replication and segregation. EMBO J. 19:6249–6258 [DOI] [PMC free article] [PubMed] [Google Scholar]
- 9. Han J. S., Kang S., Kim S. H., Ko M. J., Hwang D. S. 2004. Binding of SeqA protein to hemi-methylated GATC sequences enhances their interaction and aggregation properties. J. Biol. Chem. 279:30236–30243 [DOI] [PubMed] [Google Scholar]
- 10. Ogden G. B., Pratt M. J., Schaechter M. 1988. The replicative origin of the E. coli chromosome binds to cell membranes only when hemimethylated. Cell 54:127–135 [DOI] [PubMed] [Google Scholar]
- 11. Taghbalout A., Landoulsi A., Kern R., Yamazoe M., Hiraga S., Holland B., Kohiyama M., Malki A. 2000. Competition between the replication initiator DnaA and the sequestration factor SeqA for binding to the hemimethylated chromosomal origin of E. coli in vitro. Genes Cells 5:873–884 [DOI] [PubMed] [Google Scholar]
- 12. Nievera C., Torgue J. J., Grimwade J. E., Leonard A. C. 2006. SeqA blocking of DnaA-oriC interactions ensures staged assembly of the E. coli pre-RC. Mol. Cell 24:581–592 [DOI] [PMC free article] [PubMed] [Google Scholar]
- 13. Campbell J. L., Kleckner N. 1990. E. coli oriC and the dnaA gene promoter are sequestered from dam methyltransferase following the passage of the chromosomal replication fork. Cell 62:967–979 [DOI] [PubMed] [Google Scholar]
- 14. Bogan J. A., Helmstetter C. E. 1997. DNA sequestration and transcription in the oriC region of Escherichia coli. Mol. Microbiol. 26:889–896 [DOI] [PubMed] [Google Scholar]
- 15. Jakomin M., Chessa D., Bäumler A. J., Casadesús J. 2008. Regulation of the Salmonella enterica std fimbrial operon by DNA adenine methylation, SeqA, and HdfR. J. Bacteriol. 190:7406–7413 [DOI] [PMC free article] [PubMed] [Google Scholar]
- 16. Słomińska M., Konopa G., Ostrowska J., Kedzierska B., Wegrzyn G., Wegrzyn A. 2003. SeqA-mediated stimulation of a promoter activity by facilitating functions of a transcription activator. Mol. Microbiol. 47:1669–1679 [DOI] [PubMed] [Google Scholar]
- 17. Slater S., Wold S., Lu M., Boye E., Skarstad K., Kleckner N. 1995. E. coli SeqA protein binds oriC in two different methyl-modulated reactions appropriate to its roles in DNA replication initiation and origin sequestration. Cell 82:927–936 [DOI] [PubMed] [Google Scholar]
- 18. Brendler T., Abeles A., Austin S. 1995. A protein that binds to the P1 origin core and the oriC 13mer region in a methylation-specific fashion is the product of the host seqA gene. EMBO J. 14:4083–4089 [DOI] [PMC free article] [PubMed] [Google Scholar]
- 19. Brendler T., Austin S. 1999. Binding of SeqA protein to DNA requires interaction between two or more complexes bound to separate hemimethylated GATC sequences. EMBO J. 18:2304–2310 [DOI] [PMC free article] [PubMed] [Google Scholar]
- 20. Kang S., Lee H., Han J. S., Hwang D. S. 1999. Interaction of SeqA and Dam methylase on the hemimethylated origin of Escherichia coli chromosomal DNA replication. J. Biol. Chem. 274:11463–11468 [DOI] [PubMed] [Google Scholar]
- 21. Løbner-Olesen A., Marinus M. G., Hansen F. G. 2003. Role of SeqA and Dam in Escherichia coli gene expression: a global/microarray analysis. Proc. Natl. Acad. Sci. U. S. A. 100:4672–4677 [DOI] [PMC free article] [PubMed] [Google Scholar]
- 22. Cho B. K., Knight E. M., Palsson B. Ø. 2008. Genomewide identification of protein binding locations using chromatin immunoprecipitation coupled with microarray. Methods Mol. Biol. 439:131–145 [DOI] [PubMed] [Google Scholar]
- 23. Grainger D. C., Busby S. J. 2008. Global regulators of transcription in Escherichia coli: mechanisms of action and methods for study. Adv. Appl. Microbiol. 65:93–113 [DOI] [PubMed] [Google Scholar]
- 24. Wade J. T., Struhl K., Busby S. J., Grainger D. C. 2007. Genomic analysis of protein-DNA interactions in bacteria: insights into transcription and chromosome organization. Mol. Microbiol. 65:21–26 [DOI] [PubMed] [Google Scholar]
- 25. Ishikawa S., Ogura Y., Yoshimura M., Okumura H., Cho E., Kawai Y., Kurokawa K., Oshima T., Ogasawara N. 2007. Distribution of stable DnaA-binding sites on the Bacillus subtilis genome detected using a modified Chip-chip method. DNA Res. 14:155–168 [DOI] [PMC free article] [PubMed] [Google Scholar]
- 26. Wu L. J., Ishikawa S., Kawai Y., Oshima T., Ogasawara N., Errington J. 2009. Noc protein binds to specific DNA sequences to coordinate cell division with chromosome segregation. EMBO J. 28:1940–1952 [DOI] [PMC free article] [PubMed] [Google Scholar]
- 27. Carl P. L. 1970. Escherichia coli mutants with temperature sensitive synthesis of DNA. Mol. Gen. Genet. 196:387–396 [DOI] [PubMed] [Google Scholar]
- 28. Withers H. L., Bernander R. 1998. Characterization of dnaC2 and dnaC28 mutants by flow cytometry. J. Bacteriol. 180:1624–1631 [DOI] [PMC free article] [PubMed] [Google Scholar]
- 29. Bach T., Krekling M. A., Skarstad K. 2003. Excess SeqA prolongs sequestration of oriC and delays nucleoid segregation and cell division. EMBO J. 22:315–323 [DOI] [PMC free article] [PubMed] [Google Scholar]
- 30. Grainger D. C., Hurd D., Goldberg M. D., Busby S. J. 2006. Association of nucleoid proteins with coding and non-coding segments of the Escherichia coli genome. Nucleic Acids Res. 34:4642–4652 [DOI] [PMC free article] [PubMed] [Google Scholar]
- 31. Waldminghaus T., Skarstad K. 2009. The Escherichia coli SeqA protein. Plasmid 61:141–150 [DOI] [PubMed] [Google Scholar]
- 32. Sun L., Fuchs J. A. 1992. Escherichia coli ribonucleotide reductase expression is cell cycle regulated. Mol. Biol. Cell 3:1095–1105 [DOI] [PMC free article] [PubMed] [Google Scholar]
- 33. Theisen P. W., Grimwade J. E., Leonard A. C., Bogan J. A., Helmstetter C. E. 1993. Correlation of gene transcription with the time of initiation of chromosome replication in Escherichia coli. Mol. Microbiol. 10:575–584 [DOI] [PubMed] [Google Scholar]
- 34. Sun L., Jacobson B. A., Dien B. S., Srienc F., Fuchs J. A. 1994. Cell cycle regulation of the Escherichia coli nrd operon: requirement for a cis-acting upstream AT-rich sequence. J. Bacteriol. 176:2415–2426 [DOI] [PMC free article] [PubMed] [Google Scholar]
- 35. Ogawa T., Okazaki T. 1994. Cell cycle-dependent transcription from the gid and mioC promoters of Escherichia coli. J. Bacteriol. 176:1609–1615 [DOI] [PMC free article] [PubMed] [Google Scholar]
- 36. Zhou P., Helmstetter C. E. 1994. Relationship between ftsZ gene expression and chromosome replication in Escherichia coli. J. Bacteriol. 176:6100–6106 [DOI] [PMC free article] [PubMed] [Google Scholar]
- 37. Zhou P., Bogan J. A., Welch K., Pickett S. R., Wang H. J., Zaritsky A., Helmstetter C. E. 1997. Gene transcription and chromosome replication in Escherichia coli. J. Bacteriol. 179:163–169 [DOI] [PMC free article] [PubMed] [Google Scholar]
- 38. Gómez-Eichelmann M. C., Helmstetter C. E. 1999. Transcription level of operon ftsYEX and activity of promoter P1 of rpoH during the cell cycle in Escherichia coli. J. Basic Microbiol. 39:237–242 [PubMed] [Google Scholar]
- 39. Guarné A., Brendler T., Zhao Q., Ghirlando R., Austin S., Yang W. 2005. Crystal structure of a SeqA-N filament: implications for DNA replication and chromosome organization. EMBO J. 24:1502–1511 [DOI] [PMC free article] [PubMed] [Google Scholar]
- 40. Chung Y. S., Brendler T., Austin S., Guarné A. 2009. Structural insights into the cooperative binding of SeqA to a tandem GATC repeat. Nucleic Acids Res. 37:3143–3152 [DOI] [PMC free article] [PubMed] [Google Scholar]
- 41. Mercier R., Petit M. A., Schbath S., Robin S., El Karoui M., Boccard F., Espéli O. 2008. The MatP/matS site-specific system organizes the terminus region of the E. coli chromosome into a macrodomain. Cell 135:475–485 [DOI] [PubMed] [Google Scholar]
- 42. Yamazoe M., Adachi S., Kanaya S., Ohsumi K., Hiraga S. 2005. Sequential binding of SeqA protein to nascent DNA segments at replication forks in synchronized cultures of Escherichia coli. Mol. Microbiol. 55:289–298 [DOI] [PubMed] [Google Scholar]
- 43. Perez J. C., Groisman E. A. 2009. Evolution of transcriptional regulatory circuits in bacteria. Cell 138:233–244 [DOI] [PMC free article] [PubMed] [Google Scholar]
- 44. Perez J. C., Shin D., Zwir I., Latifi T., Hadley T. J., Groisman E. A. 2009. Evolution of a bacterial regulon controlling virulence and Mg2+ homeostasis. PLoS Genet. 5:e1000428 [DOI] [PMC free article] [PubMed] [Google Scholar]
- 45. Hansen E. B., Atlung T., Hansen F. G., Skovgaard O., von Meyenburg K. 1984. Fine structure genetic map and complementation analysis of mutations in the dnaA gene of Escherichia coli. Mol. Gen. Genet. 196:387–396 [DOI] [PubMed] [Google Scholar]
- 46. Onogi T., Ohsumi K., Katayama T., Hitaga S. 2002. Replication-dependent recruitment of the β-subunit of DNA polymerase III from cytosolic spaces to replication forks in Escherichia coli. J. Bacteriol. 184:867–870 [DOI] [PMC free article] [PubMed] [Google Scholar]
- 47. Carver T., Thomson N., Bleasby A., Berriman M., Parkhill J. 2009. DNAPlotter: circular and linear interactive genome visualization. Bioinformatics 25:119–120 [DOI] [PMC free article] [PubMed] [Google Scholar]
- 48. Rutherford K., Parkhill J., Crook J., Horsnell T., Rice P., Rajandream M. A., Barrell B. 2000. Artemis: sequence visualization and annotation. Bioinformatics 16:944–945 [DOI] [PubMed] [Google Scholar]
- 49. R Development Core Team 2008. R: a language and environment for statistical computing. R Foundation for Statistical Computing, Vienna, Austria: http://www.R-project.org [Google Scholar]
Associated Data
This section collects any data citations, data availability statements, or supplementary materials included in this article.


