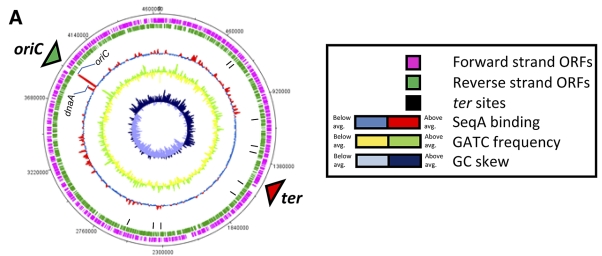
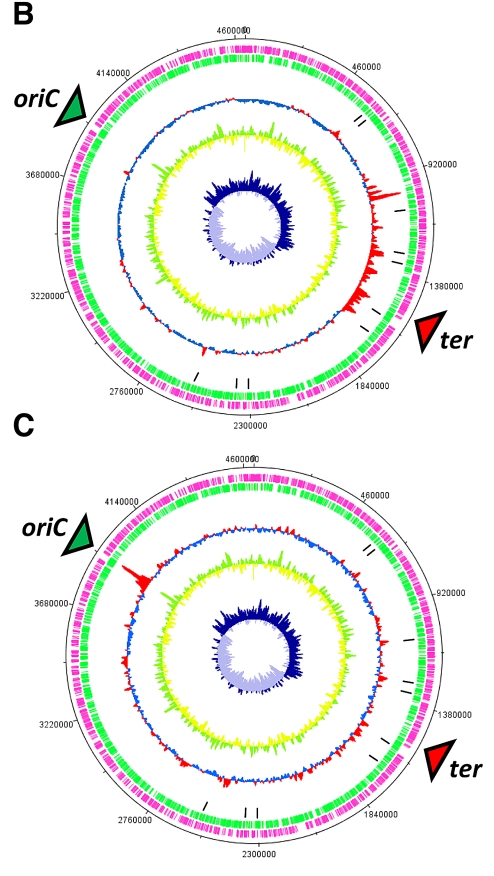
FIG 2 .
Genome-wide view of SeqA binding at different points in the cell cycle. The figure shows ChIP-chip data for SeqA binding plotted against features of the E. coli genome in the form of a genome atlas. (A) SeqA binding signal generated using unsynchronized cultures of E. coli (time point A); (B) SeqA binding after chromosome replication had been blocked for 1 h (time point B); (C) SeqA binding in cultures where chromosome replication had been reinitiated in synchronicity for a period of 6 min.


