Abstract
Apatite and brushite kidney stones share calcium and phosphate as their main inorganic components. We tested the hypothesis that these stone types differ in the organic matrix present in the stones. Intact stones were intensively analyzed by micro-computed tomography (micro CT) for both morphology (including the volume of voids, i.e., regions without mineral) and mineral type. In order to extract all proteins present in kidney stones in soluble form we developed a three-step extraction procedure using the ground stone powder. Apatite stones had significantly higher levels of total protein content and void volume compared to brushite stones. The void volume was highly correlated with the total protein contents in all stones (r2=0.61, P<0.0001), and brushite stones contained significantly fewer void regions and proteins than did apatite stones (3.2±4.5% voids for brushite vs. 10.8±11.2% for apatite, P<0.005; 4.1±1.6% protein for brushite vs. 6.0±2.4% for apatite, P<0.03). Morphological observations other than void volume did not correlate with protein content of stones, and neither did the presence or absence of minor mineral components. Our results show that protein content of brushite and apatite stones is higher than was previously thought, and also suggest that micro CT-visible void regions are related to the presence of protein.
Keywords: Urolithiasis, micro CT, void volume, organic matrix
Introduction
Nephrolithiasis is one of the most common chronic urology diseases, and the prevalence is increasing over time, especially in industrialized countries [1]. Among all types of kidney stones the frequency of calcium stone is 70-80%, struvite stone 5-10%, uric acid stone 5-10%, and cystine stone 1% [2]. Calcium oxalate is the primary component of 70-80% of calcium stones in the US [3-5] with calcium phosphate being the predominant component in the rest of calcium stones. Calcium phosphate kidney stones include apatite (carbapatite or hydroxyapatite), brushite and octacalcium phosphate with the occurrence rate of apatite, 4-10%; brushite, 2-6%; and rarely octacalcium phosphate [2]. A recent study has reported that the occurrence of calcium phosphate containing stones is increasing over time [6]. Often calcium oxalate stones are mixed with various percentages of apatite or brushite, and some studies have shown that apatite is the principal component of Randall's plaque and the primary nidus at which calcium oxalate stones grow [7;8]. Pure apatite and brushite stones are composed of similar chemical components, calcium and phosphate, but the crystalline structure is different. The ratio of calcium and phosphate in brushite [CaH(PO4)·2H2O] is 1.0, and in apatite [Ca10(PO4)6(OH)2] is 1.7.
Clinically, it is harder to treat brushite stone patients as compared to apatite stone formers. Parks et al reported that patients with brushite-containing stones had received more extracorporeal shock wave lithotripsy (ESWL) treatments compared to calcium oxalate stone formers [9]. Apatite stones are easily fragmented by an ESWL procedure, but brushite stones are more difficult to comminute [10] and brushite stone formers often require surgery to remove their stones, especially since the stone burden is often large. Brushite stone patients also have very severe renal pathology with cell damage, tubule obstruction, and nephron drop-out [11]. Researchers have investigated the correlation of stone internal structure by CT imaging to stone fragility by ESWL, and concluded that the internal structure of a stone contributes to its fragility to ESWL [12-16]. Kidney stones are composed of a crystalline mineral phase and a non-crystalline organic matrix phases. Variability in susceptibility of kidney stone to ESWL could be due to the presence of various amounts of organic matrix, which could affect both stone structure and morphology.
Organic matrix is an integral part of all kidney stones and generally appears to be distributed throughout the stone structure [17]; the amount of matrix in stones is reported to be 2-10% of total dry weight [18-23]. All types of organic biomolecules (proteins, lipids and carbohydrates) have been identified in the organic matrix of kidney stones; however protein is the predominant material within the organic matrix, representing about 0.3-8% of the dry weight of stones [19;24;25]. Proteins play a major role in modulating crystallization in the urinary tract. Proteins may act as inhibitors or promoters of crystal nucleation and aggregation and may even control the final crystal phase found in stones. Some investigators have proposed that the organic matrix in stone is the main determinant of stones’ internal structure and morphology [19;26]. It has been shown that the void regions present in stone are specifically rich in organic matrix [27]. We hypothesized that proteins present in the organic matrix might differ among stone types, and would provide insight about internal structure. In order to understand the role of proteins in stone structure and morphology we have investigated two different types of stones which are chemically similar in their components, both by micro CT and molecular analyses. Here, we report the correlation between protein and stone morphology, and the differences in the two types of stones.
Materials and Methods
Kidney stones
A total of 30 de-identified human kidney stones, 15 brushite and 15 apatite, were obtained as discards from Beck Analytical Laboratories (Indianapolis, IN). The compositional determination was reported by Beck for each stone sample, obtained from either a portion of the stone used in this study or from a cohort stone from the same patient event. Stone chemical compositions were re-confirmed by Fourier-transform spectroscopy (FT-IR) with a homogenous fine stone powder produced by crushing the whole stone (see below) [28], and it was found that three of the apatite stones contained minor amounts of other minerals (one with some brushite, one with some calcium oxalate monohydrate, and one with amorphous calcium phosphate) and one brushite stone was found to contain a small amount of apatite; however, the stones were predominantly brushite or apatite as reported for the clinical management of the patient. Apatite stones were all found to have some carbonate, as indicated by peaks in the 1415-1420 cm-1 range. This is to be expected, as a larger study found some degree of carbonation in every one of 1,962 apatite stones [29].
Micro-CT analysis and void volume determination
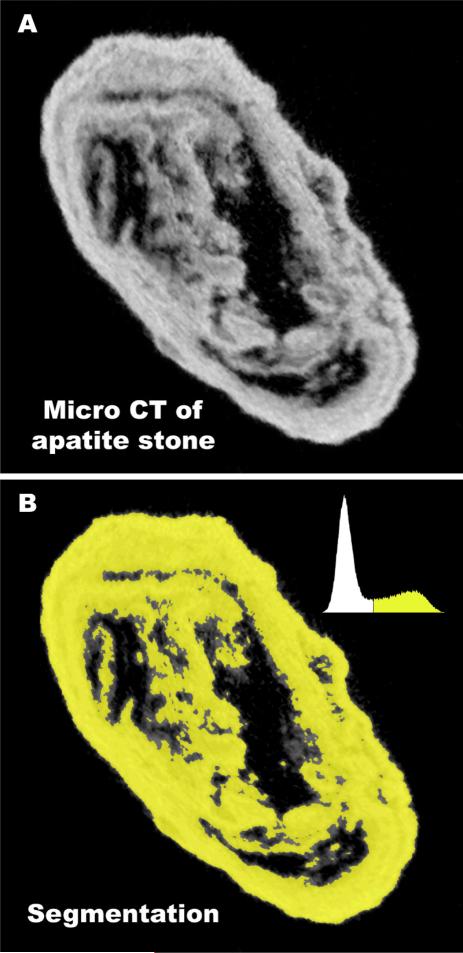
Stones were photographed, weighed, and then scanned using a Scanco mCT20 micro CT system (voxel size from 18 to 34 μm) [30]. Void volumes in stones were determined by thresholding the micro CT image stacks, as illustrated in Fig. 1, to yield stone volumes, with and without ‘holes’ in the regions being counted. The percentage of ‘holes’ or voids within each stone was then calculated. Void volumes were calculated for all stones using both ImageJ (http://rsb.info.nih.gov/ij/) and Amira (Mercury Computer Systems, Chelmsford, MA, USA), which have slightly different features for thresholding and handling image noise, and results were not different for these two software tools (p=0.23).
Fig. 1.
Method for determining volume of x-ray lucent regions (voids) using micro CT. A: Micro CT slice of an apatite stone, showing dark regions (voids) within the stone. Total micro CT reconstruction of this stone involved a stack of 243 such slices, each representing 25.5 μmof thickness through the stone. B: Stone mineral was segmented using image histogram, shown in upper right of panel. Segmented regions were summed in all slices to give total stone mineral volume. This sum was repeated, but including void regions to give total stone volume, and void volume calculated from the difference.
Stone dissolution and protein extraction
Stones were crushed with mortar and pestle to a fine powder. Total protein was extracted from the powdered stone using 3 different solutions in separate steps. In step 1, 5mg of stone powder was extracted with 1ml of a solution comprised of 0.25 M EDTA, 2% SDS, 20 mM beta-mercaptoethanol and 10 ul protease inhibitor cocktail (Sigma, ABSF, E-64 etc.) by continuously rotating samples at 25°C for 20h. During this extraction step the solution was supplemented once with fresh beta-mercaptoethanol (20 mM), 5h after starting. In step 2, undissolved stone components from step 1 were pelleted by spinning at 14,000 rpm for 5 min at 25°C, and further extracted by mixing with a solution comprised of 50 mM Tris-HCl, pH 7.5, 2% SDS, 150 mM NaCl and 50 mM beta-mercaptoethanol and boiling for 15 minutes. In step 3, undissolved stone components from step 2 were pelleted by spinning at 14,000 rpm for 5 min at 25°C, and further extracted with a solution comprised of 8 M Urea and 50 mM Tris-HCl, pH 7.5. Extracted protein solutions from all 3 steps were pooled and mixed together, and desalted by gelfiltration chromatography (Zeba desalt spin column, Pierce, Rockford, IL). Pierce's Zeba desalt spin columns are recommended for processing compounds >7,000 MW. The chromatography column was equilibrated with elution buffer (50 mM Tris-HCl) before use. The protein concentration was measured by BioRad RC-DC protein assay kits (Bio-Rad Laboratories, Hercules, CA).
Data analysis
Systat 11 software was used to calculate Pearson's correlations and the non-parametric Mann-Whitney test, which was used for comparison of protein content and void volume with type of stone, as not all data was normally distributed. Multiple ANOVA was done with JMP 7.1 statistical software. All data were presented as mean±SD. A p-value of less than 0.05 was taken as significant.
Results
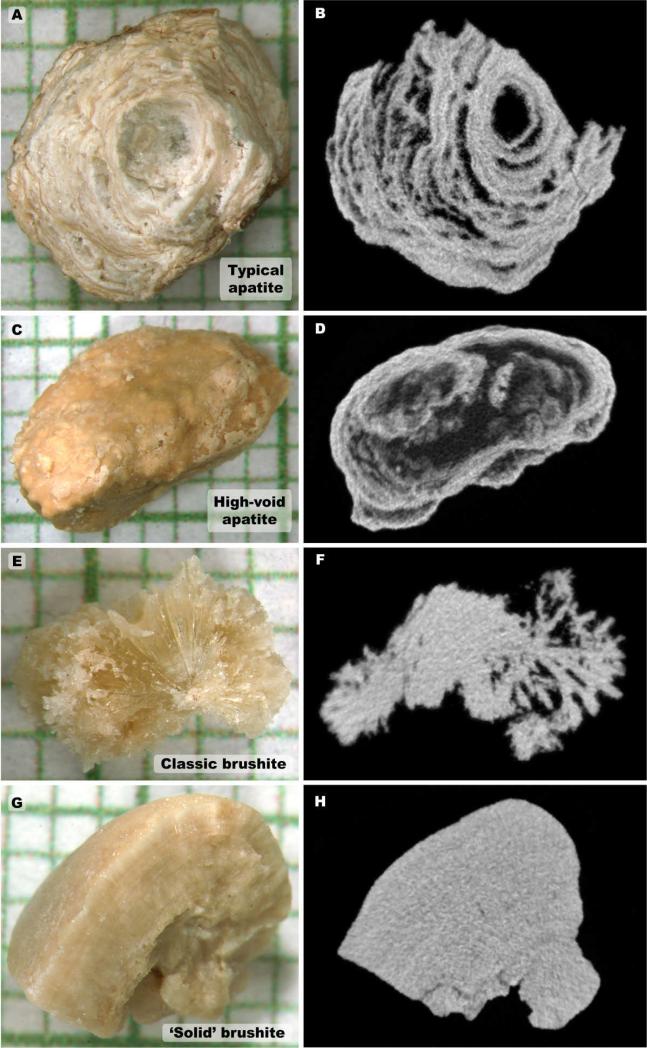
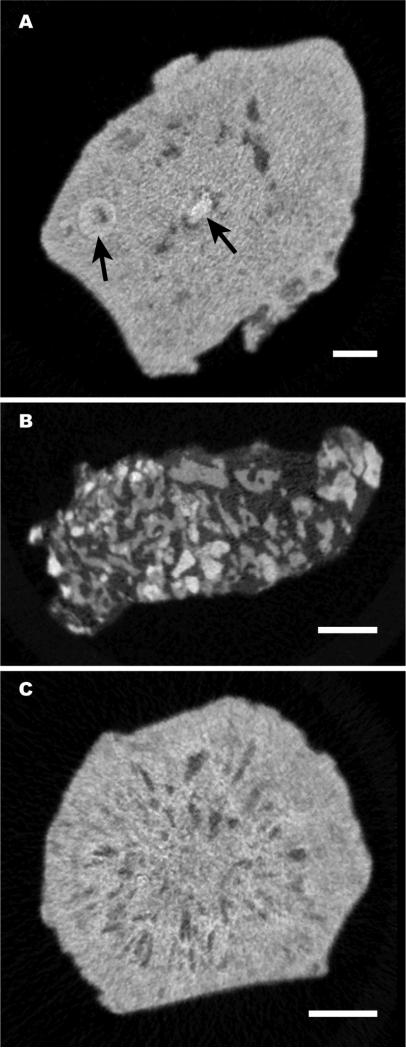
Micro CT morphologies of phosphate stones have never before been reported. In the stones analyzed in the present study, we observed most apatite stones to display a morphology consisting of multiple x-ray dense layers separated by layers of varying x-ray lucency, as shown in Fig. 2, a and b, with some of these stones showing larger interior void regions (Fig. 2, c and d). However, 3 of the 15 apatite stones in the present study presented with different morphologies, not showing the alternating layering of x-ray dense and x-ray lucent layers (Fig. 3). There are not enough examples of these morphologies in the present study to comment on possible correlations with minor stone components, but these are listed in Fig. 3 on a case-by-case basis.
Fig. 2.
Examples of morphology of stones used in this study; A and B: Photograph and representative micro CT image slice for an apatite stone showing typical layering of mineral. C and D: Apatite stone with large internal void regions. E and F: Same for brushite stone that showed long crystals radiating out from center. G and H: Brushite stone with more compact morphology. Grids in panels A, C, E and G show 1 mm increments.
Fig. 3.
Micro CT slices of three ‘odd’ morphologies for apatite stones, found among the 15 stones in this study. A: Stone was relatively solid, with isolated nodule-like structures within it (arrows). B: Stone was composed of small pieces of apatite, each <0.5 mm,held together with an x-ray lucent material. C: Stone contained many small voids, which were arranged radially about the stone axis. By FT-IR, this stone showed the presence of some amorphous calcium phosphate. Bars indicate 1 mm.
Brushite stones presented with two main morphologies by micro CT. Several brushite stones showed radial arrangement of crystals (Fig. 2, e and f), which was especially apparent when scrolling through image stacks. Other brushite stones showed a more uniform distribution of mineral (‘solid’ forms, Fig. 2, g and h).
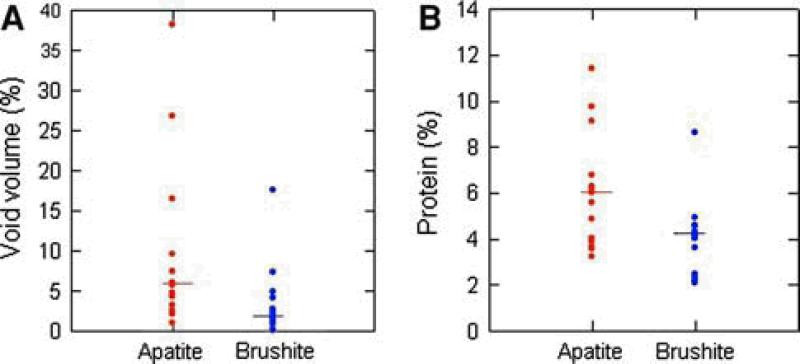
Apatite stones had significantly more void regions than the brushite stones, with brushite averaging 3.2±4.5% void volume, and apatite averaging 10.8±11.2% void volume, p<0.005. As shown in Fig. 4a, there was overlap in the distribution between these two types of stone.
Fig. 4.
Void volume and protein (percentage of dry stone weight) distribution among 15 apatite and 15 brushite stones, the bar represents the median value.
With the use of a combination of solutions the stone protein was effectively extracted. Twenty-seven out of the 30 apatite and brushite stones had no visible pellet. The other 3 stones left only a negligible but visible pellet, too small to weigh. The presence of protein ranged as low as 2.1% and as high as 11.4% of the dry weight of the stone (Fig. 4b). Overall, stone protein content was 5.1±2.2%, with the 15 brushite stones averaging 4.1±1.6% protein, and the 15 apatite stones averaging 6.0±2.4% protein. Protein contents were significantly higher in apatite than brushite kidney stones, p<0.03.
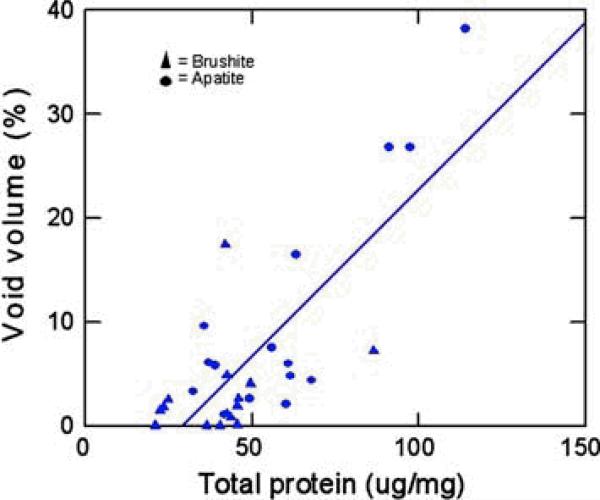
There was no obvious relationship of stone morphologies or minor stone components to protein content in stones, but stone protein content was highly correlated with the percentage of void regions within the stones (r2= 0.61, P<0.0001, Fig. 5). Multiple anova with protein content as the dependent variable showed no overall effects of stone type (apatite or brushite, P=0.31) or stone purity (presence or absence of significant minor mineral components, P=0.62) but only the significant relationship between stone protein content and voids. Carbonation in apatite stones averaged 7.7±5.3%, with no significant correlation with voids (P=0.21) or protein (P=0.28).
Fig. 5.
Correlation between void volume and protein contents, the solid line represents the linear regression (r2= 0.61, P<0.0001).
Discussion
In earlier studies investigators used microradiography and electron microscopy to study the internal structure of kidney stones [17;31;32]. They found that organic matrix is present throughout each stone. Here we used micro CT to visualize stone internal structure. Void regions in a stone represent the absence of x-ray dense crystals. In some stones we found that the void regions were of such a volume that the organic matrix represented a large portion of the stone volume (Fig. 3b), and this was borne out in the measurements of extracted protein (Fig. 5).
The minor discrepancies between the compositional data reported from the clinical laboratory and our FTIR analyses are not surprising, for two reasons. First, the clinical laboratory tested only a portion of the stone, or even another stone from the same patient event, and so may have analyzed a stone portion that was actually different from the one used in this study. Second, clinical laboratories generally use diffuse reflectance FT-IR, where infrared light is bounced off the surface of powder, while stone powders in the present study were analyzed in KBr pellets using transmission FT-IR, which gives superior results in detecting minor components and is also less affected by variation in particle size of ground powder [33]. Nevertheless, the discrepancies are instructional, suggesting that workers should not take for granted that a stone sample they are using is pure without some additional verification.
Proteins are a major part of a kidney stone, but analysis of stone protein has been difficult due to the poor solubility of kidney stone proteins. The calcium chelating agent EDTA has been used frequently to decalcify calcium containing stones. While EDTA is an excellent reagent for decalcifying stones, matrix proteins are very difficult to dissolve simultaneously in this solution, as many are calcium-binding proteins that may denature at low calcium concentration. For this reason, many workers have used the term “extractible or EDTA-soluble proteins” to report their findings [17;25;34]. Multiple investigators have tried different types of solutions and methods to dissolve and extract kidney stone proteins; however in most of the cases they were unsuccessful in getting all proteins into solution [35-37]. Lian et al [25] extracted proteins using 0.5 M EDTA for 48 h, 3x and found calcium oxalate stones to have total protein contents ranged from 2.6-5.3% of the dry weight of stones; protein content of hydroxyapatite (pooled 7 stones from one patient) was 7.8% and 0.4-0.9% protein was present in struvite, uric acid, cystine and apatite-struvite stones. Williams et al [24] compared 4 different methods for COM stone dissolution and found extractible proteins to range only from 0.18-0.55% of stone weight. Dawson et al [38] extracted calcium oxalate (8 stones) or calcium phosphate stones (2 stones) with 0.25M EDTA for 48h, and found variable amounts of protein; in some samples, protein bands were barely visible. Sugimoto et al [39] extracted stone proteins in saline by dialyzing against 0.1 M EDTA, and found protein levels were significantly increased in calcium phosphate (3 stones) over calcium oxalate stones, with an average extractible protein content of all stones of 1.6%.
Many reports have analyzed stone extracts for the presence of specific proteins [37-41]. However, there is no reported method to isolate all proteins completely in soluble form, so to date a complete profile of renal stone proteins is not available. In our work here, we tested many solutions that have already been published in the literature for protein extraction from the kidney stones; however none of them dissolved the brushite and apatite stones completely. In all cases a portion of stone material was left after extraction; this insoluble part we found to be protein, after hydrolysis and amino acid analysis. The three-step protocol described here was able to extract the stone matrix protein completely, so that no visible pellet was left in most of the stones however, 3 stones left visible but negligible pellet behind which was too little to analyze further.
The most common number quoted for stone protein content is probably that of Boyce & Garvey [32], who used EDTA to extract matrix from pools of 25-100 stones of different compositions, finding an overall mean ash-free matrix content of 2.52%. This number included a pool of 50 calcium phosphate stones—presumably apatite and brushite stones—which was found to have a matrix content of 2.32%. The values in the present study are considerably higher than that number. One possible explanation for this difference is that the three-step method used here was able to extract a considerable amount of protein that is resistant to simple EDTA dissolution.
Protein content in the stones in the present study was correlated with the presence of x-ray lucent regions (voids) within the stones. These voids are regions without significant mineral content. However, it is known that the protein matrix of stones can surround individual crystals of mineral in the bulk of the stone [42], so that the protein associated with voids is only a portion of the stone matrix.
The association of protein content with this morphological feature raises the question of whether protein matrix is uniform throughout the stone. Apatite stones usually are composed of alternating layers of x-ray dense material (presumably containing the calcium phosphate mineral) and x-ray lucent material, which apparently is lower in mineral. The role of protein in the formation of this morphology is unknown, as is the relative contents of protein in the different layers. Indeed, the role of proteins in the process of stone formation is poorly understood, for voids or mineral portions of any kind of stone. The development of a procedure to extract all (or almost all) of stone protein for analysis is an important step in being able to study the role of protein in stone formation. From our observations and from reports in the published literature we strongly believe that the proteins of the organic matrix are likely to play very important roles in the agglomeration of crystals and/or crystal deposition into organic matrix, and thus these proteins would form an important part of the pathology of stone disease. Their identity and function are thus important to understand.
Acknowledgements
We would like to thank Dr. James E. Lingeman and Beck Analytical Services for providing the stones for this research. This research was supported by National Institute of Health grants 6R44DK071375-04 and R01 DK59933.
Reference List
- 1.Stamatelou KK, Francis ME, Jones CA, Nyberg LM, Curhan GC. Time trends in reported prevalence of kidney stones in the United States: 1976-1994. Kidney Int. 2003;63:1817–1823. doi: 10.1046/j.1523-1755.2003.00917.x. [DOI] [PubMed] [Google Scholar]
- 2.Morton AR, Wooltorton E. Nephrology in practice: a new series. CMAJ. 2002;166:195. [PMC free article] [PubMed] [Google Scholar]
- 3.Herring LC. Observations on the analysis of ten thousand urinary calculi. J.Urol. 1962;88:545–562. doi: 10.1016/S0022-5347(17)64842-0. [DOI] [PubMed] [Google Scholar]
- 4.Mandel NS, Mandel GS. Urinary tract stone disease in the United States veteran population. Geographical analysis of variations in composition. J Urol. 1989;142:1516–1521. doi: 10.1016/s0022-5347(17)39145-0. [DOI] [PubMed] [Google Scholar]
- 5.Tefekli A, Esen T, Ziylan O, Erol B, Armagan A, Ander H, Akinci M. Metabolic risk factors in pediatric and adult calcium oxalate urinary stone formers: is there any difference? Urol Int. 2003;70:273–277. doi: 10.1159/000070134. [DOI] [PubMed] [Google Scholar]
- 6.Mandel N, Mandel I, Fryjoff K, Rejniak T, Mandel G. Conversion of calcium oxalate to calcium phosphate with recurrent stone episodes. J Urol. 2003;169:2026–2029. doi: 10.1097/01.ju.0000065592.55499.4e. [DOI] [PubMed] [Google Scholar]
- 7.Evan AP, Lingeman JE, Coe FL, Parks JH, Bledsoe SB, Shao Y, Sommer AJ, Paterson RF, Kuo RL, Grynpas M. Randall's plaque of patients with nephrolithiasis begins in basement membranes of thin loops of Henle. J.Clin.Invest. 2003;111:607–616. doi: 10.1172/JCI17038. [DOI] [PMC free article] [PubMed] [Google Scholar]
- 8.Matlaga BR, Williams JC, Jr., Kim SC, Kuo RL, Evan AP, Bledsoe SB, Coe FL, Worcester EM, Munch LC, Lingeman JE. Endoscopic Evidence of Calculus Attachment to Randall's Plaque. J Urol. 2006;175:1720–1724. doi: 10.1016/S0022-5347(05)01017-7. [DOI] [PubMed] [Google Scholar]
- 9.Parks JH, Worcester EM, Coe FL, Evan AP, Lingeman JE. Clinical implications of abundant calcium phosphate in routinely analyzed kidney stones. Kidney Int. 2004;66:777–785. doi: 10.1111/j.1523-1755.2004.00803.x. [DOI] [PubMed] [Google Scholar]
- 10.Williams JC, Jr., Saw KC, Paterson RF, Hatt EK, McAteer JA, Lingeman JE. Variability of renal stone fragility in shock wave lithotripsy. Urology. 2003;61:1092–1096. doi: 10.1016/s0090-4295(03)00349-2. [DOI] [PubMed] [Google Scholar]
- 11.Evan AP, Lingeman JE, Coe FL, Shao Y, Parks JH, Bledsoe SB, Phillips CL, Bonsib S, Worcester EM, Sommer AJ, Kim SC, Tinmouth WW, Grynpas M. Crystal-associated nephropathy in patients with brushite nephrolithiasis. Kidney Int. 2005;67:576–591. doi: 10.1111/j.1523-1755.2005.67114.x. [DOI] [PubMed] [Google Scholar]
- 12.Wang LJ, Wong YC, Chuang CK, Chu SH, Chen CS, See LC, Chiang YJ. Predictions of outcomes of renal stones after extracorporeal shock wave lithotripsy from stone characteristics determined by unenhanced helical computed tomography: a multivariate analysis. Eur.Radiol. 2005;15:2238–2243. doi: 10.1007/s00330-005-2742-9. [DOI] [PubMed] [Google Scholar]
- 13.Dretler SP, Spencer BA. CT and stone fragility. J.Endourol. 2001;15:31–36. doi: 10.1089/08927790150500926. [DOI] [PubMed] [Google Scholar]
- 14.Cleveland RO, Sapozhnikov OA. Modeling elastic wave propagation in kidney stones with application to shock wave lithotripsy. J.Acoust.Soc.Am. 2005;118:2667–2676. doi: 10.1121/1.2032187. [DOI] [PubMed] [Google Scholar]
- 15.Kim SC, Burns EK, Lingeman JE, Paterson RF, McAteer JA, Williams JC., Jr. Cystine calculi: correlation of CT-visible structure, CT number, and stone morphology with fragmentation by shock wave lithotripsy. Urol.Res. 2007;35:319–324. doi: 10.1007/s00240-007-0117-1. [DOI] [PubMed] [Google Scholar]
- 16.Zarse CA, Hameed TA, Jackson ME, Pishchalnikov YA, Lingeman JE, McAteer JA, Williams JC., Jr. CT visible internal stone structure, but not Hounsfield unit value, of calcium oxalate monohydrate (COM) calculi predicts lithotripsy fragility in vitro. Urol.Res. 2007;35:201–206. doi: 10.1007/s00240-007-0104-6. [DOI] [PMC free article] [PubMed] [Google Scholar]
- 17.Warpehoski MA, Buscemi PJ, Osborn DC, Finlayson B, Goldberg EP. Distribution of organic matrix in calcium oxalate renal calculi. Calcif.Tissue Int. 1981;33:211–222. doi: 10.1007/BF02409440. [DOI] [PubMed] [Google Scholar]
- 18.King JS, Jr., Boyce WH. Amino acid and carbohydrate composition of the mucoprotein matrix in various calculi. Proc.Soc.Exp.Biol.Med. 1957;95:183–187. doi: 10.3181/00379727-95-23161. [DOI] [PubMed] [Google Scholar]
- 19.Boyce WH. Organic matrix of human urinary concretions. Am.J Med. 1968;45:673–683. doi: 10.1016/0002-9343(68)90203-9. [DOI] [PubMed] [Google Scholar]
- 20.Finlayson B, VERMEULEN CW, STEWART EJ. Stone matrix and mucoprotein from urine. J.Urol. 1961;86:355–363. doi: 10.1016/S0022-5347(17)65178-4. [DOI] [PubMed] [Google Scholar]
- 21.Srinivasan S, Kalaiselvi P, Varalakshmi P. Epitaxial deposition of calcium oxalate on uric acid rich stone matrix is induced by a 29 kDa protein. Clin.Chim.Acta. 2006;364:267–274. doi: 10.1016/j.cca.2005.07.010. [DOI] [PubMed] [Google Scholar]
- 22.Roberts SD, Resnick MI. Glycosaminoglycans content of stone matrix. J.Urol. 1986;135:1078–1083. doi: 10.1016/s0022-5347(17)45979-9. [DOI] [PubMed] [Google Scholar]
- 23.Ibrahim A, Shaker Y, Hawary M, Fayek K, et al. Immunochemical studies of serum, urine, and calculus proteins in urolithiasis. Clin.Physiol.Biochem. 1985;3:16–22. [PubMed] [Google Scholar]
- 24.Williams JC, Jr., Zarse CA, Jackson ME, Witzmann FA, McAteer JA. Variability of protein content in calcium oxalate monohydrate stones. J.Endourol. 2006;20:560–564. doi: 10.1089/end.2006.20.560. [DOI] [PMC free article] [PubMed] [Google Scholar]
- 25.Lian JB, Prien EL, Jr., Glimcher MJ, Gallop PM. The presence of protein-bound gamma-carboxyglutamic acid in calcium-containing renal calculi. J.Clin.Invest. 1977;59:1151–1157. doi: 10.1172/JCI108739. [DOI] [PMC free article] [PubMed] [Google Scholar]
- 26.Ryall R. The scientific basis of calcium oxalate urolithiasis. World J.Urol. 1993;11:59–65. doi: 10.1007/BF00182173. [DOI] [PubMed] [Google Scholar]
- 27.Boyce WH, POOL CS, MESCHAN I, King JS., Jr. Organic matrix of urinary calculi; microradiographic comparison of crystalline structure with microscopic and histochemical studies. Acta radiol. 1958;50:543–560. [PubMed] [Google Scholar]
- 28.Daudon M, Protat MF, Reveillaud RJ. [Analysis of gallstones by infrared spectrophotometry. Advantages and limits of the method (author's transl)]. Ann.Biol.Clin.(Paris) 1978;36:475–489. [PubMed] [Google Scholar]
- 29.Maurice-Estepa L, Levillain P, Lacour B, Daudon M. Crystalline phase differentiation in urinary calcium phosphate and magnesium phosphate calculi. Scand.J.Urol.Nephrol. 1999;33:299–305. doi: 10.1080/003655999750017365. [DOI] [PubMed] [Google Scholar]
- 30.Zarse CA, McAteer JA, Sommer AJ, Kim SC, Hatt EK, Lingeman JE, Evan AP, Williams JC., Jr. Nondestructive analysis of urinary calculi using micro computed tomography. BMC.Urol. 2004;4:15. doi: 10.1186/1471-2490-4-15. [DOI] [PMC free article] [PubMed] [Google Scholar]
- 31.Binette JP, Binette MB. The matrix of urinary tract stones: protein composition, antigenicity, and ultrastructure. Scanning Microsc. 1991;5:1029–1034. [PubMed] [Google Scholar]
- 32.Boyce WH, GARVEY FK. The amount and nature of the organic matrix in urinary calculi: a review. J.Urol. 1956;76:213–227. doi: 10.1016/S0022-5347(17)66686-2. [DOI] [PubMed] [Google Scholar]
- 33.Fuller M, Griffiths P. Diffuse Reflectance Measurements by Infrared Fourier Transform Spectrometry. Anal.Chem. 1978;50:1906–1910. [Google Scholar]
- 34.Spector AR, Gray A, Prien EL., Jr. Kidney stone matrix. Differences in acidic protein composition. Invest Urol. 1976;13:387–389. [PubMed] [Google Scholar]
- 35.Jones WT, Resnick MI. The characterization of soluble matrix proteins in selected human renal calculi using two-dimensional polyacrylamide gel electrophoresis. J.Urol. 1990;144:1010–1014. doi: 10.1016/s0022-5347(17)39648-9. [DOI] [PubMed] [Google Scholar]
- 36.Siddiqui AA, Sultana T, Buchholz NP, Waqar MA, Talati J. Proteins in renal stones and urine of stone formers. Urol.Res. 1998;26:383–388. doi: 10.1007/s002400050073. [DOI] [PubMed] [Google Scholar]
- 37.Dussol B, Geider S, Lilova A, Leonetti F, Dupuy P, Daudon M, Berland Y, Dagorn JC, Verdier JM. Analysis of the soluble organic matrix of five morphologically different kidney stones. Evidence for a specific role of albumin in the constitution of the stone protein matrix. Urol.Res. 1995;23:45–51. doi: 10.1007/BF00298850. [DOI] [PubMed] [Google Scholar]
- 38.Dawson CJ, Grover PK, Kanellos J, Pham H, Kupczyk G, Oates A, Ryall RL. Inter-alpha-inhibitor in calcium stones. Clin.Sci.(Lond) 1998;95:187–193. [PubMed] [Google Scholar]
- 39.Sugimoto T, Funae Y, Rubben H, Nishio S, Hautmann R, Lutzeyer W. Resolution of proteins in the kidney stone matrix using high-performance liquid chromatography. Eur.Urol. 1985;11:334–340. doi: 10.1159/000472531. [DOI] [PubMed] [Google Scholar]
- 40.Mushtaq S, Siddiqui AA, Naqvi ZA, Rattani A, Talati J, Palmberg C, Shafqat J. Identification of myeloperoxidase, alpha-defensin and calgranulin in calcium oxalate renal stones. Clin.Chim.Acta. 2007;384:41–47. doi: 10.1016/j.cca.2007.05.015. [DOI] [PubMed] [Google Scholar]
- 41.Kaneko K, Yamanobe T, Nakagomi K, Mawatari K, Onoda M, Fujimori S. Detection of protein Z in a renal calculus composed of calcium oxalate monohydrate with the use of liquid chromatography-mass spectrometry/mass spectrometry following two-dimensional polyacrylamide gel electrophoresis separation. Anal.Biochem. 2004;324:191–196. doi: 10.1016/j.ab.2003.09.018. [DOI] [PubMed] [Google Scholar]
- 42.Khan SR, Hackett RL. Microstructure of decalcified human calcium oxalate urinary stones. Scan Electron Microsc. 1984:935–941. [PubMed] [Google Scholar]


