Abstract
Understanding the biology that underlies histologically similar but molecularly distinct subgroups of cancer has proven difficult since their defining genetic alterations are often numerous, and the cellular origins of most cancers remain unknown1–3. We sought to decipher this heterogeneity by integrating matched genetic alterations and candidate cells of origin to generate accurate disease models. First, we identified subgroups of human ependymoma, a form of neural tumor that arises throughout the central nervous system (CNS). Subgroup specific alterations included amplifications and homozygous deletions of genes not yet implicated in ependymoma. To select cellular compartments most likely to give rise to subgroups of ependymoma, we matched the transcriptomes of human tumors to those of mouse neural stem cells (NSCs), isolated from different regions of the CNS at different developmental stages, with an intact or deleted Ink4a/Arf locus. The transcriptome of human cerebral ependymomas with amplified EPHB2 and deleted INK4A/ARF matched only that of embryonic cerebral Ink4a/Arf−/− NSCs. Remarkably, activation of Ephb2 signaling in these, but not other NSCs, generated the first mouse model of ependymoma, which is highly penetrant and accurately models the histology and transcriptome of one subgroup of human cerebral tumor. Further comparative analysis of matched mouse and human tumors revealed selective deregulation in the expression and copy number of genes that control synaptogenesis, pinpointing disruption of this pathway as a critical event in the production of this ependymoma subgroup. Our data demonstrate the power of cross-species genomics to meticulously match subgroup specific driver mutations with cellular compartments to model and interrogate cancer subgroups.
Ependymomas are tumors of the brain and spinal cord4. Surgery and irradiation remains the mainstay of treatment of this disease since chemotherapy is ineffective in most patients. Consequently, ependymoma is incurable in up to 40% of cases5. Despite histologic similarities, ependymomas from different regions of the CNS display disparate prognoses, transcriptional profiles and genetic alterations6–8, suggesting they are different diseases and confounding efforts to study, model and treat these tumors.
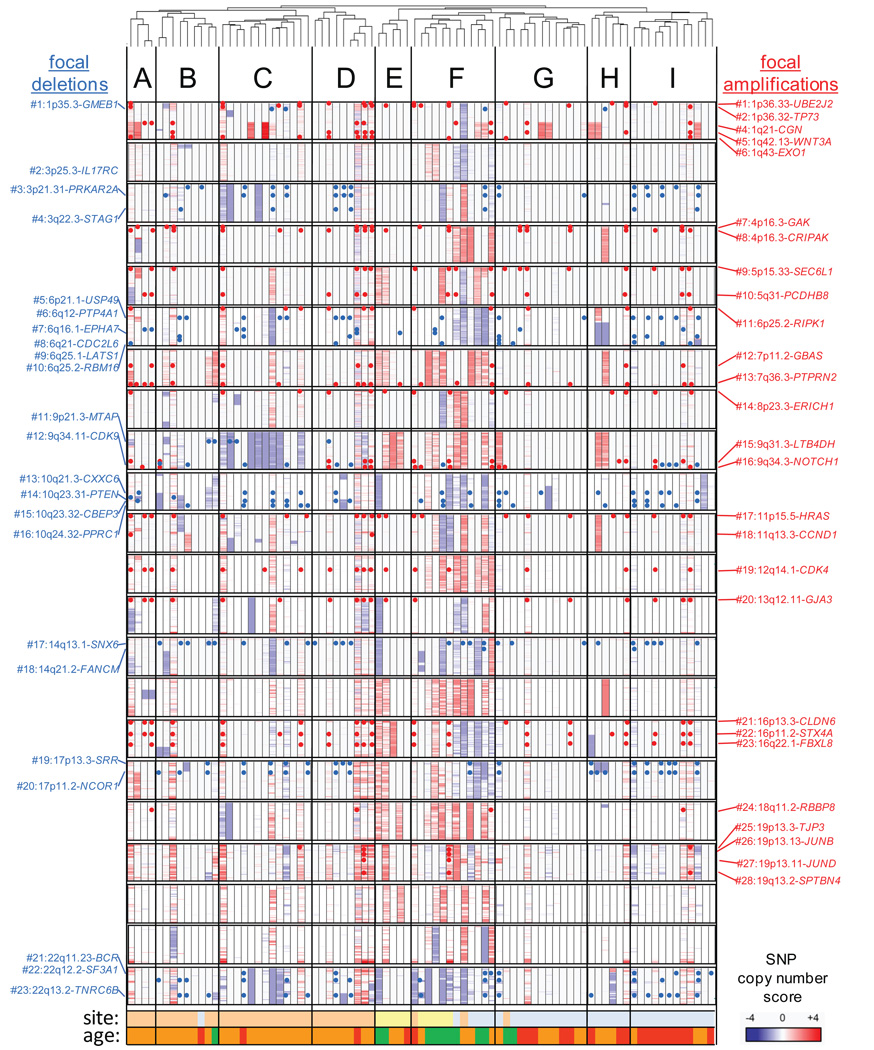
To understand the biological basis of ependymoma heterogeneity, we catalogued DNA copy number alterations (CNAs) among 204 tumor samples and generated messenger (m)RNA and micro (mi)RNA expression profiles for 83 and 64 of these tumors, respectively (Supplemental Figure 1, Supplemental Table 1). mRNA profiles segregated tumors by CNS location and unmasked previously unknown subgroups among supratentorial, posterior fossa and spinal ependymomas (Subgroups A to I, Figure 1). Notably, miRNAs segregated tumors by location and subgroup in a manner that significantly matched that of mRNA profiles (Rand index for mRNA subgroup match=0.88, P<0.0001;Supplemental Figure 2). Large chromosomal CNAs occurred most frequently in spinal tumors, enriching their mRNA expression signature for genes gained and over-expressed on chromosomes 4, 7, 9, 12, 15q and 18q and deleted and under-expressed on 22q (permutation analysis of each, P<0.005; Supplemental Figures 3 and 4; Supplemental Table 2a). Similarly, deletion and under-expression of chromosomes 3, 9 and 22q enriched the expression signature of subgroup C, while deletion and under-expression of 6q was observed in subgroup H (Supplemental Figure 4). The observation that mRNA, miRNA and CNA profiles cluster ependymomas into similar subgroups supports the notion that these subgroups are true biologic entities.
Figure 1. The ependymoma genome.
Dendrogram at top segregates 83 human ependymomas into nine subgroups (A to I) according to mRNA expression profiles. Clusters were validated by two distinct methods that confirmed agreement for location (Rand index=0.93, P<0.0001) and subgroup (Rand index=0.87, P<0.0001). Heatmap below reports in columns for each case chromosomal gains (red) and losses (blue). Each row represents a chromosome. Red ‘dots’ report focal amplifications (details right), blue ‘dots’ focal deletions (details left). Details are reported in the Supplemental Gene Cards. Site: supratentorial (pink), posterior fossa (blue), spine (yellow). Age: patients <3 years (red), 3–21 years (orange), >21 years (green).
In addition to large chromosomal alterations we identified 175 focal amplifications (average size 159kb) and 157 focal deletions (average size 199kb) encoding 1,236 and 1,209 transcripts, respectively (see Supplemental Methods section, Supplemental Table 3 and Supplemental Gene Cards). In contrast to large alterations, focal CNAs occurred most frequently in supratentorial ependymomas (Supplemental Table 2b). Alignment of each focal CNA against the database of Copy Number Variants (CNVs) revealed which overlapped with known CNVs (http://projects.tcag.ca/variation/), but these were not excluded from further analysis since recent data suggests CNVs might contribute to disease states including cancer9. Fifty-one of 57 selected CNAs that were likely to encode oncogenes or tumor suppressor genes (TSGs) were validated by Real-Time PCR and/or fluorescence in situ hybridization (FISH) (Figure 1; Supplemental Table 4; Supplemental Gene Cards; see Supplemental Methods for selection criteria). This extensive analysis confirmed and refined previously reported CNAs (e.g., deletion of INK4A/ARF7, amplification of NOTCH18, and three discrete focal 22q deletions), and identified 28 and 23 novel recurrent focal amplifications and deletions, respectively.
To prioritize for further study genes within focal CNAs that may have driven clonal selection, we correlated DNA copy number with the level of transcripts encoded by each affected loci (Supplemental Gene Cards). Seventeen percent (n=107/632) of genes located within 28 validated focal amplicons displayed evidence of copy number driven expression, highlighting them as potential ependymoma oncogenes (Supplemental Table 5a). Notably, these included several regulators of stem cell proliferation, pluripotency and neural differentiation e.g., THAP1110, PSPH11, EPHB212, ten genes within the PCDH cluster13, KCNN114, RAB3A15,16, PTPRN217 and NOTCH118, the latter being the only candidate ependymoma oncogene identified to date8. Eighteen-percent (n=130/728) of genes located within 23 validated focal deletions displayed copy number driven decreased expression compatible with these being TSGs (Supplemental Table 5b and Supplemental Gene Cards). These included established TSGs previously implicated in ependymoma7 e.g., PTEN, CDKN2A/CDKN2B, as well as genes with no prior known role in cancer (e.g., STAG1 [3q22.3] and TNRC6B [22q13.1]). Since the few known candidate ependymoma oncogenes and TSGs were identified by our comprehensive bioinformatics, we suggest that the other genes identified here are highly enriched for those involved in ependymoma tumorigenesis.
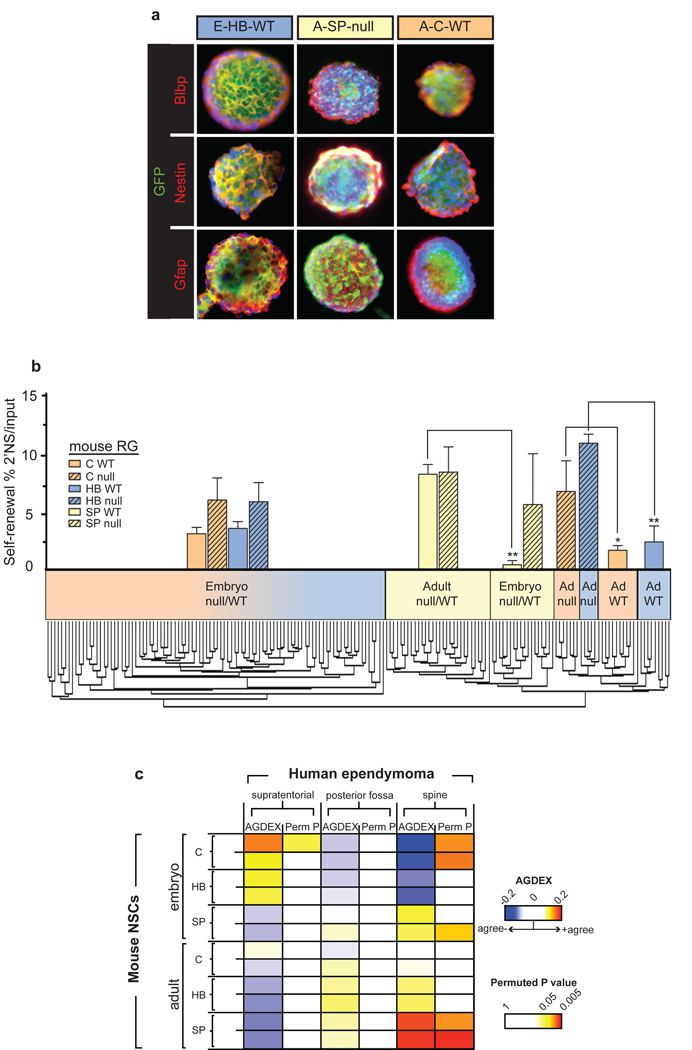
Recently, we showed that intracranial and spinal ependymomas are propagated by radial glia (RG)-like cancer stem cells7. RG function as NSCs in the embryo and give rise to adult NSCs19,20. Throughout development NSCs located in the different regions of the CNS display intrinsic biological differences that include the expression of variable transcription factor profiles and the production of different kinds of neurons19,21. Therefore, we reasoned that individual subgroups of ependymoma might arise from regionally and developmentally distinct NSCs that are susceptible to transformation by different gene mutations. To test this hypothesis we first established a robust source of RG (hereon, embryonic NSCs) and adult NSCs. Enhanced green fluorescent protein (eGFP)+ cells were isolated from the cerebrum, hindbrain and spine of embryonic day (E) 14.5 and adult Blbp-eGFP transgenic mice that express eGFP within the embryonic NSC-astroglial-adult NSC lineage22–24 (Figure 2). eGFP+ cells were isolated from both Ink4a/Arf+/+ and Ink4a/Arf−/− mice since this locus is frequently deleted from human cerebral ependymomas (Figure 1; Supplemental Gene Cards). When cultured under conditions that promote stem cell growth, all 12 distinct eGFP+ cell isolates were demonstrated to be NSCs that displayed a Nestin+/Prom1+/Gfap+/Rc2+/Blbp+ immunophenotype19 and self-renewed as clonal multipotent neurospheres (Figure 2a and b; Supplemental Figure 5). mRNA expression profiles of 177 separate NSC cultures segregated these cells according to location (intracranial vs. spine) and developmental stage (embryonic vs. adult), and further segregated adult intracranial NSCs by brain region (cerebral vs. hindbrain) and Ink4a/Arf status (Figure 2b). Notably, cerebral and hindbrain NSCs isolated from Ink4a/Arf−/− adult mice displayed an increased self-renewal capacity (Figure 2b). Together, these data confirm functional differences between regionally, developmentally and genetically defined NSC isolates and validate reports that increasing Cdkn2a expression negatively regulates self-renewal in aging cerebral NSCs25.
Figure 2. Regionally, developmentally and genetically discrete NSCs match subgroups of human ependymoma.
a. Co-immunofluorescence of neurospheres generated by NSC from the cerebrum (C), hindbrain (HB) and spine (SP) of embryonic (E) and adult (A) Ink4a/Arf null or WT Blbp-eGFP mice. b. Graph of percentage of multi-potent daughter neurospheres formed from each NSC type. Dendrogram segregates 177 NSC isolates into subgroups according to mRNA expression. c. Heatmap of transcriptomic (AGDEX, 14,261 orthologs) agreement between mouse NSCs and human supratentorial, posterior fossa and spinal ependymomas. NB. Supratentorial ependymomas match only embryonic cerebral Ink4a/Arf null NSCs; spinal ependymomas match mouse adult spinal NSCs.
To pinpoint which NSCs might give rise to ependymoma subgroups, we developed a novel algorithm that we termed agreement of differential expression (AGDEX) that detects transcriptomic similarities between tissues from different species by comparing the expression of shared orthologs (see Supplemental Methods). The transcriptome of cerebral ependymomas significantly matched only that of embryonic cerebral Ink4a/Arf−/− NSCs (n=14,261 orthologs, permuted P<0.05). Conversely, spinal ependymomas were most similar to adult spinal NSCs (permuted P<0.005). Interestingly, these development-dependent correlations reflect the epidemiology of the disease: cerebral ependymomas affect three times more pediatric than adult patients, while spinal ependymomas are five times more common in adults26. These data pinpoint embryonic cerebral NSCs and adult spinal NSCs as putative cells of origin of cerebral and spinal ependymoma, respectively, and support genetic evidence that deletion of INK4A/ARF is important in the development of cerebral ependymoma.
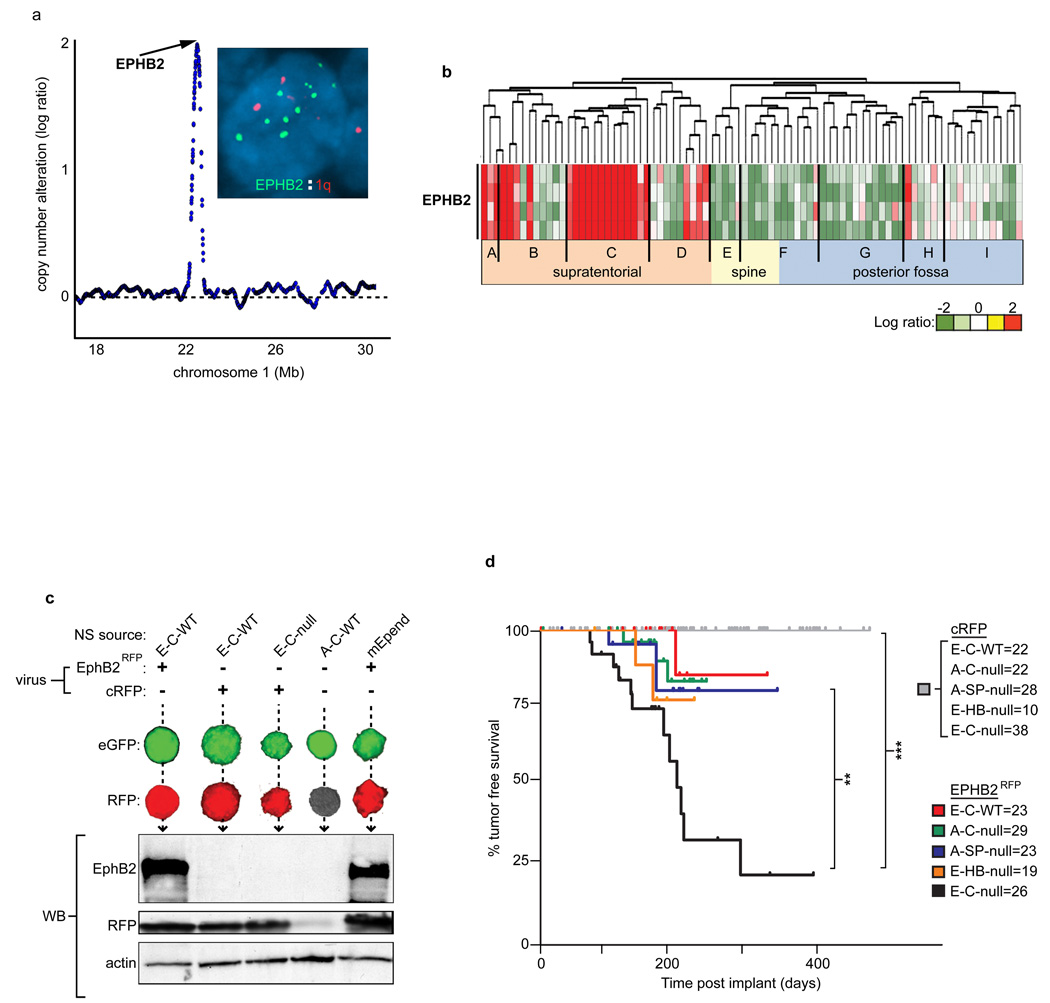
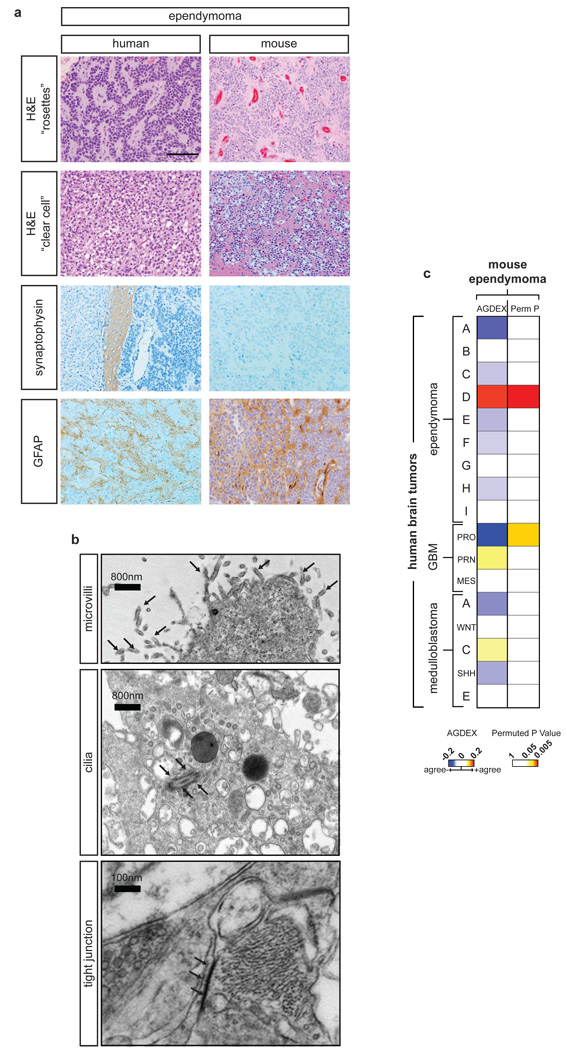
To test directly if embryonic cerebral Ink4a/Arf−/− NSCs represent a specific source of cerebral ependymomas, we challenged these cells with Ephb2 that we identified to be selectively amplified and/or over-expressed in these tumors (Figure 3a and b) and that was shown recently to regulate stem cell proliferation and tumorigenesis in the intestine27. For comparative purposes, we also challenged a panel of four other NSC isolates (Figure 3c and d). Freshly isolated eGFP+ NSCs were transduced at second neurosphere passage with Ephb2-Red Fluorescence Protein (EphB2RFP) or control (cRFP) viruses (Figure 3c). 1×10⁶ eGFP+/RFP+ NSCs were then implanted in the cerebrum of immunocompromised mice which were observed for signs of tumor development. None of 120 mice implanted with control-transduced NSCs developed tumors (median follow up 227 days, Figure 3d). Mice implanted with Ephb2RFP transduced embryonic cerebral Ink4a/Arf+/+, adult cerebral Ink4a/Arf−/−, embryonic hindbrain Ink4a/Arf−/− or adult spinal Ink4a/Arf−/− NSCs developed tumors with non-ependymal histologies at very low rates (9.6%, n=9/94 median follow up 241 days; Figure 3d; Supplemental Figure 6). In stark contrast, 50% of mice implanted with Ephb2RFP transduced embryonic cerebral Ink4a/Arf−/− NSCs developed EphB2+/eGFP+/RFP+ brain tumors within 200 days of implantation, and less than 30% were tumor-free by 300 days (Log Rank P<0.0005, median follow up 230 days, Figure 3d). Remarkably, these mouse tumors were histologically indistinguishable from human ependymomas, displaying characteristic pseudo-rosettes, a uniform (non-nodular) distribution of cells and clear cell phenotype—all hallmarks of certain cerebral ependymomas (Figure 4a)28. Furthermore, electron microscopy identified microvilli, cilia and tight junctions in these mouse tumors that are classic ultrastructural features of human ependymoma (Figure 4b). Thus, the specific combination of embryonic cerebral NSCs, deletion of Ink4a/Arf and amplification of EphB2 generates cerebral ependymoma, supporting strongly the hypothesis that ependymoma variants arise from specific combinations of susceptible NSCs and matched mutations.
Figure 3. EPHB2 is an ependymoma oncogene that selectively transforms embryonic cerebral Ink4a/Arf−/− NSCs.
a. SNP array profile infers focal EPHB2 amplification in human supratentorial ependymoma, validated by FISH analysis (inset) of the EPHB2 locus. b. Profiles of EPHB2 mRNA expression in the human ependymomas shown in Figure 1. c. eGFP/RFP co-immunofluorescence (top) and EphB2, RFP western blot analysis (below), of eGFP+ NSCs transduced with Ephb2 (Ephb2RFP) or control (cRFP) virus. d. Tumor free survival of mice implanted with Ephb2RFP or control transduced cells. Numbers next to each NSC type indicate the number of implanted mice (**, P<0.005; ***, P<0.0005, Log Rank Test).
Figure 4. Ephb2-driven mouse ependymomas model human subgroup ‘D’ tumors.
a. Comparative histology of a representative human cerebral (left) and Ephb2-driven mouse (right) ependymoma including the neuronal marker synaptophysin and glial marker glial fibrillary acidic protein (GFAP). Scale bar=100µm, all panels. (b) Electron micrographs of EphB2-driven mouse ependymomas showing three ultrastructural hallmarks of human ependymoma. (c) Heatmap reporting the transcriptomic agreement (AGDEX) and corresponding permuted p-value in comparisons between EphB2-driven mouse ependymoma and 18 molecular subtypes of human brain tumor. NB. Mouse ependymomas matched only human subgroup D ependymomas.
To test further the fidelity of this new mouse model of cerebral ependymoma, we used the AGDEX algorithm to correlate the ortholog expression profiles of 12 Ephb2-driven mouse ependymomas with those of human ependymoma subgroups (A to I) as well as previously described molecular subgroups of human glioblastoma29 and medulloblastoma30. This analysis confirmed a highly significant and selective match between mouse and human cerebral ependymoma but no other tested human brain tumor (permuted P <0.0001, Figure 4c). Remarkably, the transcriptome of our mouse model matched a single human cerebral ependymoma subgroup (D), validating subgroup D as a true disease entity. Review of the orthologs that were most significantly and differentially expressed in both Ephb2-driven mouse ependymomas (relative to embryonic cerebral Ink4a/Arf−/− NSCs) and human subgroup D tumors (relative to other human tumors) revealed these to be highly enriched for regulators of neural differentiation and maintenance, particularly ion transport and synaptogenesis (n=70/160, Fisher’s Exact Test, Q<0.0001, Supplemental Table 6). Eleven of these common signature orthologs were also targeted by CNAs in subgroup D tumors, of which six directly regulate neurogenesis and maintenance (Supplemental Table 6). Thus, we predict that aberrant EPHB2 signaling and deletion of INK4A/ARF disrupts key neural differentiation pathways in embryonic cerebral NSCs during the formation of subgroup D ependymoma.
We describe a novel cross-species genomic approach that meticulously matches subgroup specific driver mutations and appropriate cellular compartments to model human cancer subgroups. Similar efforts are underway to model and validate the remaining human ependymoma subgroups. The approach described here could be applied to other cancers, enabling the identification and matching of candidate cells of origin with appropriate mutations to decipher molecular subgroups.
Methods Summary
Tissue samples and genomics
Human ependymoma samples were obtained from tumor banks with Institutional Review Board approval. Human and mouse tumors comprised a minimum of 85% tumor cells. Expression profiles were generated using Affymetrix U133 Plusv2 (mRNA human) and 430v2 (mRNA mouse) arrays and Agilent miRNA arrays (human). Expression profiles of 53 human medulloblastomas and 76 glioblastomas were obtained from previously published studies29,30. DNA copy number analyses were performed using the Affymetrix 500K SNP mapping arrays. CNAs were validated by real-time PCR (see Supplemental Table 4) and/or FISH as appropriate7. mRNA and miRNA expression profiles and DNA CNAs were analyzed, validated and integrated using established and novel bioinformatic and statistical approaches (see Supplemental Methods). Common orthologs were filtered from human mouse mRNA expression arrays using sequence mapping.
NSC cultures and implants
Blbp-eGFP transgenic mice were the generous gift of Dr. Nathaniel Heintz (Rockefeller University), FVB.129-Cdkn2atm1Rdp mice were from the MMHCC repository. eGFP+ cells were isolated from Blbp-eGFP mouse brains and spines and cultured in neural stem cell medium as described7. NSCs were transduced with RFP-retroviruses and eGFP+/RFP+ cells sorted using a Becton Dickinson Aria II Cell Sorter. Clonal neurosphere formation and differentiation capacities were assessed in serial dilutions of single-cell suspensions7. NSCs were implanted under stereotactic control into the forebrain of immunocompromised mice and animals were observed daily for signs of tumor development7. All mouse brains were inspected by macroscopic dissection post-mortem. Fresh tumor cells were recovered from mouse brains as described7.
Histology
Sections of human and mouse ependymomas were prepared from formalin paraffin embedded tissues. Protein expression was detected in formalin fixed tissue sections and differentiated NSCs using standard immunohistochemical and immunofluorescence techniques. Electron microscopy was performed using standard tissue preparations and a FEI Tecnai 20 200KV FEG Electron Microscope. Western blot analysis was used to detect protein expression in fresh tissue and cells (for antibodies see Supplemental Methods).
Supplementary Material
Acknowledgements
R.J.G. holds the Howard C. Schott Research Chair from the Malia's Cord Foundation, and is supported by grants from the National Institutes of Health (R01CA129541, P01CA96832 and P30CA021765), the Collaborative Ependymoma Research Network (CERN) and by the American Lebanese Syrian Associated Charities (ALSAC). K.D.W. is supported by NRSA Training Grant T32 CA070089. We are grateful to the Dr. Nathaniel Heintz for providing the Blbp-eGFP mouse, Dr. Tony Pawson for providing mouse Ephb2 cDNA, Dr. Martine Roussel for the PCX4-IRES-RFP virus, Drs. Downing and Relling for access to 500K SNP profiles of normal human DNA, and the staff of the Hartwell center for Bioinformatics and Biotechnology, Vector Production Core, ARC, AIC and Cell and Tissue Imaging at St Jude Children’s Research Hospital for technical assistance.
Footnotes
Author Contributions. R. Gilbertson, R. Grundy, and M. Taylor, conceived the research and planned experiments. R. Johnson and K. Wright, also planned and conducted the great majority of the experiments under the direction of R. Gilbertson. A. Gajjar, Y. Gillespie, J. Allen, M. Taylor, and R. Grundy, provided human tumor material. All authors contributed experimental expertise and participated in the writing of the manuscript. D. Finklestein, S. Pounds, Y-D. Wang and G. Neale, provided bioinformatic expertise. D. Ellison. provided pathology review and iFISH analysis.
Supplementary Information
Supplemental Information is available online.
Competing interests
None
References
- 1.Parsons DW, et al. An integrated genomic analysis of human glioblastoma multiforme. Science. 2008;321:1807–1812. doi: 10.1126/science.1164382. [DOI] [PMC free article] [PubMed] [Google Scholar]
- 2.Stommel JM, et al. Coactivation of receptor tyrosine kinases affects the response of tumor cells to targeted therapies. Science. 2007;318:287–290. doi: 10.1126/science.1142946. [DOI] [PubMed] [Google Scholar]
- 3.TCGA Comprehensive genomic characterization defines human glioblastoma genes and core pathways. Nature. 2008;455:1061–1068. doi: 10.1038/nature07385. [DOI] [PMC free article] [PubMed] [Google Scholar]
- 4.Kleihues P, et al. The WHO classification of tumors of the nervous system. J Neuropathol Exp Neurol. 2002;61:215–225. doi: 10.1093/jnen/61.3.215. discussion 226-219. [DOI] [PubMed] [Google Scholar]
- 5.Merchant TE, et al. Conformal radiotherapy after surgery for paediatric ependymoma: a prospective study. Lancet Oncol. 2009;10:258–266. doi: 10.1016/S1470-2045(08)70342-5. [DOI] [PMC free article] [PubMed] [Google Scholar]
- 6.Modena P, et al. Identification of tumor-specific molecular signatures in intracranial ependymoma and association with clinical characteristics. J Clin Oncol. 2006;24:5223–5233. doi: 10.1200/JCO.2006.06.3701. [DOI] [PubMed] [Google Scholar]
- 7.Taylor MD, et al. Radial glia cells are candidate stem cells of ependymoma. Cancer Cell. 2005;8:323–335. doi: 10.1016/j.ccr.2005.09.001. [DOI] [PubMed] [Google Scholar]
- 8.Puget S, et al. Candidate genes on chromosome 9q33-34 involved in the progression of childhood ependymomas. J Clin Oncol. 2009;27:1884–1892. doi: 10.1200/JCO.2007.15.4195. [DOI] [PubMed] [Google Scholar]
- 9.Diskin SJ, et al. Copy number variation at 1q21.1 associated with neuroblastoma. Nature. 2009;459:987–991. doi: 10.1038/nature08035. [DOI] [PMC free article] [PubMed] [Google Scholar]
- 10.Dejosez M, et al. Ronin is essential for embryogenesis and the pluripotency of mouse embryonic stem cells. Cell. 2008;133:1162–1174. doi: 10.1016/j.cell.2008.05.047. [DOI] [PMC free article] [PubMed] [Google Scholar]
- 11.Nakano I, et al. Phosphoserine phosphatase is expressed in the neural stem cell niche and regulates neural stem and progenitor cell proliferation. Stem Cells. 2007;25:1975–1984. doi: 10.1634/stemcells.2007-0046. [DOI] [PubMed] [Google Scholar]
- 12.Kayser MS, Nolt MJ, Dalva MB. EphB receptors couple dendritic filopodia motility to synapse formation. Neuron. 2008;59:56–69. doi: 10.1016/j.neuron.2008.05.007. [DOI] [PMC free article] [PubMed] [Google Scholar]
- 13.Chess A. Monoallelic expression of protocadherin genes. Nat Genet. 2005;37:120–121. doi: 10.1038/ng0205-120. [DOI] [PubMed] [Google Scholar]
- 14.Cueni L, et al. T-type Ca2+ channels, SK2 channels and SERCAs gate sleep-related oscillations in thalamic dendrites. Nat Neurosci. 2008;11:683–692. doi: 10.1038/nn.2124. [DOI] [PubMed] [Google Scholar]
- 15.Gogolla N, et al. Wnt signaling mediates experience-related regulation of synapse numbers and mossy fiber connectivities in the adult hippocampus. Neuron. 2009;62:510–525. doi: 10.1016/j.neuron.2009.04.022. [DOI] [PubMed] [Google Scholar]
- 16.Geppert M, et al. The small GTP-binding protein Rab3A regulates a late step in synaptic vesicle fusion. Nature. 1997;387:810–814. doi: 10.1038/42954. [DOI] [PubMed] [Google Scholar]
- 17.Taraska JW, Almers W. Bilayers merge even when exocytosis is transient. Proc Natl Acad Sci U S A. 2004;101:8780–8785. doi: 10.1073/pnas.0401316101. [DOI] [PMC free article] [PubMed] [Google Scholar]
- 18.Dahlhaus M, et al. Notch1 signaling in pyramidal neurons regulates synaptic connectivity and experience-dependent modifications of acuity in the visual cortex. J Neurosci. 2008;28:10794–10802. doi: 10.1523/JNEUROSCI.1348-08.2008. [DOI] [PMC free article] [PubMed] [Google Scholar]
- 19.Kriegstein A, Alvarez-Buylla A. The Glial Nature of Embryonic and Adult Neural Stem Cells. Annu Rev Neurosci. 2009;32:149–184. doi: 10.1146/annurev.neuro.051508.135600. [DOI] [PMC free article] [PubMed] [Google Scholar]
- 20.Merkle FT, et al. Radial glia give rise to adult neural stem cells in the subventricular zone. Proc Natl Acad Sci U S A. 2004;101:17528–17532. doi: 10.1073/pnas.0407893101. Epub 12004 Dec 17521. [DOI] [PMC free article] [PubMed] [Google Scholar]
- 21.Kriegstein AR, Gotz M. Radial glia diversity: a matter of cell fate. Glia. 2003;43:37–43. doi: 10.1002/glia.10250. [DOI] [PubMed] [Google Scholar]
- 22.Anthony TE, et al. Brain lipid-binding protein is a direct target of Notch signaling in radial glial cells. Genes Dev. 2005;19:1028–1033. doi: 10.1101/gad.1302105. [DOI] [PMC free article] [PubMed] [Google Scholar]
- 23.Gong S, et al. A gene expression atlas of the central nervous system based on bacterial artificial chromosomes. Nature. 2003;425:917. doi: 10.1038/nature02033. [DOI] [PubMed] [Google Scholar]
- 24.Schmid RS, Yokota Y, Anton ES. Generation and characterization of brain lipid-binding protein promoter-based transgenic mouse models for the study of radial glia. Glia. 2006;53:345–351. doi: 10.1002/glia.20274. [DOI] [PubMed] [Google Scholar]
- 25.Molofsky AV, et al. Increasing p16INK4a expression decreases forebrain progenitors and neurogenesis during ageing. Nature. 2006;443:448–452. doi: 10.1038/nature05091. [DOI] [PMC free article] [PubMed] [Google Scholar]
- 26.McGuire CS, Sainani KL, Fisher PG. Incidence patterns for ependymoma: a surveillance, epidemiology, and end results study. J Neurosurg. 2009;110:725–729. doi: 10.3171/2008.9.JNS08117. [DOI] [PubMed] [Google Scholar]
- 27.Genander M, et al. Dissociation of EphB2 signaling pathways mediating progenitor cell proliferation and tumor suppression. Cell. 2009;139:679–692. doi: 10.1016/j.cell.2009.08.048. [DOI] [PMC free article] [PubMed] [Google Scholar]
- 28.Rousseau E, et al. Trisomy 19 ependymoma, a newly recognized genetico-histological association, including clear cell ependymoma. Mol Cancer. 2007;6:47. doi: 10.1186/1476-4598-6-47. [DOI] [PMC free article] [PubMed] [Google Scholar]
- 29.Phillips HS, et al. Molecular subclasses of high-grade glioma predict prognosis, delineate a pattern of disease progression, and resemble stages in neurogenesis. Cancer Cell. 2006;9:157–173. doi: 10.1016/j.ccr.2006.02.019. [DOI] [PubMed] [Google Scholar]
- 30.Thompson MC, et al. Genomics identifies medulloblastoma subgroups that are enriched for specific genetic alterations. J Clin Oncol. 2006;24:1924–1931. doi: 10.1200/JCO.2005.04.4974. Epub 2006 Mar 1927. [DOI] [PubMed] [Google Scholar]
Associated Data
This section collects any data citations, data availability statements, or supplementary materials included in this article.


