

Abstract
The membrane conductance of a pyramidal neuron in vivo is substantially increased by background synaptic input. Increased membrane conductance, or shunting, does not simply reduce neuronal excitability. Recordings from hippocampal pyramidal neurons using dynamic clamp revealed that adaptation caused complete cessation of spiking in the high conductance state, whereas repetitive spiking could persist despite adaptation in the low conductance state. This behavior was reproduced in a phase plane model and was explained by a shunting-induced increase in voltage threshold. The increase in threshold allows greater activation of the M current (I M) at subthreshold potentials and reduces the minimum adaptation required to stabilize the system; in contrast, activation of the afterhyperpolarization current is unaffected by the increase in threshold and therefore remains unable to stop repetitive spiking. The nonlinear interaction between shunting and I M has other important consequences. First, timing of spikes elicited by brief stimuli is more precise when background spikes elicited by sustained input are prohibited, as occurs exclusively with I M-mediated adaptation in the high conductance state. Second, activation of I M at subthreshold potentials, which is increased in the high conductance state, hyperpolarizes average membrane potential away from voltage threshold, allowing only large, rapid fluctuations to reach threshold and elicit spikes. These results suggest that the shift from a low to high conductance state in a pyramidal neuron is accompanied by a switch from encoding time-averaged input with firing rate to encoding transient inputs with precisely timed spikes, in effect, switching the operational mode from integration to coincidence detection.
Keywords: AHP current, coincidence detector, integrator, M current, membrane conductance, spike-time precision
Introduction
Under in vivo conditions, the background synaptic activity experienced by pyramidal neurons can dramatically increase total membrane conductance. On its own, this conductance may not cause much current flow because the associated reversal potential is near resting potential, but the increase in membrane conductance affects how the neuron responds to other inputs. Input resistance (R in) may drop by as much as 80% and is accompanied by shortening of both the membrane time constant (τmembrane) and length constant (Bernander et al., 1991; Paré et al., 1998; Destexhe and Paré, 1999). These changes have profound effects on the spatiotemporal integration of synaptic inputs (Destexhe et al., 2003; Shu et al., 2003; Rudolph and Destexhe, 2003). An increase in membrane conductance, or shunting, can also influence the capacity of neurons to spike repetitively during sustained stimulation; for example, damage caused by impalement with a sharp electrode can introduce a leak conductance (Staley et al., 1992) that results in the neuron firing few if any spikes during prolonged current injection, whereas the same neuron may fire repetitively if not damaged (Alger et al., 1984).
Spike frequency adaptation is another process that modulates repetitive spiking and refers to the reduction of firing rate during sustained stimulation. Strength of adaptation varies among pyramidal neurons (Barkai and Hasselmo, 1994) and can itself be modulated (Nicoll, 1988). Within pyramidal neurons, adaptation can be mediated by slow, voltage-sensitive potassium currents [e.g., M current (I M)], by calcium-sensitive potassium currents [e.g., afterhyperpolarization current (I AHP)], or by a combination of both (Madison and Nicoll, 1984; Storm, 1990; Sah and Davies, 2000; Gu et al., 2005). Although I M and I AHP are quite distinct in terms of their basis for activation, their effects are often considered equivalent insofar as they both reduce firing rate once activated. Data presented here challenge that view, showing that the difference in activation requirements has important consequences for the outcome of adaptation, specifically whether adaptation prevents repetitive spiking or simply reduces its rate, which in turn has implications for other response properties such as spike-time precision.
If both shunting and adaptation modulate repetitive firing, the question arises as to how those two mechanisms interact. Experimental data from CA1 pyramidal neurons revealed that they do indeed interact and that they do so in a nonlinear manner. To investigate that interaction, we developed a simplified phase plane model that reproduced the experimental data. Phase plane analysis facilitates the visualization of complex dynamical problems and, in that regard, has been particularly useful for investigating neuronal excitability (FitzHugh, 1961, 1969; Rinzel, 1985; Rinzel and Ermentrout, 1998; Izhikevich, 2000). This approach was used here to demonstrate how changes in membrane conductance influence the induction and outcome of adaptation, depending on the activation properties of the underlying current. Additional investigation revealed this nonlinear interaction between shunting and adaptation to have important consequences for whether a pyramidal neuron encodes inputs as an integrator or as a coincidence detector.
Materials and Methods
Electrophysiology.
All experiments were done in accordance with regulations of the Canadian Council on Animal Care. Adult male Sprague Dawley rats (>40 d old) were anesthetized with intraperitoneal injection of sodium pentobarbital (30 mg/kg) and perfused intracardially with ice-cold oxygenated (95% O2 and 5% CO2) sucrose-substituted artificial CSF (ACSF) containing the following (in mm): 252 sucrose, 2.5 KCl, 2 CaCl2, 2 MgCl2, 10 glucose, 26 NaHCO3, 1.25 NaH2PO4, and 5 kynurenic acid. The brain was rapidly removed and sectioned coronally to produce 400-μm-thick slices. Slices were kept in normal oxygenated ACSF (126 mm NaCl instead of sucrose and without kynurenic acid) at room temperature until recording.
Slices were transferred to a recording chamber constantly perfused with oxygenated (95% O2 and 5% CO2) ACSF heated to between 30 and 31°C. The slice was viewed with a modified Zeiss (Oberkochen, Germany) Axioplan2 microscope. Pyramidal neurons in the CA1 region of hippocampus were targeted for patching and were recorded from in the whole-cell configuration with >80% series resistance compensation using an Axopatch 200B amplifier (Molecular Devices, Palo Alto, CA). Recording pipettes with Sylgard-coated shanks were filled with an intracellular solution composed of the following (in mm): 135 KMeSO4, 5 KCl, 10 HEPES, and 2 MgCl2, 4 ATP (Sigma, St. Louis, MO), 0.4 GTP (Sigma), as well as 0.1% Lucifer yellow; pH was adjusted to 7.2 with KOH. Intracellular Ca2+ was left deliberately unbuffered so as to not to disturb currents mediating adaptation (Marrion et al., 1991; Schwindt et al., 1992; Staley et al., 1992; Zhang et al., 1994). After recording, pyramidal morphology was confirmed using epifluorescence to visualize intracellular labeling with Lucifer yellow.
Reported values of membrane potential (V) were corrected for liquid junction potential. Neurons were judged healthy on the basis of three criteria: resting V < −50 mV, spikes overshooting 0 mV, and R in > 100 MΩ. Variation in resting V was eliminated by adjusting V in all cells to −70 mV through tonic injection of current. Access resistance was monitored during recording, and testing was discontinued if it rose unrecoverably above 15 MΩ. All experiments were performed in 10 μm bicuculline methiodide (Research Biochemicals, Natick, MA), 10 μm CNQX, and 40 μm d-AP-5 (Tocris Cookson, Bristol, UK) to block background synaptic activity. Neurons were excited by injecting 15-s-long current steps (I DC) through the recording pipette.
Membrane conductance of the recorded neuron was manipulated through the dynamic-clamp technique (Sharp et al., 1993) using a Digidata 1200A analog-to-digital converter board (Molecular Devices) and DynClamp2 software (Pinto et al., 2001) running on a dedicated processor. Update rate was 10 kHz. Shunting was simulated as a constant conductance (g shunt) with a reversal potential of −70 mV. The effect of different conductance levels was quantified in each neuron by measuring R in based on a series of hyperpolarizing current pulses, and τmembrane was determined (from the same responses used to calculate R in) as the slowest time constant from exponential curve fits.
Traces were low-passed filtered at 4 kHz and stored on videotape using a digital data recorder (VR-10B; InstruTech, Port Washington, NY). Recordings were sampled off-line at 10 kHz on a computer using Strathclyde Electrophysiology software (J. Dempster, Department of Physiology and Pharmacology, University of Strathclyde, Glasgow, UK) and analyzed using locally designed software (Y. De Koninck).
Simulations.
Phase plane and bifurcation analyses were performed according to standard procedures. Good introductions to these methods are provided by Strogatz (1998) and by Rinzel and Ermentrout (1998). Briefly, phase plane analysis involves plotting the variables of the system relative to each other. Nullclines represent the area in phase space in which a given variable remains constant. How these different nullclines intersect (i.e., whether the intersection is stable or unstable) will determine whether the system evolves toward a fixed point or toward a limit cycle, which, in the case of a neuron, typically corresponds to quiescence or repetitive spiking. In bifurcation analysis, a parameter is systematically varied to determine under what conditions the behavior of the system qualitatively changes (i.e., spiking starts or stops), which corresponds to a bifurcation.
The phase plane model was based on the Morris–Lecar model (Morris and Lecar, 1981; Rinzel and Ermentrout, 1998), described by the following equations:
 |
Equations were integrated numerically in XPPAUT (Ermentrout, 2002) using the Euler method with a time step of 0.1 ms. Parameters were found by systematically varying them to recreate critical response characteristics in the model neuron, most notably, the sensitivity of repetitive spiking to membrane conductance. They were as follows: C = 2 μF/cm2, ḡ Na = 20 mS/cm2, E Na = 50 mV, ḡ K = 20 mS/cm2, E K = −100 mV, E shunt= −70 mV, φ = 0.15, V 1 = −1.2 mV, V 2 = 23 mV, V 3 = −2 mV, and V 4 = 21 mV. The above parameters give rise to type II excitability; the model was also tested with V 3 = 10 mV to confirm results in a model with type I excitability (for explanation of type I and II excitability, see Results). To modulate membrane conductance, g shunt was varied between 2 and 5.3 mS/cm2. DC stimulus intensity was controlled by I DC and was adjusted to compensate for the decreased excitability caused by shunting, thereby facilitating comparison of responses across conductance levels.
Two variations of adaptation were tested, both based on the formalism described by Ermentrout (1998) (Eq. 3). Parameters for the M current (I M) were ḡ adapt = ḡ M = 2 mS/cm2, α = 0.005, β = −35 mV, and γ = 5 mV. Parameters for a calcium-activated potassium current (I AHP) were ḡ adapt = ḡ AHP = 15 mS/cm2, α = 0.005, β = 0 mV, and γ = 5 mV. The important difference is voltage at half-maximal activation (controlled by β), which when set to 0 mV, ensures that adaptation is induced only during spikes (for I AHP), whereas when set to −35 mV, allows adaptation to be induced at subthreshold voltages (for I M). The value of ḡ adapt was adjusted so that steady-state firing rate in response to constant stimulation in the low conductance state was approximately equal for both types of adaptation.
Although voltage oscillations similar to those seen experimentally could be observed in the model neuron using the parameters described above, a small amount of noise was introduced to make these oscillations less regular and therefore more in accordance with electrophysiological data. I noise is considered to represent intrinsic noise sources and was modeled as an Ornstein–Uhlenbeck process (Uhlenbeck and Ornstein, 1930),
where N(0,1) is a number drawn from a Gaussian distribution with average 0 and unit variance, which is then adjusted according to size of the time step (Destexhe et al., 2001). Noise amplitude was controlled by a scaling factor, σnoise; τnoise = 5 ms and σnoise = 0.5 μA/cm2. I noise was removed from the model neuron when investigating bifurcation patterns.
In one set of simulations investigating spike-time precision, a 20-ms-long current step was superimposed on the DC stimulus. Latency to spike from the onset of stimulation was measured, and the cumulative distribution of latencies was compared between conditions using the Kolmogorov–Smirnov test. Width of the latency distribution can be equated with the reciprocal of spike-time precision. In a separate set of simulations, the model neuron was stimulated with a dynamic input signal, I signal, that was generated through an Ornstein–Uhlenbeck process. Unlike I noise, which varied with each trial, I signal was recorded on one trial and replayed on all subsequent trials, such that the signal represents “frozen noise.” τsignal = 5 ms and σsignal was varied. Spike-time precision was calculated using the correlation-based method described by Schreiber et al. (2003). Briefly, each spike train was convolved with a Gaussian filter (σfilter = 0.5 ms) and were then correlated pairwise by taking the inner product followed by normalization. Each spike train was generated by a 5-s-long stimulus in which the first 500 ms, during which adaptation develops, was excluded from analysis. Based on 10 trials in each condition, the final precision metric was based on measurements averaged across 45 pairwise correlations.
Results
Experimental observations in CA1 pyramidal neurons
In the six CA1 pyramidal neurons on which subsequent analysis is based, application of a 10 nS shunt by dynamic clamp reduced average R in from 158.5 ± 9.4 to 69.7 ± 9.4 MΩ (p < 0.001, paired t test). This equates with a 56% drop in R in, which conservatively approximates conditions in vivo (Destexhe and Paré, 1999). The decrease in R in was accompanied by a 56% reduction in τmembrane and caused a predictable reduction in excitability. For the cell illustrated in Figure 1 A, ∼160 pA greater stimulation was necessary to achieve the same initial firing rate (calculated from the first interspike interval) in the high conductance state compared with initial firing in the low conductance state (Fig. 1 B). Despite compensating for decreased excitability by increasing stimulus intensity to elicit the same initial firing rate, the number of spikes in the initial burst was consistently fewer in the high conductance state compared with the number of spikes in the low conductance state (Fig. 1 C), and spiking after the initial burst was abolished in the high conductance state, whereas slow repetitive spiking persisted in the low conductance state (Fig. 1 D). These observations demonstrate that simply increasing stimulus intensity cannot fully compensate for the effects of shunting.
Figure 1.

Shunting modulates the outcome of adaptation in hippocampal CA1 pyramidal neurons. A, Sample responses to constant stimulation in a low and high conductance state (left and right traces, respectively). Horizontally aligned traces show responses with equivalent initial firing rate (based on reciprocal of first interspike interval). Stimulus intensity is indicated beside each trace. Despite increasing stimulus intensity to elicit the same initial firing rate in the low and high conductance states, the initial burst was shorter and repetitive spiking was completely abolished in the high conductance state. B, Based on the same cell illustrated in A, shunting caused a rightward shift in the f initial –I DC curve. C, Shunting also reduced the number of spikes in the initial burst. D, Whereas slow, repetitive spiking could persist after adaptation in the low conductance state, repetitive spiking was absent after adaptation in the high conductance state. E, Plotting initial firing rate against other response measures removes the direct effect of shunting on excitability and helps isolate how shunting influences the outcome of adaptation. For E and F, top graphs show data for cell illustrated in A and bottom graphs show cumulative data (n = 6 neurons, with 4–5 measurements per neuron for each condition). Lines in bottom graphs show linear regressions (low conductance, black line; high conductance, gray line). After accounting for variation in f initial, there were significantly fewer spikes within the initial burst in the high conductance state compared with the low conductance state (p < 0.001, ANOVA). F, Steady-state firing rate was also significantly lower in the high conductance state compared with the low conductance state (p < 0.001, Kruskal–Wallis test).
Because burst duration and steady-state firing rate are both modulated by adaptation, the above data suggested that shunting and adaptation interact to determine the spiking response. Moreover, this interaction must be nonlinear because even extremely strong stimulation cannot cause the shunted neuron to fire repetitively (Fig. 1 A), thereby disproving that effects of adaptation and shunting are simply additive. To isolate how shunting influences adaptation, the direct effects of shunting on excitability were removed by plotting burst duration and steady-state firing rate against initial firing rate (Fig. 1 E,F, respectively) rather than against stimulus intensity (as in Fig. 1 C,D). After accounting for variation in initial firing rate, the initial burst was significantly shorter in the high conductance state (p < 0.001, ANOVA) (Fig. 1 E), and steady-state firing rate was significantly lower in the high conductance state (p < 0.001, Kruskal–Wallis test) (Fig. 1 F).
Influence of shunting on adaptation can be reproduced in a phase plane model
To investigate the nonlinear interaction between shunting and adaptation, we developed a phase plane model with I M-mediated adaptation (Fig. 2) that reproduced the experimental data in Figure 1. The experimental data could not be reproduced in a comparable model neuron with I AHP-mediated adaptation (see below). Sample responses from the model neuron with I M are shown in Figure 2 A. As observed in real CA1 pyramidal neurons, shunting caused a rightward shift in the f initial –I DC curve (Fig. 2 B), shortened the initial burst of spikes (Fig. 2 C), and prevented steady-state firing (Fig. 2 D) in the model neuron. The same interaction between shunting and adaptation was observed when the reversal for the leak conductance was shifted to more depolarized values (data not shown). Analysis of the model revealed that repetitive spiking was generated through a subcritical Hopf bifurcation in both the low and high conductance states (Fig. 2 E) (for review of bifurcations in the context of neuronal excitability, see Rinzel and Ermentrout, 1998). Shunting did not therefore cause a qualitative change in the mechanism through which spikes were generated, but the values of I DC and V at which the bifurcation occurred (referred to as I ∗ and V ∗, which correspond to rheobase and voltage threshold, respectively) did change. Because the change in I ∗ confers reduced excitability that can be overcome with increased stimulation, we investigated whether the change in V ∗ underlies the effects of shunting on adaptation.
Figure 2.

A modified Morris–Lecar model with I M-mediated adaptation can reproduce the influence of shunting on repetitive spiking. A, Sample responses from the model neuron in the low and high conductance states (left and right traces, respectively). Horizontally aligned traces show responses with equivalent initial firing rate. Stimulus intensity is indicated beside each trace. As in real pyramidal neurons, the initial burst was shorter and repetitive spiking was absent in the high conductance state. B, Shunting caused a rightward shift in the f initial –I DC curve. C, It also reduced the number of spikes in the initial burst. D, Shunting also completely abolished steady-state spiking over the range of stimulus intensities tested here, although repetitive spiking could be achieved with much stronger stimulation (see Fig. 3 E). E, Bifurcation diagrams show that, regardless of membrane conductance, repetitive spiking was generated through a subcritical Hopf bifurcation in the w–V phase plane (see Figs. 3 B, 4 B). In this and all subsequent bifurcation diagrams, limit cycles are represented by plotting the maximum and minimum, during the limit cycle, of the variable plotted on the ordinate, which explains why these curves each have two branches. In the low conductance state, the bifurcation occurred at I DC = I ∗ = 25.4 μA/cm2 and V = V ∗ = −46.5 mV. Those values increased to I ∗ = 98.8 μA/cm2 and V ∗ = −37.8 mV in the high conductance state. Bifurcation diagrams were generated with adaptation removed from the model neuron to characterize spike generation before adaptation; if adaptation were left in the model, the bifurcation would not occur until adaptation failed to prevent repetitive spiking (see Figs. 3 E, 4 E). F, Responses in the low and high conductance states are essentially the same in a model neuron with type I excitability (shown here) as in a model neuron with type II excitability (A).
The results above are from a model neuron exhibiting type II excitability. To demonstrate the generality of our findings before proceeding with more detailed analysis, we also tested a model neuron exhibiting type I excitability. Type I and II excitability are distinguishable on the basis of the f–I curve (continuous vs discontinuous near 0 Hz, respectively, based on ability of the neuron to spike slowly in response to just-suprathreshold stimulation) (Hodgkin, 1948) and the type of bifurcation associated with generation of repetitive spiking (saddle-node vs Hopf, respectively) (Rinzel and Ermentrout, 1998). Sample responses from a neuron model with type I excitability (Fig. 2 F) demonstrate that the interaction between shunting and I M-mediated adaptation has the same consequences in type I and II neurons (other data not shown). Notably, I AHP-mediated adaptation failed to reproduce the experimental data in type I neurons (data not shown), just as it did in type II neurons (see below).
Phase plane and bifurcation analyses of the interaction between shunting and adaptation
Adaptation is an intrinsic, negative feedback process that reduces firing rate via an outward, transmembrane current whose induction is dependent on voltage in the case of I M (Storm, 1990) or on intracellular calcium in the case of I AHP (Sah and Davies, 2000). In the latter case, a calcium current need not be explicitly modeled if the activation curve for I AHP (relative to voltage) is adjusted so that activation occurs exclusively during the spike (i.e., the same conditions under which calcium influx through high-voltage-activated calcium channels would occur and activate I AHP). Adaptation mediated by I M is considered first, followed by comparison of those results with adaptation mediated by I AHP.
Figure 3 A shows how the model neuron responds in the low and high conductance states (left and right, respectively). The dynamics are based on the interaction between three variables: voltage (V), activation of the delayed rectifier current (w), and activation of adaptation (z). Dynamics are plotted in three dimensions, but, to help visualization, the response is also projected onto the w–V and z–V planes (Fig. 3 B). The onset and offset of spiking occurs through a Hopf bifurcation evident in the w–V phase plane (see also Fig. 2 E): I DC shifts the V nullcline upward, causing the system to go forward through the Hopf bifurcation (repetitive spiking starts), whereas I M shifts the V nullcline downward, causing the system to go backward through the Hopf bifurcation if I M is sufficiently strong (repetitive spiking stops). The Hopf bifurcation occurs when the fixed point, which is stable when the V and w nullclines intersect at V < V ∗ (where V ∗ corresponds to voltage at the trough of the V nullcline), becomes unstable when the nullclines intersect at V > V ∗; stability is determined from the eigenvalues found by local stability analysis near the fixed point. The same bifurcation occurs in both the low and high conductance states (Fig. 3 B, compare left and right). Therefore, whether the neuron continues to spike despite adaptation results from whether I M is sufficiently strong to cause the reverse bifurcation, i.e., does z increase and remain high enough to sustain sufficient adaptation?
Figure 3.

Effects of membrane conductance on repetitive spiking result from a nonlinear interaction between shunting and I M-mediated adaptation. A, Sample responses in the model neuron for low and high conductance states (left and right traces, with I DC = 40 and 110 μA/cm2, respectively). Voltage (V), activation of the delayed rectifier current (w), and activation of adaptation (z) are plotted against time. Colored lines indicate times at which nullclines in B are calculated (see below). In the low conductance state, z decreases after the initial burst and only increases incrementally with each spike; in the high conductance state, z continues to increase after the initial burst in the absence of co-occurring spikes (arrow; see also arrows in B and D). B, The three-dimensional phase portrait (left panel of each set of three graphs) shows the evolution of each variable relative to the other two variables. The response is projected onto the w–V and z–V planes to assist visualization; the z–w plane adds no additional information and is not shown. Nullclines were calculated at three time points indicated by colored lines in A: before stimulation (red), at the onset of stimulation before adaptation develops (blue), and after adaptation (green). Values of w and z were frozen at the indicated values each time the V nullcline was calculated, and so on for each w and z nullcline. Nullclines were not replotted if they did not change from one time point to the next. Solid line represents the nullcline for the variable plotted on the abscissa; dashed line represents the nullcline for the variable plotted on the ordinate. Spike generation results from the interaction between V and w, whereas control of adaptation can be understood by the interaction between V and z. In both the w–V and z–V phase planes, excitatory I DC shifts the V nullcline upward, whereas I M shifts it downward. An increase in membrane conductance shifts the V nullcline to the right, which corresponds to an increase in V ∗ (purple line). The increase in V ∗ has two effects (see also C): first, it allows the same I DC to cause a greater increase in z (based on where the blue V nullcline and z nullcline intersect); second, the resulting increase in activation of I M stabilizes the system at a subthreshold potential (based on where the green V nullcline and z nullcline intersect). This last point can be seen most clearly in the insets, which show enlarged views of the phase space indicated by the orange arrowhead in the main graph: in the low conductance state, the adapted (green) V nullcline and z nullcline intersect to the right of V ∗, meaning that the intersection point is unstable (arrowhead labeled u) and repetitive spiking continues, whereas in the high conductance state, those nullclines intersect to the left of V ∗, meaning that the intersection point is stable (arrowhead labeled s) and I M will maintain voltage below threshold. C, By reducing the model to two dimensions and treating z as a parameter instead of a variable, bifurcation diagrams show the minimum z required to stabilize the system (z required) and stop repetitive firing; z required = 0.12 and 0.08 for the low and high conductance states, respectively. Insets show activation curves for adaptation, which, compared with V ∗, show the maximum z achievable at subthreshold potentials (z max, blue line); z max = 0.09 and 0.37 for the low and high conductance states, respectively. The increase in z max and the decrease in z required associated with an increase in V ∗ confirms the observations made in B. Consequently, z max < z required in the low conductance state, whereas z max > z required (yellow region) in the high conductance state; the latter condition is required to stabilize voltage below threshold and terminate repetitive spiking. The same conclusion is found by superimposing the activation curve for adaptation (gray) onto the bifurcation diagram: in the low conductance state, the curve intersects the fixed point in a region of instability (dotted black line), meaning that repetitive firing persists; in the high conductance state, the curve intersects the fixed point in a stable region (solid black line), meaning that repetitive firing stops. D, Superimposing the z–V trajectory from B (green curve) onto the bifurcation diagrams from C illustrates how system tracks along the stable limit cycle at the onset of stimulation, with z increasing during each spike until it exceeds the bifurcation point. Behavior beyond this point depends on membrane conductance. In the low conductance state, spiking is transiently replaced by subthreshold voltage fluctuations, during which time z decreases (red arrow in inset) until another spike is generated (orange arrow), and so on. Conversely, in the high conductance state, z continues to increase after the termination of spiking. Stimulus intensity (I DC) was equivalent in A–D. E, Bifurcation diagrams here show changes in z as I DC is increased. In the low conductance state, there are four regions: subthreshold (region i), no repetitive firing after adaptation (ii), repetitive firing that is irregular (iiia), or regular (iiib) after adaptation. In the high conductance state, region iiia is missing. The absolute size of region ii increased in the high conductance state, but its size relative to region i remained almost unchanged at 56% in the high conductance state compared with 52% in the low conductance state. The relative size of region ii can, however, increase dramatically depending on adaptation parameters (see Results and Fig. 5).
The next step, therefore, is to consider how z changes over the course of the response. During stimulation in the low conductance state, z increased incrementally with each spike and decayed between spikes (Fig. 3 A, left), whereas with stimulation causing the same initial firing rate in the high conductance state, z was able to increase without co-occurring spikes (Fig. 3 A, right). This observation is key and can be explained in the z–V phase plane of Figure 3 B. As for the w–V phase plane described above, the intersection between the z and V nullclines is stable if they intersect at V < V ∗, whereas the intersection is unstable if the nullclines intersect at V > V ∗. However, whereas the w–V phase plane explains the generation of spikes, the z–V phase plane explains the control of adaptation. We return to the question posed above: does z increase and remain high enough to sustain sufficient adaptation? In the low conductance state, the adapted V nullcline (solid green line in the z–V phase plane) intersects the z nullcline at V > V ∗ (Fig. 3 B, left), meaning that z is not sufficient to stabilize V at a subthreshold value and repetitive spiking continues. In the high conductance state, conversely, the adapted V nullcline intersects the z nullcline at V < V ∗, meaning that z is sufficient to stabilize V at a subthreshold value and repetitive spiking stops. One must understand that stabilization of V in the z–V phase plane determines whether V is able to change in the w–V phase plane (i.e., whether spiking can occur).
In terms of the z–V phase plane, the difference between the low and high conductance state is reflected by the horizontal positioning of the V nullcline relative to the z nullcline. The rightward shift of the V nullcline, which corresponds to the increase in V ∗ caused by shunting (Fig. 2 E), has two consequences: the stimulus-induced upward shift in the V nullcline causes a greater increase in z (i.e., greater activation of adaptation), and stabilization of the system at V < V ∗ requires a smaller downward shift in the V nullcline (i.e., smaller value of I adapt). Maintenance of the stable state requires that I adapt remain strong enough to counterbalance I DC so that V remains below V ∗, which necessarily requires maintained activation of adaptation at subthreshold potentials.
By recognizing the above requirement, we can simplify the problem by breaking it into parts. What is the minimum z required (z required) to sustain sufficient I adapt to force the system back through the Hopf bifurcation and thereby terminate repetitive spiking? What is the maximum z (z max) that can be achieved at a subthreshold potential? If z max > z required, adaptation will be able to prevent repetitive spiking. If z max < z required, repetitive spiking will continue despite adaptation. To investigate these questions in the model neuron, we reduced the model from three dimensions to two dimensions by treating z as a parameter rather than as an intrinsically controlled variable. By comparing z max measured from the activation curve for adaptation with z required measured from the bifurcation diagram generated by systematically varying z, Figure 3 C confirms that z max < z required in the low conductance state whereas z max > z required in the high conductance state in this model neuron, in which adaptation is mediated through I M. Superimposing the z–V trajectory onto the bifurcation diagram (Fig. 3 D) shows how the increase in z causes spiking to stop, either permanently, as occurs in the high conductance state in which z continues to increase toward a stable fixed point, or only transiently, as occurs in the low conductance state in which z decreases toward an unstable fixed point until another spike is allowed to be generated.
Bifurcation diagrams in Figure 3 E summarize changes in z and the resulting spiking pattern over a broad range of stimulus intensities. In the low conductance state (left), the fixed point defined by the V and z nullclines becomes unstable at I DC = 38 μA/cm2. Less intense stimulation will either fail to produce a bifurcation, in which case no spiking or a single spike generated independently of a bifurcation occurs (region i; see also Fig. 2 E), or adaptation will be strong enough to reverse the bifurcation, in which case spiking does not persist after the initial burst (region ii). For I DC > 38 μA/cm2, the fixed point destabilizes, allowing repetitive spiking that is either irregular (region iiia) or regular (region iiib) depending on the stability of the limit cycle. In the high conductance state (right), there is no equivalent of region iiia, and, instead, a region of bistability exists in which the stable fixed point and stable limit cycle overlap in region iiib, but the system evolves to the latter because z approaches from below.
In contrast to the model with I M, in which adaptation was able to stop repetitive spiking when membrane conductance was high (see above), I AHP-mediated adaptation was unable to prevent repetitive spiking in either the high or low conductance state (Fig. 4 A). This is explained by the requirements for activating I AHP. I AHP is activated during spikes, with little if any activation at subthreshold potentials. As outlined in Figure 3 C, z max must exceed z required to stop repetitive spiking, and this necessarily requires sustained activation of adaptation at subthreshold potentials.
Figure 4.

Adaptation mediated through I AHP cannot prohibit repetitive firing, regardless of membrane conductance. A, Sample responses in the model neuron for low and high conductance states (left and right traces, with I DC = 40 and 110 μA/cm2, respectively). Voltage (V), activation of the delayed rectifier current (w), and activation of adaptation (z) are plotted against time. Colored lines indicate times at which nullclines in B are calculated. Unlike with I M (see Fig. 3 A), z decreases between each spike and repetitive spiking continues regardless of shunting. B, Phase planes are represented here the same way as in Figure 3 B. The rightward shift in the z nullcline for I AHP (compare with the z nullcline associated with I M in Fig. 3 B) means that no I AHP-mediated adaptation is induced or maintained at subthreshold potentials. Because of this, I AHP is unable to shift the V nullcline down far enough to restabilize the system at V < V ∗ in either the low or high conductance state. Insets show enlarged views of the phase space indicated by the orange arrowhead in main graph. The adapted (green) V nullcline and w nullcline intersect to the right of V ∗, meaning that the intersection point is unstable (arrowhead labeled u) and repetitive spiking continues in both the low and high conductance states. In the z–V phase plane, the fixed point does not switch stability through a Hopf bifurcation (as described above for the w–V phase plane); instead, dynamics are altered by the destruction/creation of a fixed point through a saddle-node bifurcation (unlabeled arrowhead). C, As in Figure 3 C, the model was reduced to two dimensions by treating z as a parameter instead of a variable. Bifurcation diagrams show the minimum z required to stabilize the system (z required) and stop repetitive firing; z required = 0.16 and 0.010 for the low and high conductance states, respectively. Insets show activation curves for I AHP, which, by comparing with V ∗, show the maximum z achievable at subthreshold potentials (z max, blue line); z max = 0.00 for both the low and high conductance states (i.e., adaptation cannot be induced without spike generation). Consequently, z max < z required regardless of membrane conductance, meaning that stabilization cannot be achieved at a subthreshold potential. This is similarly evident by the fact that activation curve of adaptation (gray), when superimposed on the bifurcation diagram, intersects the fixed point in a region of instability (dotted black line) for both the low and high conductance states. D, The z–V trajectory from B (green curve), when superimposed onto the bifurcation diagrams from C, shows that z decreases after the initial burst of spikes, allowing additional spikes to occur intermittently. This is the same behavior seen in the left panel of Figure 3 D and contrasts the behavior seen in the right panel of Figure 3 D. Stimulus intensity (I DC) was equivalent in A–D. E, Bifurcation diagrams here show changes in z as I DC is increased. Region ii (in which adaptation prevents repetitive firing) is completely absent in both the low and high conductance states.
The inability of I AHP to sustain activation at subthreshold potentials is evident in the z–V phase plane in Figure 4 B. Compared with the z nullcline associated with I M, the z nullcline associated with I AHP is shifted to the right (half-maximal activation occurs at 0 mV rather than at −35 mV; see Materials and Methods). The intersection of the z nullcline with the V nullcline is affected in such a way that the stimulus-induced shift in the V nullcline causes stability to be lost through a saddle-node bifurcation rather than through a Hopf bifurcation. This means simply that stability is not lost when the intersection shifts from <V ∗ to >V ∗ but, instead, occurs when two intersection points between the z and V nullclines coalesce and disappear. Notably, the generation and termination of repetitive spiking is still controlled by a Hopf bifurcation in the w–V phase plane.
Following the same approach used to investigate the model with I M, we reduced the model with I AHP to two dimensions and treated z as a parameter rather than as an intrinsically controlled variable. Figure 4 C clearly demonstrates that, regardless of membrane conductance, z max < z required. According to this analysis, I AHP-mediated adaptation is inherently incapable of stopping repetitive firing, which is precisely what is observed in Figure 4 D, in which z invariably decreases between spikes so that repetitive spiking is allowed to persist. Bifurcation diagrams in Figure 4 E summarize changes in z and the resultant spiking pattern over a broad range of I DC. Note that region ii is absent for both the low and high conductance states.
Having explained transitions between subthreshold responses and responses with and without repetitive spiking after the initial burst, we asked how bifurcation patterns observed in the model cell compared quantitatively with bifurcation patterns observed experimentally. Without imposing a shunt through dynamic clamp, four of six CA1 pyramidal neurons switched from a subthreshold response to a response without repetitive spiking before switching to repetitive spiking, in other words, progressing from region i to ii to iii, as stimulus intensity was increased (Fig. 5 A, left). However, two of six neurons switched directly from region i to iii, suggesting that region ii is narrow or absent in certain cases (see below). When a 10 nS shunt was applied to the neurons, region iii was consistently absent and region ii became much wider (Fig. 5 A, right). The experimental bifurcation pattern in the high conductance state is consistent with the actions of I M (compare with bottom rows of Figs. 3 E, 4 E); extrapolation to the low conductance state would therefore argue that region ii is sometimes narrow rather than absent. In other words, some neurons show less tendency to spike repetitively than other neurons (i.e., region ii is narrower in some neurons than in others). Can this variation be accounted for by quantitative changes in model parameters, or does it imply a qualitative difference in the mechanism of adaptation between neurons? Specifically, can the model neuron with I M reproduce the narrowness of region ii in the low conductance state and its substantial widening by increases in membrane conductance?
Figure 5.

The range of bifurcation patterns seen in real pyramidal neurons can be reproduced in the model neuron with I M-mediated adaptation. A, Graphs show stimulus intensity at which CA1 pyramidal neurons changed from a subthreshold response to an initial burst, followed by no repetitive firing (transition from region i → ii, solid line) and from no repetitive firing to repetitive firing (transition from region ii → iii, dashed line) plotted as cumulative probability across the six neurons tested. Labeled regions are defined by the median stimulus intensity at which a transition occurs. In the low conductance state (left), region ii was observed in four of six neurons, but its absence in two neurons suggests that region ii can be extremely narrow (see Results); for purposes of plotting, an intermediate transition through region ii was assumed for transitions from region i to iii. In the high conductance state (right), region ii was consistently wide and region iii was never observed over the range of stimulus intensities tested. B, In the model neuron, region ii can be arbitrarily narrow at one conductance level and dramatically widen as membrane conductance increases. For the bifurcation diagrams shown here, I M-mediated adaptation was adjusted such that ḡ M = 4 mS/cm2 and γ = 2 mV. Repetitive firing predominated in the low conductance state (left), as indicated by the breadth of region iii relative to region ii, whereas repetitive firing was completely abolished in the high conductance state (right), as indicated by the absence of region iii and widening of region ii. This demonstration confirms that the variability between neurons can be accounted for by variation of model parameters within physiologically realistic limits and does not require a qualitative change in mechanism.
For the model neuron with I M, adaptation completely abolished repetitive firing over a fairly broad range of I DC in both the low and high conductance states; region ii was 52 and 56% as wide as region i in Figure 3 E, respectively, which does not account for the experimentally observed widening of region ii. We tried doubling ḡ M, and, although this increased the size of region ii to 150 and 146%, respectively (relative to region i), the increase was approximately equal for both conductance levels. We next tried increasing g shunt to reproduce precisely the relative drop in R in observed experimentally; under these new high conductance conditions, V ∗ was −33.5 mV, but this change alone did not substantially alter the relative size of region ii. We then steepened the activation curve for adaptation by decreasing γ to 2 (Eq. 3) so that little adaptation was induced at V ∗ associated with the low conductance condition, thereby exaggerating the differential activation of adaptation depending on V ∗. Under these new conditions, the size of region ii relative to region i shrunk to only 2% in the low conductance state but expanded to 107% in the high conductance state. Furthermore, combining an increase in ḡ M with a decrease in γ enlarged region ii so much so in the high conductance state that repetitive spiking (region iii) could not occur at physiological stimulus intensities; in contrast, region iii dominated for the same parameters in the low conductance state (Fig. 5 B). This demonstrates that region ii can be arbitrarily narrow for one conductance level and become dramatically wider as membrane conductance increases, confirming that a nonlinear interaction between shunting and I M-mediated adaptation can quantitatively explain the effects of membrane conductance on repetitive spiking, including the experimentally observed variability between neurons.
Shunting-induced increase in voltage threshold
The above data have demonstrated the importance of a shunting-induced increase in voltage threshold. The change in V ∗ occurs within a steep region of the activation curve for I M. This explains the “nonlinear” nature of the interaction between shunting and adaptation: a small change in V ∗ can have a big impact on the activation of I M. Within the model, the increase in V ∗ was identified on the basis of the bifurcation diagrams in Figure 2 E. Here we consider why, in more biophysical terms, membrane conductance influences V ∗ and whether an increase in membrane conductance does indeed increase V ∗ in real pyramidal neurons.
Figure 6 A shows the first two spikes in response to step depolarization of the model neuron in the low and high conductance states. Voltage threshold can be identified as an inflection point when voltage is plotted against time (Fig. 6 A, top traces) and as a local peak when the net transmembrane current (I membrane) is plotted against voltage (Fig. 6 A, bottom traces). In the I membrane –V plots, the first spike is distinct from the second and all subsequent spikes because the delayed rectifier potassium current becomes activated in the latter case and contributes to I membrane, but the horizontal position of the peak (which defines V ∗) does not change. Based on the voltage response preceding the first spike, comparing between the low and high conductance states reveals the effects of shunting on the input resistance of the neuron (Fig. 6 B, black lines). Because the neuron is not purely passive, the I membrane –V curve bends downward as the sodium current is activated. Voltage at the peak of the I membrane –V curve corresponds to the voltage beyond which any subsequent depolarization will increase the magnitude of inward sodium current faster than it will increase the magnitude of the outward leak current. Because the leak current is larger in the high conductance state, greater activation of the sodium current is necessary to increase the inward current sufficiently to counterbalance the larger outward current (Fig. 6 B). Greater activation requires greater depolarization; hence, an increase in membrane conductance logically results in an increase in voltage threshold.
Figure 6.

Explanation and experimental confirmation of a shunting-induced increase in voltage threshold. A, The first two spikes elicited by step depolarization of the model neuron are shown for the low and high conductance states (left and right, respectively). Phases of the action potential are colored differently to help relate the voltage response plotted against time (top row) with the relationship between I membrane and voltage (bottom row). Inset at bottom left shows low-magnification view; arrow represents direction of change in V and I membrane over time. I membrane represents the sum of all transmembrane currents and was calculated from the relationship I membrane = I DC − CdV/dt. Voltage threshold (V ∗) is identifiable as an inflection point in the top row and as a local peak in the bottom row. Adaptation was removed for the analysis shown here, but the shunting-induced shift in V ∗ is unaffected by inclusion of either I M or I AHP in the model (data not shown). B, Overlying the initial responses for the low and high conductance states highlights the change in input resistance caused by shunting (compare black lines). Responses diverge from the black lines at depolarized voltages because of activation of the sodium current. The peak is defined by the voltage at which the inward (sodium) current increases more (because of voltage-dependent activation) than the outward (leak) current increases (because of increased driving force), meaning that depolarization beyond V ∗ causes net I membrane to decrease. The sodium current must activate more in the high conductance state than in the low conductance state (compare lengths of vertical arrows) to counterbalance the leak current and reverse the direction of change in I membrane as voltage increases. Greater sodium current activation requires greater depolarization, explaining why an increase in membrane conductance causes an increase in V ∗. C, For experimental data, V ∗ was estimated from the voltage at which d 2 V/dt 2 (which reflects the first derivative or rate of activation of I membrane) exceeded a cutoff value defined as five times the root-mean-square noise in the baseline d 2 V/dt 2 trace. Using responses to an arbitrarily chosen stimulus intensity of 40 pA greater than rheobase, we analyzed the second spike within each spike train because the second spike occurs before adaptation develops and its analysis is not confounded by initial membrane charging, as can occur with the first spike. Based on those measurements, introduction of a 10 nS shunt caused a significant increase in V ∗ (p < 0.01, paired t test; n = 6) that averaged 2.3 ± 0.5 mV (mean ± SEM).
The shift in threshold caused by shunting is, however, opposite to what one may expect on the basis of the relationship between rate of voltage change and threshold described by Azouz and Gray (2000). Specifically, shunting reduces τmembrane and can thereby accelerate voltage change and potentially reduce threshold. This prediction depends on how threshold is defined: our definition is based on the voltage at which the balance between inward and outward current shifts in favor of inward current that invariably leads to spike generation, whereas Azouz and Gray’s definition is based on voltage at which dV/dt exceeds an arbitrary value. Nonetheless, analysis in Figure 6, A and B, already takes the indirect effect of shunting via modulation of τmembrane into account (because I membrane is calculated as I DC − C dV/dt, where dV/dt will reflect changes in τmembrane). Additional testing in which the model neuron was stimulated with current ramped at different rates confirmed that threshold was consistently higher in the high conductance state (data not shown).
To summarize, experimental data reveal that repetitive spiking in response to sustained input is sensitive to the total membrane conductance of the neuron. Simulation data show that this can be explained by a shunting-induced increase in voltage threshold that enhances the subthreshold activation of I M. For this explanation to apply to real neurons, a shunting-induced increase in voltage threshold should be evident in the experimental data. Indeed, a 10 nS shunt significantly increased voltage threshold by 2.3 ± 0.5 mV (mean ± SEM; p < 0.01, paired t test) (Fig. 6 C).
Impact on spike-time precision and sensitivity to stimulus fluctuations
Whether or not shunting allows adaptation to prohibit repetitive spiking driven by constant input should have important consequences for neuronal encoding. Using the terminology of Gutkin et al. (2003), the prohibition of repetitive spiking through adaptation prevents the neuron from generating spikes as an oscillator, forcing it to generate spikes uniquely as a threshold element. By extension, “background” spikes generated by an oscillating neuron may advance, delay, or prevent spikes evoked by a dynamic signal, meaning that the timing of evoked spikes should be less precise if background spikes driven by DC input are not prevented by adaptation. Thus, timing of spikes evoked by a brief stimulus should be more precise in the high conductance state, in which I M-mediated adaptation effectively prohibits repetitive spiking, compared with timing in the low conductance state, in which adaptation fails to prohibit such spiking.
To test this prediction, we compared spike-time precision in response to a 20-ms-long step depolarization superimposed on a DC offset. The stimulus amplitude was 10% that of the DC offset. Figure 7 A shows spike times for different combinations of shunting and adaptation. Evoked spikes showed the least jitter in the model neuron with I M-mediated adaptation in the high conductance state (bottom left), whereas all other conditions showed examples of background spikes causing variable delays in the evoked spikes. That effect is evident in the rightward skew in the cumulative probability distributions of spike latency (Fig. 7 B), although the distribution is clearly symmetrical in the case of I M-mediated adaptation in the high conductance state. With I M (Fig. 7 B, left), shunting caused a significant narrowing of the spike latency distribution (p < 0.05, Kolmogorov–Smirnov test) without having any effect on the median latency, which was 4.1 and 4.2 ms for the low and high conductance states, respectively. With I AHP (Fig. 7 B, right), shunting significantly reduced the median latency from 5.4 to 2.3 ms (p < 0.001, Mann–Whitney test), which is attributable to the reduction of τmembrane by shunting, but shunting did not significantly alter the equalized spike latency distribution (Fig. 7 B, inset), unlike for I M; equalization is used as a tool for differentiating ways in which the spike latency distribution is altered. Comparing between I M and I AHP, spike latency distributions were not significantly different for either conductance level after equalizing median latency (Fig. 7 C, middle column). This was unexpected for the high conductance level because I M was expected to be associated with a narrower distribution than I AHP, based on the capacity of the former to prevent background spikes and thereby improve spike-time precision. However, this result is readily explained by compression of the leftward skew by reduction of median latency for I AHP (i.e., the distribution is shifted leftward but, because latency cannot become negative, the left tail of the distribution is compressed) such that the distributions become comparably narrow for I M and I AHP despite the persistent rightward skew with I AHP. Symmetrical narrowing associated with I M is not attributable to this same mechanism, because median latency is unchanged by shunting. Normalizing the latency distribution by dividing each latency measurement by the median latency allows these mechanisms to be distinguished: the normalized distributions associated with I M and I AHP become significantly different in the high conductance state (p < 0.01, Kolmogorov–Smirnov test) (Fig. 7 C, bottom right) but not in the low conductance state (Fig. 7 C, top right).
Figure 7.
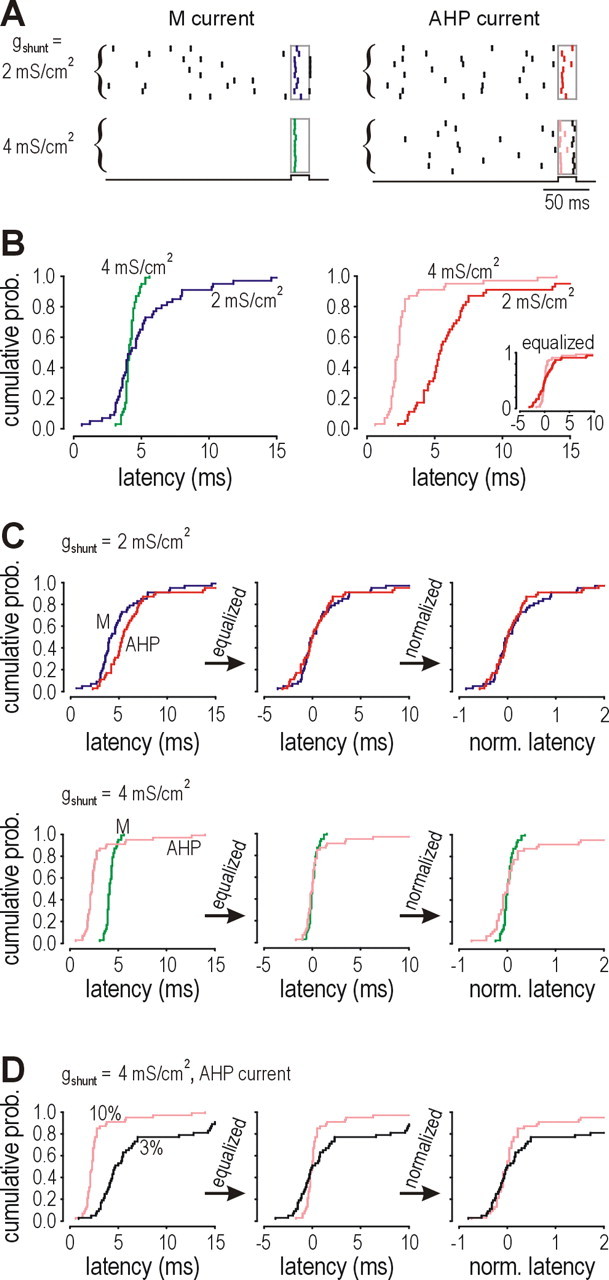
Spike-time precision is significantly improved by the prevention of repetitive spiking achieved through the nonlinear interaction between shunting and I M-mediated adaptation. A, Raster plots show spike times for different combinations of adaptation and membrane conductance. On each trial, the model neuron was stimulated with a 20-ms-long pulse (stimulus trace at bottom, rectangle on raster) superimposed on the DC. Pulse magnitude was one-tenth the DC magnitude (4 and 11 μA/cm2 for the low and high conductance states, respectively). For I M-mediated adaptation in the high conductance state (bottom left), evoked spikes showed little jitter. In all other cases, background spikes and perithreshold voltage fluctuations caused evoked spikes to be less precisely timed. B, Cumulative probability distributions summarize variability in the latency of the evoked spike based on 50 trials in each condition. For I M-mediated adaptation (left), median latencies were 4.1 and 4.2 ms for the low and high conductance states, respectively, but distributions were significantly different (p < 0.05, Kolmogorov–Smirnov test). For I AHP-mediated adaptation (right), the median latency was 5.4 ms in the low conductance state but decreased to only 2.3 ms in the high conductance state (p < 0.001, Mann–Whitney test), but, after equalizing the median to 0 (i.e., subtracting median latency from each measurement), the two distributions were not significantly different (inset). C, After equalization (middle column), spike latency distributions were not significantly different between I M- and I AHP-mediated adaptation in the low or high conductance states (top and bottom rows, respectively). However, if the distributions were normalized by dividing the equalized latencies by the original median (right column), the distributions were significantly different for the high conductance state (p < 0.01, Kolmogorov–Smirnov test) but remained unaltered in the low conductance state. Equalization and normalization are used as analytical tools to distinguish between mechanisms affecting spike latency distributions; they do not imply that any comparable process is performed by the nervous system. D, In the high conductance state, if stimulus amplitude was decreased, the model neuron with I M stopped responding (data not shown), whereas the model neuron with I AHP kept responding but became less precise; for example, after reducing the stimulus from 10 to 3% of the DC offset, a spike was still elicited in 80% of trials, but the median latency increased significantly from 2.3 to 4.7 ms (p < 0.001, Mann–Whitney test) (left). The equalized latency distribution for 3% stimulation was significantly wider than for 10% stimulation (p < 0.01, Kolmogorov–Smirnov test) (middle), but this difference was abolished by normalization (right). Effects of equalization and normalization demonstrate that compression of the leftward skew by reduction of median latency (as with I AHP) is not equivalent to the symmetrical narrowing of the distribution (as with I M) and suggests that a differential sensitivity to stimulus intensity may be important for understanding how adaptation and shunting control spike-time precision.
Despite the difference in how I M and I AHP affect the latency distribution, these data suggest that strong stimulation can elicit precisely timed spikes, particularly if τmembrane is short, whereas weak stimulation elicits poorly timed spikes. For instance, in a model neuron with high membrane conductance and I AHP-mediated adaptation, reducing stimulus amplitude from 10 to only 3% of the DC offset caused the median latency to increase significantly from 2.3 to 4.7 ms (p < 0.001, Mann–Whitney test) (Fig. 7 D, left). The increase in median latency was associated with significant widening of the latency distribution (p < 0.01, Kolmogorov–Smirnov test) (Fig. 7 D, middle), which was abolished through normalization (i.e., dividing distribution by median latency) (Fig. 7 D, right). Weaker stimuli clearly elicit less precisely timed spikes, which is not surprising (Mainen and Sejnowski, 1995). What is novel, however, is that reduction of stimulus intensity from 10 to 8% caused the model neuron with high membrane conductance and I M-mediated adaptation to fire an evoked spike in only 4% of trials. In other words, that neuron responded only to strong stimuli but always did so with precisely timed spikes, whereas the neuron with I AHP-mediated adaptation was less selective in terms of stimulus intensity and consequently showed degraded spike-time precision as stimulus intensity was reduced.
These findings were investigated further using a different stimulus paradigm that involved a continuous dynamic signal instead of a discrete pulse. Figure 8 A shows responses to this stimulus for different combinations of adaptation and shunting. As expected, spike-time precision (see Materials and Methods) increased as the amplitude of the signal, σsignal, was increased (Fig. 8 B). Values of σsignal were chosen to allow comparison between equivalent σsignal and between equivalent voltage fluctuations (because the magnitude of voltage fluctuations decreases with shunting) in the low and high conductance state. Although precision was consistently lower with I AHP-mediated adaptation compared with I M-mediated adaptation, this difference did not increase with shunting, as would have been expected from the data in Figure 7. This is explained by the fact that, with a continuous signal, all spikes were evoked by stimulus fluctuations, preempting any background spikes that could have arisen (at a lower rate) from the DC input alone; thus, prevention of background spikes by an interaction between shunting and adaptation is inconsequential under these stimulus conditions. At the same time, however, the interaction between shunting and adaptation is crucial for controlling sensitivity to stimulus fluctuations (Fig. 8 C,D). In the high conductance state, the neuron with I M spiked only in response to σsignal > 3 μA/cm2, whereas it responded to smaller signals in the low conductance state; the model neuron with I AHP responded to small signals in both the low and high conductance states. The selectivity for strong stimuli when I M is combined with high membrane conductance results from tonic hyperpolarization produced by activation of I M at perithreshold potentials (Fig. 8 E). The resulting outward current acts to maintain a gap between average depolarization and voltage threshold that only large voltage fluctuations, driven by large stimulus fluctuations, can cross to elicit spikes. Membrane conductance is able to modulate this selectivity when combined with I M because, by adjusting voltage threshold, it can modulate activation of I M at subthreshold voltages. By maintaining selectivity to strong stimuli, the combination of shunting and I M-mediated adaptation allows spike-time precision to remain high at low firing rates, whereas it would otherwise drop off precipitously (Fig. 8 F).
Figure 8.

Activation of I M at subthreshold potentials ensures high spike-time precision at low firing rates by modulating sensitivity to stimulus fluctuations. A, Raster plots show spike times for different combinations of adaptation and conductance levels. In each trial, the model neuron was stimulated with the same dynamic stimulus (shown at bottom) generated by an Ornstein–Uhlenbeck process. Stimulus amplitude was scaled by σsignal, which was 1.8 and 4 μA/cm2 for the low and high conductance state, respectively, to elicit similarly sized voltage fluctuations. For this and all subsequent panels, I DC was 40 and 110 μA/cm2 for the low and high conductance states, respectively. B, Regardless of the current responsible for adaptation, spike-time precision calculated from 45 pairwise comparisons from 10 trials in each condition (see Materials and Methods) increased as σsignal increased. Precision was consistently less with I AHP-mediated adaptation compared with I M-mediated adaptation for equivalent σsignal, but these data did not reveal an interaction between shunting and adaptation because the difference in precision between I M- and I AHP-mediated adaptation remained unchanged as conductance increased. SDV, SD of voltage fluctuations. C, Firing rate, conversely, was influenced differently by σsignal and g shunt depending on the current responsible for adaptation. With I AHP, firing rate was relatively insensitive to changes in σsignal or g shunt, whereas with I M, firing rate was dramatically reduced by increased membrane conductance despite high σsignal. D, To investigate this further, σsignal was systematically varied while measuring firing rate. Shunting caused a dramatic reduction in sensitivity to stimulus fluctuations when adaptation was mediated through I M, restricting spike generation to σsignal > 3 μA/cm2, but had virtually no effect with I AHP-mediated adaptation. This is because I AHP-mediated adaptation aims to maintain a constant firing rate, whereas I M-mediated adaptation aims to maintain a constant membrane potential (see below). Inset shows relationship between σsignal and SDV. E, With ḡ Na and ḡ K set to 0 mS/cm2 to prevent spike generation, comparison of average depolarization (top) reveals the outward rectification caused by activation of I M at perithreshold potentials. Unlike the influence of I M on average membrane potential, its slow kinetics restrict it from modulating the amplitude of fast voltage fluctuations (bottom), in which there is no difference in SDV compared with the model neuron with I AHP-mediated adaptation. Data are for testing in the high conductance state with σsignal = 4 μA/cm2. The resulting gap between average depolarization and voltage threshold ensures that neurons with I M generate spikes only in response to large stimulus fluctuations when operating in a high conductance state. F, By responding exclusively to large stimulus fluctuations, the shunted neuron with I M can maintain high spike-time precision while firing at low rates, a feature that is not evident with other combinations of adaptation and membrane conductance level. G, Activation/deactivation of g adapt (bottom traces) after a spike (top traces) for stimulus parameters producing f steady-state ≈ 18 Hz. I AHP modulates interspike interval by transiently activating and deactivating, thereby enforcing a certain regularity in the spike train. In contrast, activation of I M is relatively constant throughout the interspike interval, especially in the high conductance state, producing tonic hyperpolarization that controls responsiveness to stimulus fluctuations.
Comparison of the time course of conductance associated with I M and I AHP reveals crucial differences in how each current modulates spike generation (Fig. 8 G). Unlike g M, g AHP (red/pink lines) increases during spike generation and slowly decreases during the interspike interval, eventually allowing another spike to occur even in the absence of stimulation (excepting the DC offset). In other words, the neuron continues to act as an oscillator, but it becomes slower so that stimulus fluctuations have an opportunity to evoke spikes before background spikes occur. In contrast, g M (blue/green lines) remains relatively constant throughout the interspike interval, especially in the high conductance state. Consistent with the differential activation of I M depending on V ∗, the magnitude of g M changes significantly depending on membrane conductance, which is evident in Figure 8 G by the vertical separation of the blue and green traces. Consequently, g M contributes ∼10% of the total membrane conductance regardless of whether g shunt is low or high, whereas g AHP, whose absolute magnitude remains the same for both levels of g shunt, contributes only 8% when g shunt is high compared with 15% when g shunt is low. In any case, the conductance associated with adaptation contributes little to total membrane conductance. Moreover, the pattern of relative contributions outlined above argues against the possibility that variations in spike-time precision are attributable to effects of g M and/or gAHP via modulation of τmembrane and instead argues that it is the outward current rather than the conductance that is responsible for the effects of adaptation on spike-time precision.
Tonic hyperpolarization made possible by activation of I M at subthreshold potentials not only prevents background spiking by converting the neuron from an oscillator to a threshold element but further limits spike generation to strong stimulus fluctuations, which in turn helps ensure high spike-time precision; this control is relatively unaffected by latency from the last spike because g M does not change much during the interspike interval. Although not discussed at length here, stimulus fluctuations must not only be large but must also be reasonably fast to drive spike generation before (without) activating I M. The shift from responding to constant input with repetitive spiking, to responding selectively to large, rapid stimulus fluctuations with precisely timed spikes is, in every way, consistent with a conversion from integration to coincidence detection.
Discussion
Experimental observations in hippocampal pyramidal neurons revealed that membrane conductance has a pronounced effect on the outcome of adaptation: adaptation was able to abolish repetitive spiking only when combined with increased membrane conductance. To explain how shunting and adaptation interact to control repetitive spiking, we developed a simplified phase plane model that reproduced the observed phenomenon. Effects of membrane conductance on the outcome of adaptation were explained by modulation of voltage threshold: adaptation sufficient to stabilize the system at subthreshold potentials is more likely to be induced when voltage threshold is increased by shunting. A shunting-induced increase in voltage threshold was observed experimentally, confirming that the proposed mechanism is applicable to real neurons. The increase in voltage threshold enhances subthreshold activation of I M but has no effect on I AHP, explaining why only the former is able to abolish repetitive spiking. The nonlinear interaction between shunting and I M has important implications for encoding: brief stimuli evoke more precisely timed spikes when adaptation prevents background spikes elicited by DC input, and, beyond that, good spike-time precision is ensured by allowing only large, rapid stimulus fluctuations to successfully evoke spikes. By modulating activation of I M at subthreshold potentials, shunting can effectively control whether CA1 pyramidal neurons operate as integrators or as coincidence detectors.
As outlined in the Introduction, background synaptic activity such as occurs in vivo can cause a dramatic increase in total membrane conductance compared with values typically observed in slice experiments. It is therefore important to determine precisely what effects shunting has on the computational properties of neurons to understand how neurons operate in vivo. Increased membrane conductance has been postulated to encourage operation of neurons as coincidence detectors rather than as integrators, thereby improving the temporal resolution with which neurons respond to inputs (Destexhe et al., 2003; Rudolph and Destexhe, 2003; Shu et al., 2003). The results reported in this study are fully consistent with that view but additionally reveal a novel and powerful mechanism by which this occurs. When the neuron spikes repetitively in response to sustained DC input, it is acting as an integrator; conversely, when adaptation prevents repetitive spiking, it prevents the neuron from acting as an integrator. The fact that the capacity of adaptation to prevent repetitive spiking depends on membrane conductance means that membrane conductance can effectively control the operational mode of the neuron. In the high conductance state, a broad range of DC stimulus intensities can depolarize the neuron to just-subthreshold potentials; this is achieved because the activation of adaptation is proportional to stimulus intensity. By resting just below threshold, the neuron is ideally positioned to respond to fluctuating inputs that are fast enough to elicit spikes before the negative feedback imposed by adaptation takes effect. In fact, subthreshold activation of I M can control how closely average depolarization approaches threshold, thereby setting a lower bound on the amplitude of voltage fluctuations that are able to elicit spikes. In other words, the same mechanism that prevents repetitive spiking in response to constant input goes one step further in ensuring responsiveness to only stimulus fluctuations greater than a certain amplitude. The interaction between shunting and adaptation therefore prevents the neuron from acting as an integrator, or oscillator, and instead causes it to act as an ideal coincidence detector, or threshold element (Gutkin et al., 2003). Adaptation can be similarly conceptualized as implementing a high-pass filter (Benda et al., 2005). According to our results, membrane conductance can control the degree of high-pass filtering implemented through adaptation.
Of course a neuron that spikes repetitively to DC stimulation may also respond to superimposed input. However, in that case, “background” spikes may alter the timing of spikes evoked by the signal of interest. Such a neuron could be said to operate as a perturbed oscillator (Gutkin et al., 2003) and is expected to exhibit poorer spike-time precision than a threshold element, which is exactly what we observed (Fig. 7). However, whereas background spikes altered the timing of spikes evoked by discrete inputs, spikes evoked by continuous, dynamic signals appeared to preempt background spikes (Fig. 8), which would seemingly nullify any benefits of prohibiting background spikes. In effect, a perturbed oscillator that oscillates slowly may produce evoked spikes with precision comparable with spikes produced by a true threshold element if stimulus fluctuations are large. However, spike-time precision decreases as the amplitude of stimulus fluctuations decreases, but whereas oscillators cannot help but respond to small fluctuations, threshold elements can control their sensitivity and spike only in response to large fluctuations that produce precisely timed spikes. This sensitivity control is achieved by maintaining a gap between average membrane potential and voltage threshold that only sufficiently large fluctuations are able to cross. Thus, the observation that subthreshold activation of I M not only prevents the neuron from responding to constant input but also restricts it from responding to dynamic input smaller than a certain amplitude explains why a neuron operating in a high conductance state with I M-mediated adaptation can maintain good spike-time precision even at low firing rates; in contrast, neurons operating in a low conductance state and/or neurons with I AHP-mediated adaptation cannot maintain good precision at low firing rates.
CA1 pyramidal neurons are known to express multiple outward currents that mediate adaptation, including the voltage-dependent M current and the calcium-activated AHP current (Madison and Nicoll, 1984; Storm, 1990; Sah and Davies, 2000). Gu et al. (2005) have recently argued that the former is exclusively responsible for adaptation in CA1 pyramidal neurons. The results of this study highlight the importance of I M but do not exclude the potential contribution of other currents to adaptation. However, although one may be tempted to disregard the differences between adaptation mediated through one or the other current and to treat the negative feedback process in a more generic manner, results presented here indicate that the computational consequences of each type of adaptation may be quite distinct. Both I M and I AHP reduce firing rate, but there is a fundamental difference: I M can abolish repetitive spiking whereas I AHP cannot. Previous modeling work appears consistent with this conclusion (Yamada et al., 1998). Extremely slow calcium kinetics may give the impression that adaptation mediated by I AHP can abolish repetitive spiking (Pineda et al., 1999), and, in pragmatic terms, this may be true, but our dynamical systems analysis suggests that, although the system may evolve slowly, it remains unstable and should therefore eventually spike. The differential capacity to control repetitive spiking, as well as the differential capacity to control sensitivity to stimulus fluctuations (see above), stem from differences between the activation curves for the two currents: whereas I M has a fairly broad activation curve and can be activated at subthreshold potentials (Adams et al., 1982; Halliwell and Adams, 1982; Gutfreund et al., 1995; Wang and McKinnon, 1995; Wang et al., 1998), I AHP is activated by calcium arriving via high-voltage-activated calcium channels or by calcium released from intracellular stores, both of which typically rely on spike generation (Davies et al., 1996; Pineda et al., 1998, 1999). The capacity for activation at subthreshold potentials, and the modulability of that activation by shunting, allows I M to influence spike generation in ways that are quite distinct from I AHP.
On their own, both adaptation and shunting shape neuronal coding properties. To the best of our knowledge, this is the first demonstration that shunting can qualitatively alter the outcome of adaptation. Given that the membrane conductance of pyramidal neurons is significantly increased by synaptic input received in vivo, the nonlinear interaction between shunting and adaptation is important for understanding how neurons process inputs under physiological conditions. Moreover, adaptation is itself subject to extensive modulation by various neurotransmitters (Madison and Nicoll, 1986; Nicoll, 1988; McCormick and Williamson, 1989; Barkai and Hasselmo, 1994; Pedarzani and Storm, 1995; Tang et al., 1997). Indeed, I M is decreased by acetylcholine, noradrenaline, and serotonin, and, because those neuromodulatory systems are more active during aroused states, one could posit that pyramidal neurons behave as integrators during wakefulness and as coincidence detectors during slow-wave sleep. The more conservative view is that the combination of neuromodulation and high levels of network activity may allow the operational mode to be switched between integration and coincidence detection during wakefulness, whereas such switching may not be readily achieved under other conditions. In any case, neuronal coding properties are highly regulated. Understanding how neurons encode information will not only require that we identify the biophysical determinants of encoding but will also require that we understand the interactions between those determinants. This is especially true if those interactions are nonlinear, as is the case for membrane conductance and adaptation.
Footnotes
This research was supported by the Natural Sciences and Engineering Research Council of Canada (Y.D.K.) and the Howard Hughes Medical Institute (T.J.S.). S.A.P. was supported by postdoctoral fellowships from the Canadian Institutes of Health Research and the Human Frontier Science Program. We thank Bard Ermentrout for assistance using XPPAUT.
References
- Adams PR, Brown DA, Constanti A. M-currents and other potassium currents in bullfrog sympathetic neurones. J Physiol (Lond) 1982;330:537–572. doi: 10.1113/jphysiol.1982.sp014357. [DOI] [PMC free article] [PubMed] [Google Scholar]
- Alger BE, Dhanjal SS, Dingledine R, Garthwaite J, Henderson G, King GL, Lipton P, North A, Schwartzkroin PA, Sears TA, Segal M, Whittingham TS, Williams J. Brain slice methods. In: Dingledine R, editor. Brain slices. New York: Plenum; 1984. pp. 381–437. [Google Scholar]
- Azouz R, Gray CM. Dynamic spike threshold reveals a mechanism for synaptic coincidence detection in cortical neurons in vivo. Proc Natl Acad Sci USA. 2000;97:8110–8115. doi: 10.1073/pnas.130200797. [DOI] [PMC free article] [PubMed] [Google Scholar]
- Barkai E, Hasselmo ME. Modulation of the input/output function of rat piriform cortex pyramidal cells. J Neurophysiol. 1994;72:644–658. doi: 10.1152/jn.1994.72.2.644. [DOI] [PubMed] [Google Scholar]
- Benda J, Longtin A, Maler L. Spike-frequency adaptation separates transient communication signals from background oscillations. J Neurosci. 2005;25:2312–2321. doi: 10.1523/JNEUROSCI.4795-04.2005. [DOI] [PMC free article] [PubMed] [Google Scholar]
- Bernander Ö, Douglas RJ, Martin KA, Koch C. Synaptic background activity influences spatiotemporal integration in single pyramidal cells. Proc Natl Acad Sci USA. 1991;88:11569–11573. doi: 10.1073/pnas.88.24.11569. [DOI] [PMC free article] [PubMed] [Google Scholar]
- Davies PJ, Ireland DR, McLachlan EM. Sources of Ca2+ for different Ca2+-activated K+ conductances in neurones of the rat superior cervical ganglion. J Physiol (Lond) 1996;495:353–366. doi: 10.1113/jphysiol.1996.sp021599. [DOI] [PMC free article] [PubMed] [Google Scholar]
- Destexhe A, Paré D. Impact of network activity on the integrative properties of neocortical pyramidal neurons in vivo. J Neurophysiol. 1999;81:1531–1547. doi: 10.1152/jn.1999.81.4.1531. [DOI] [PubMed] [Google Scholar]
- Destexhe A, Rudolph M, Fellous JM, Sejnowski TJ. Fluctuating synaptic conductances recreate in vivo-like activity in neocortical neurons. Neuroscience. 2001;107:13–24. doi: 10.1016/s0306-4522(01)00344-x. [DOI] [PMC free article] [PubMed] [Google Scholar]
- Destexhe A, Rudolph M, Pare D. The high-conductance state of neocortical neurons in vivo. Nat Rev Neurosci. 2003;4:739–751. doi: 10.1038/nrn1198. [DOI] [PubMed] [Google Scholar]
- Ermentrout B. Linearization of F-I curves by adaptation. Neural Comput. 1998;10:1721–1729. doi: 10.1162/089976698300017106. [DOI] [PubMed] [Google Scholar]
- Ermentrout B. Simulating, analyzing, and animating dynamical systems: a guide to XPPAUT for researchers and students. Philadelphia: SIAM; 2002. [Google Scholar]
- FitzHugh R. Impulses and physiological states in theoretical models of nerve membrane. Biophys J. 1961;1:445–466. doi: 10.1016/s0006-3495(61)86902-6. [DOI] [PMC free article] [PubMed] [Google Scholar]
- FitzHugh R. Mathematical models of excitation and propagation in nerve. In: Schwan HP, editor. Biological engineering. Toronto: McGraw-Hill; 1969. pp. 1–85. [Google Scholar]
- Gu N, Vervaeke K, Hu H, Storm JF. Kv7/KCNQ/M and HCN/h, but not KCa2/SK channels, contribute to the somatic medium after-hyperpolarization and excitability control in CA1 hippocampal pyramidal cells. J Physiol (Lond) 2005;566:689–715. doi: 10.1113/jphysiol.2005.086835. [DOI] [PMC free article] [PubMed] [Google Scholar]
- Gutfreund Y, Yarom Y, Segev I. Subthreshold oscillations and resonant frequency in guinea-pig cortical neurons: physiology and modelling. J Physiol (Lond) 1995;483:621–640. doi: 10.1113/jphysiol.1995.sp020611. [DOI] [PMC free article] [PubMed] [Google Scholar]
- Gutkin B, Ermentrout GB, Rudolph M. Spike generating dynamics and the conditions for spike-time precision in cortical neurons. J Comput Neurosci. 2003;15:91–103. doi: 10.1023/a:1024426903582. [DOI] [PubMed] [Google Scholar]
- Halliwell JV, Adams PR. Voltage-clamp analysis of muscarinic excitation in hippocampal neurons. Brain Res. 1982;250:71–92. doi: 10.1016/0006-8993(82)90954-4. [DOI] [PubMed] [Google Scholar]
- Hodgkin AL. The local changes associated with repetitive action in a non-medullated axon. J Physiol (Lond) 1948:165–181. doi: 10.1113/jphysiol.1948.sp004260. [DOI] [PMC free article] [PubMed] [Google Scholar]
- Izhikevich EM. Neural excitability, spiking and bursting. Int J Bifurcat Chaos. 2000;10:1171–1266. [Google Scholar]
- Madison DV, Nicoll RA. Control of the repetitive discharge of rat CA1 pyramidal neurones in vitro. J Physiol (Lond) 1984;354:319–331. doi: 10.1113/jphysiol.1984.sp015378. [DOI] [PMC free article] [PubMed] [Google Scholar]
- Madison DV, Nicoll RA. Actions of noradrenaline recorded intracellularly in rat hippocampal CA1 pyramidal neurones, in vitro. J Physiol (Lond) 1986;372:221–244. doi: 10.1113/jphysiol.1986.sp016006. [DOI] [PMC free article] [PubMed] [Google Scholar]
- Mainen ZF, Sejnowski TJ. Reliability of spike timing in neocortical neurons. Science. 1995;268:1503–1506. doi: 10.1126/science.7770778. [DOI] [PubMed] [Google Scholar]
- Marrion NV, Zucker RS, Marsh SJ, Adams PR. Modulation of M-current by intracellular Ca2+ . Neuron. 1991;6:533–545. doi: 10.1016/0896-6273(91)90056-6. [DOI] [PubMed] [Google Scholar]
- McCormick DA, Williamson A. Convergence and divergence of neurotransmitter action in human cerebral cortex. Proc Natl Acad Sci USA. 1989;86:8098–8102. doi: 10.1073/pnas.86.20.8098. [DOI] [PMC free article] [PubMed] [Google Scholar]
- Morris C, Lecar H. Voltage oscillations in the barnacle giant muscle fiber. Biophys J. 1981;35:193–213. doi: 10.1016/S0006-3495(81)84782-0. [DOI] [PMC free article] [PubMed] [Google Scholar]
- Nicoll RA. The coupling of neurotransmitter receptors to ion channels in the brain. Science. 1988;241:545–551. doi: 10.1126/science.2456612. [DOI] [PubMed] [Google Scholar]
- Paré D, Shink E, Gaudreau H, Destexhe A, Lang EJ. Impact of spontaneous synaptic activity on the resting properties of cat neocortical pyramidal neurons in vivo. J Neurophysiol. 1998;79:1450–1460. doi: 10.1152/jn.1998.79.3.1450. [DOI] [PubMed] [Google Scholar]
- Pedarzani P, Storm JF. Dopamine modulates the slow Ca2+-activated K+ current IAHP via cyclic AMP-dependent protein kinase in hippocampal neurons. J Neurophysiol. 1995;74:2749–2753. doi: 10.1152/jn.1995.74.6.2749. [DOI] [PubMed] [Google Scholar]
- Pineda JC, Waters RS, Foehring RC. Specificity in the interaction of HVA Ca2+ channel types with Ca2+-dependent AHPs and firing behavior in neocortical pyramidal neurons. J Neurophysiol. 1998;79:2522–2534. doi: 10.1152/jn.1998.79.5.2522. [DOI] [PubMed] [Google Scholar]
- Pineda JC, Galarraga E, Foehring RC. Different Ca2+ source for slow AHP in completely adapting and repetitive firing pyramidal neurons. NeuroReport. 1999;10:1951–1956. doi: 10.1097/00001756-199906230-00029. [DOI] [PubMed] [Google Scholar]
- Pinto RD, Elson RC, Szucs A, Rabinovich MI, Selverston AI, Abarbanel HD. Extended dynamic clamp: controlling up to four neurons using a single desktop computer and interface. J Neurosci Methods. 2001;108:39–48. doi: 10.1016/s0165-0270(01)00368-5. [DOI] [PubMed] [Google Scholar]
- Rinzel J. Excitation dynamics: insights from simplified membrane models. Fed Proc. 1985;44:2944–2946. [PubMed] [Google Scholar]
- Rinzel J, Ermentrout GB. Analysis of neural excitability and oscillations. In: Koch C, Segev I, editors. Methods in neuronal modeling: from ions to networks. Cambridge, MA: MIT; 1998. pp. 251–291. [Google Scholar]
- Rudolph M, Destexhe A. Tuning neocortical pyramidal neurons between integrators and coincidence detectors. J Comput Neurosci. 2003;14:239–251. doi: 10.1023/a:1023245625896. [DOI] [PubMed] [Google Scholar]
- Sah P, Davies P. Calcium-activated potassium currents in mammalian neurons. Clin Exp Pharmacol Physiol. 2000;27:657–663. doi: 10.1046/j.1440-1681.2000.03317.x. [DOI] [PubMed] [Google Scholar]
- Schreiber S, Fellous JM, Whitmer D, Tiesinga P, Sejnowski TJ. A new correlation-based measure of spike timing reliability. Neurocomputing. 2003;52–54:925–931. doi: 10.1016/S0925-2312(02)00838-X. [DOI] [PMC free article] [PubMed] [Google Scholar]
- Schwindt PC, Spain WJ, Crill WE. Effects of intracellular calcium chelation on voltage-dependent and calcium-dependent currents in cat neocortical neurons. Neuroscience. 1992;47:571–578. doi: 10.1016/0306-4522(92)90166-y. [DOI] [PubMed] [Google Scholar]
- Sharp AA, O’Neil MB, Abbott LF, Marder E. The dynamic clamp: artificial conductances in biological neurons. Trends Neurosci. 1993;16:389–394. doi: 10.1016/0166-2236(93)90004-6. [DOI] [PubMed] [Google Scholar]
- Shu Y, Hasenstaub A, Badoual M, Bal T, McCormick DA. Barrages of synaptic activity control the gain and sensitivity of cortical neurons. J Neurosci. 2003;23:10388–10401. doi: 10.1523/JNEUROSCI.23-32-10388.2003. [DOI] [PMC free article] [PubMed] [Google Scholar]
- Staley KJ, Otis TS, Mody I. Membrane properties of dentate gyrus granule cells: comparison of sharp microelectrode and whole-cell recordings. J Neurophysiol. 1992;67:1346–1358. doi: 10.1152/jn.1992.67.5.1346. [DOI] [PubMed] [Google Scholar]
- Storm JF. Potassium currents in hippocampal pyramidal cells. Prog Brain Res. 1990;83:161–187. doi: 10.1016/s0079-6123(08)61248-0. [DOI] [PubMed] [Google Scholar]
- Strogatz SH. Nonlinear dynamics and chaos: with applications to physics, biology, chemistry, and engineering. Don Mills, Canada: Addison-Wesley; 1998. [Google Scholar]
- Tang AC, Bartels AM, Sejnowski TJ. Effects of cholinergic modulation on responses of neocortical neurons to fluctuating input. Cereb Cortex. 1997;7:502–509. doi: 10.1093/cercor/7.6.502. [DOI] [PubMed] [Google Scholar]
- Uhlenbeck GE, Ornstein LS. On the theory of Brownian motion. Phys Rev. 1930;36:823–841. [Google Scholar]
- Wang HS, McKinnon D. Potassium currents in rat prevertebral and paravertebral sympathetic neurones: control of firing properties. J Physiol (Lond) 1995;485:319–335. doi: 10.1113/jphysiol.1995.sp020732. [DOI] [PMC free article] [PubMed] [Google Scholar]
- Wang HS, Pan Z, Shi W, Brown BS, Wymore RS, Cohen IS, Dixon JE, McKinnon D. KCNQ2 and KCNQ3 potassium channel subunits: molecular correlates of the M-channel. Science. 1998;282:1890–1893. doi: 10.1126/science.282.5395.1890. [DOI] [PubMed] [Google Scholar]
- Yamada WM, Koch C, Adams PR. Multiple channels and calcium dynamics. In: Koch C, Segev I, editors. Methods in neuronal modeling: from ions to networks. Cambridge, MA: MIT; 1998. pp. 137–170. [Google Scholar]
- Zhang L, Weiner JL, Valiante TA, Velumian AA, Watson PL, Jahromi SS, Schertzer S, Pennefather P, Carlen PL. Whole-cell recording of the Ca2+-dependent slow afterhyperpolarization in hippocampal neurones: effects of internally applied anions. Pflügers Arch. 1994;426:247–253. doi: 10.1007/BF00374778. [DOI] [PubMed] [Google Scholar]