

Abstract
Context: Recent evidence indicates that a higher plasma level of 25-hydroxyvitamin D [25(OH)D] is associated with lower adiposity and a reduced number of metabolic disturbances (MetD).
Objectives: We examined associations among dietary quality, 25(OH)D, percent body fat (%BF), and MetD, and a pathway linking them, across central obesity.
Design: This cross-sectional nationally representative study used extensive data from the National Health and Nutrition Examination Surveys of 2001–2004.
Participants: U.S. adults aged at least 20 yr were stratified by central obesity (CO) status. Sample sizes ranged from 1943 (all MetD combined) to 7796 (each component).
Main Outcome Measures: %BF was measured using dual-energy x-ray absorptiometry, and MetD was measured with individual continuous nonadiposity outcomes (e.g. fasting plasma glucose) and with a composite count index of binary MetD with prespecified cutoff points (Index I).
Results: A higher 25(OH)D was associated with better dietary quality, lower %BF, and lower number of MetD. These inverse 25(OH)D-%BF and 25(OH)D-MetD associations (i.e. fasting blood glucose, homeostatic model assessment of insulin resistance, C-reactive protein, and Index I) were significantly stronger among the CO+ group. Finally, the pathway linking the dairy component of the Healthy Eating Index (HEIdairy) to Index I through 25(OH)D and %BF indicated complete mediation among the CO− group, but HEIdairy and 25(OH)D had direct inverse associations with Index I among the CO+ group.
Conclusions: Due to potential genetic differences between CO− and CO+ groups, empowering U.S. adults with central obesity to make related behavioral changes may be especially effective in improving their vitamin D status and metabolic profile.
An inverse association between 25-hydroxyvitamin D and metabolic disturbance was significantly stronger among adults in the United States with central obesity compared to those without central obesity.
Earlier research had focused on skeletal disorders associated with vitamin D deficiency including rickets in children (1) and osteomalacia (2) or osteoporosis (3) in adults, the risk of which can be modified by increasing intake of foods enriched with vitamin D (4). However, recent evidence points to the fact that vitamin D status, particularly in plasma, may also be protective against the risk of cardiovascular disease (5,6,7), cancer (8,9,10), and infection (11,12,13). As in rickets and osteomalacia, vitamin D dietary supplementation has been shown to prevent the adverse effects of insufficiency and reduce the risk of some of those disorders as well as that of all-cause mortality (14,15,16). A number of recent studies have shown that higher levels of 25-hydroxyvitamin D [25(OH)D] in plasma are associated with lower adiposity (mainly measured by anthropometric measures) and a reduced number of metabolic disturbances (MetD) (17,18,19,20,21,22,23,24,25,26,27,28,29,30,31,32,33).
Moreover, obesity and its related disorders were shown to be inversely related to overall dietary quality (34,35,36,37,38,39), specifically the dairy component of dietary quality, which is a rich source of vitamin D (40,41,42). However, no recent large nationally representative U.S. study has addressed the question of whether the effects of 25(OH)D on percent body fat (%BF) and obesity-related MetD differ appreciably between subjects with central obesity (CO+) compared with those without central obesity (CO−), although a few earlier studies had restricted their samples to morbidly obese subjects (19). A significantly stronger effect on a select group of people who may be prone to MetD (e.g. CO+) may implicate gene-environment interactions. In fact, using the National Health and Nutrition Examination Surveys (NHANES) 1988–1994 and 1999–2004 data (43), we found that waist circumference increased at a faster pace in the upper percentiles than the lower percentiles in the U.S. adult population. This may suggest an interaction between environmental changes and genetic makeup. In fact, one candidate gene (vitamin D receptor gene polymorphism) was recently shown to be significantly related to obesity status in general and waist circumference value in particular (44,45). Moreover, there is a lack of understanding of the role played by dietary quality (an environmental factor) in these associations. Finally, elevated C-reactive protein (CRP) and hyperuricemia, which often accompany obesity and the metabolic syndrome (46,47,48,49) and have been associated with poor dietary quality (50,51), have not been studied thus far in relation to 25(OH)D status in the general U.S. population.
The present study aims to tackle these research gaps and examine a pathway between dietary quality and the number of MetD going through 25(OH)D and adiposity, stratifying the study sample by central obesity status.
Materials and Methods
Database and study subjects
The NHANES is a series of cross-sectional annual surveys that have provided health and nutrition data on nationally representative samples of the U.S. civilian population since the 1970s. NHANES has a stratified, multistage probability cluster sampling design. In-home interviews collecting basic sociodemographic data are followed by health examinations in a mobile examination center (MEC) that include various anthropometric, blood pressure, and laboratory measurements. Detailed descriptions of the study design and data collection have been published elsewhere (52).
In the present study, NHANES data from adults aged 20–85 yr for the periods 2001–2002 and 2003–2004 were merged. Among a sample of 9769 subjects (4661 men and 5108 women) with complete demographic data, we excluded pregnant and lactating women. Of the remaining sample (n = 9050; eligible sample 1; see Fig. 1), 8579 had complete dietary data and 8155 had complete 25(OH)D status and dietary data. Many metabolic outcomes considered had missing data ranging from 10–20% of this sample, including anthropometric measurements such as waist circumference for assessment of central obesity status. However, because fasting blood sample tests [e.g. fasting blood glucose, insulin, high-density lipoprotein cholesterol (HDL-C), and triglycerides (TG)] were conducted in only half of the eligible adult sample, complete data on all MetD disturbances combined and other variables of interest were available for only 1943 subjects (eligible sample 4; see Fig. 1.). Sampling weights were applied to account for nonresponse bias.
Figure 1.

Flow diagram for study sample selection, NHANES 2001–2004.
Outcome assessment
%BF
Whole-body %BF was calculated as total body fat mass divided by total mass (fat mass + lean mass + total bone mineral content) × 100. All these measurements were obtained by performing a whole-body scan using dual-energy x-ray absorptiometry (DXA) and a multiple detector fan-beam Hologic QDR-2000 densitometer (Hologic, Inc., Waltham, MA) (53).
MetD
Blood pressure and laboratory tests.
Using a mercury sphygmomanometer, three to four blood pressure determinations [systolic blood pressure (SBP) and diastolic blood pressure (DBP)] were made during MEC examinations and during home examinations for older participants (54). Final measures were the average of three determinations. SBP and DBP values were also combined as mean arterial pressure (MAP): MAP = (SBP + 2 × DBP)/3.
Specimen collection and processing instructions are detailed elsewhere (55). In brief, fasting blood glucose was analyzed by reacting glucose with ATP, a reaction that is catalyzed by the enzyme hexokinase. TG were measured enzymatically by hydrolyzing to produce glycerol in a series of coupled reactions. HDL-C was measured using two methods: 1) heparin-manganese precipitation and 2) direct immunoassay. Fasting serum insulin was measured using a RIA reagent (Pharmacia Diagnostics, Uppsala, Sweden). Uric acid level was measured by oxidization with the specific enzyme uricase to form allantoin and H2O2 (Hitachi model 737 multichannel analyzer; Roche Molecular Biochemicals Diagnostics, Indianapolis, IN), and high-sensitivity CRP was quantified by latex-enhanced nephelometry (Behring Diagnostics, Westwood, MA).
MetD assessment.
Although most of the analysis examined continuous measures of MetD, summary measures combining binary outcomes with prespecified cutoff points were also considered. These binary outcomes included the nonadiposity components of the metabolic syndrome, as defined by the National Cholesterol Education Program, Adult Treatment Panel III (NCEP ATP III) (56): 1) SBP/DBP at least 130/85 mm Hg, 2) fasting glucose at least 110 mg/dl, 3) TG at least 150 mg/dl, and 4) HDL-C less than 40 mg/dl for men and less than 50 mg/dl for women. Additionally, we examined the following: 5) the homeostatic model assessment of insulin resistance (HOMA-IR) with a cutoff point of 2.61 reflecting high insulin resistance level as suggested elsewhere (57,58), 6) hyperuricemia with cutoffs of more than 7 mg/dl in men and more than 6 mg/dl in women (59), and 7) elevated CRP defined as more than 2.11 mg/liter (60). One index (Index I) summing the NCEP ATP III binary MetD (i.e. criteria 1–4; 0 = no; 1 = yes) and all other disturbances (i.e. criteria 5–7) and thus ranging between 0 and 7, was examined as a measure of overall MetD.
Exposure assessment
Vitamin D status
Serum 25(OH)D was measured by a RIA kit after extraction with acetonitrile (Diasorin Inc., Stillwater, MN). The 25(OH)D levels reported represent the summation of ergocalciferol 25(OH)D2 and cholecalciferol 25(OH)D3.
Dietary intake and dietary quality
One 24-h recall of dietary intakes among all participants was used to assess dietary quality by the 2005 U.S. Department of Agriculture (USDA) Healthy Eating Index (HEI) (61), an improvement over its earlier 1995 version (36). The new HEI reflects the 2005 Dietary Guidelines for Americans (61) and includes energy-adjusted components. Twelve components are estimated with varying ranges, and the total score (HEItotal; sum of the 12 components) may range from 0–100, with a higher score indicating a better quality diet (61). Components of the HEI (HEIk, where k = 1–12), particularly HEI7 (dairy), were also considered.
Covariates
Sociodemographic covariates
Age, sex, race/ethnicity [categorized as non-Hispanic (NH) Whites, non-Hispanic Blacks, Mexican-American, and other groups], education (grouped as 0, less than a high school education; 1, high school (12 yr); and 2, more than a high school education) and family income (poverty income ratio < 125% for poor, 125–300% for near poor, and >300% for not poor).
Physical activity
Three measures of physical activity (PA) were included as covariates: 1) vigorous activity over the past 30 d that was dichotomized as 1 = yes and 0 = no; 2) PA compared with age peers, coded as 0 = less, 1 = about the same, and 2 = more; 3) a more objective measure, the MET × hours per week of PA (62,63), constructed based on individual leisure-time activities and categorized in part of the analysis as 0 to less than 5, 5–10, and more than 10.
Central obesity status
Waist circumference (in centimeters) was measured using a tape measure starting from the hip bone and wrapping around the waist at the level of the navel. Central obesity was defined as waist circumference more than 102 cm for men and more than 88 cm for women, based on the North American Association for the Study of Obesity/National Heart, Lung, and Blood Institute recommendations (64).
Statistical analysis
All analyses except for structural equations modeling (SM) were conducted using Stata release 10.0 (Stata Corp., College Station, TX). Using survey commands, we applied recommended subsample weights for the period of 2001–2004 and accounted for multiple imputations for DXA scan data. MEC exam weights were used for most analyses, except for those where the fasting half-sample had the limiting variable in the analysis, in which case a specific weight variable was substituted to obtain population estimates of means, proportions, and regression coefficients. Masked variance units were used to estimate variances using the Taylor series linearization method. This allowed us to provide an unbiased estimate for the se, given sampling design complexity (65).
Our analysis consisted of several steps. First, we described the sample participants’ characteristics by selected meaningful categories of 25(OH)D levels (<20, 20 to <25, and ≥25) and central obesity status. Associations between variables were tested using ANOVA (non-design-based F test) with continuous outcomes and a design-based F test for categorical outcomes.
Second, a set of multiple linear regression models with continuous 25(OH)D as the main outcome and central obesity as the main exposure was conducted to assess the confounding effects of sociodemographic, lifestyle, and dietary factors as well as that of %BF in the main association. Attenuation of the main association was of particular interest.
Third, multiple linear regression models with continuous %BF, selected MetD, and ordinal MetD (Indices I and II) as outcomes were conducted to test their associations with overall dietary quality (HEItotal; standardized z-score) and 25(OH)D status (also as z-score) as explanatory variables in the model, controlling for potential confounders and stratifying by central obesity status. Effect modification by central obesity status was tested by adding an exposure × central obesity interaction term to each model. Design-based Wald tests were used to assess significance of regression coefficients. A sensitivity analysis for MetD was conducted whereby %BF was added as an additional potential confounder in each model. A type I error of 0.05 was used for significance and 0.10 for borderline significance.
Finally, using the CALIS procedure (66) in SAS version 9.2, we fit SM to test the most likely pathway between dietary quality and number of binary MetD (Index I), considering 25(OH)D and %BF as serial mediators. Global goodness of SM fit indices included the root mean square error of approximation (RMSEA) with its 90% confidence interval (CI) (criterion is 0.06 or lower for good fit), goodness of fit index adjusted for degrees of freedom (AGFI), which ranges between 0 (poor fit) and 1 (model fits). Full models were reduced by removing nonsignificant exogenous variables with a 0.10 type I error. Effect modification by central obesity status was determined for the main associations of interest by comparing 95% CI of path coefficients (see Fig. 2 for more details). Findings were interpreted in terms of significance of the direct effects of HEItotal and HEIdairy on Index I and the significance of path coefficients pertaining to the indirect effect through 25(OH)D and %BF. Lack of significance of a direct effect may indicate that mediation is pseudo-complete in the pathway being tested, as long as the mediating path coefficients are statistically significant at type I error of 0.05. In contrast, the significance of direct effect at a type I error of 0.05 may suggest that an alternative pathway is at play.
Figure 2.

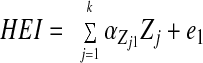
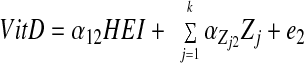
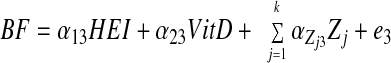
SM stratified by central obesity (CO) status: testing mediation of HEI-Index I MetD through 25(OH)D and %BF. A theoretical model was set up in which sociodemographic and lifestyle factors were exogenous to the main variables of interest. The model consisted of simultaneous equations with outcomes being HEI, 25(OH)D, %BF, and number of MetD (Index I range between 0 and 7), stratified by central obesity status. HEItotal and HEIdairy were considered alternatively. Effect modification by central obesity status was determined for the main associations of interest by comparing 95% CI of path coefficients. The following equations correspond to the general setup of the structural equations model:
 |
1 |
 |
2 |
 |
3 |
 |
4 |
where HEI (total or dairy component; z-score) was allowed to predict all subsequent outcomes, plasma 25(OH)D level (vitamin D; z-score) was allowed to predict only %BF and number of MetD (Index I; ordinal), and BF was allowed to predict only MetD. Zj is the vector of other exogenous variables (e.g. sociodemographic and lifestyle factors; continuous terms such as age were entered as continuous), whereas e1, e2, e3, and e4 are the error terms. Correlations between all exogenous variables except error terms (assumed to be zero) were estimated.
Results
The prevalence of hypovitaminosis D [25(OH)D < 20 ng/ml] was higher among CO+ participants compared with the CO− group (37.7 vs. 25.8%, P < 0.0001 for design-based F test). In both subgroups, those with hypovitaminosis D were younger, more likely to be non-Whites, to have less than a high school education, and to be poor and were less likely to be physically active. CO− participants with hypovitaminosis D were more likely to be men compared with those with higher serum 25(OH)D levels, although the opposite was true among the CO+ group. HEItotal was lowest among participants with low 25(OH)D (<20 ng/ml) consistently between the two subgroups. Notably, HEI7 (dairy component) showed a clear linear dose response by tertile of 25(OH)D in both subgroups (P < 0.05; non-design-based F value; Table 1). Moreover, comparing CO+ with CO− participants, all metabolic indices were indicative of greater disturbance among the CO+ group (P < 0.05; non-design-based F value; Table 2).
Table 1.
Sociodemographic, lifestyle, and dietary characteristics by 25(OH)D status: CO+ vs. CO− group among U.S. adults: NHANES 2001–2004
| CO− (n = 4092)
|
CO+ (n = 4501)
|
|||||||
|---|---|---|---|---|---|---|---|---|
| 25(OH)D level
|
P value | 25(OH)D level
|
P value | |||||
| <20 ng/ml | 20–<25 ng/ml | ≥25 ng/ml | <20 ng/ml | 20–<25 ng/ml | ≥25 ng/ml | |||
| % ± se | 25.8 ± 1.9 | 21.5 ± 0.9 | 52.7 ± 1.9 | 37.7 ± 2.1 | 22.3 ± 1.0 | 39.9 ± 2.1 | <0.0001a | |
| n | 1315 | 842 | 1739 | 1950 | 935 | 1403 | ||
| Age, yr (% ± se) | ||||||||
| 20–29 | 28.3 ± 1.8 | 28.4 ± 2.2 | 23.1 ± 1.2 | 0.0860b | 15.6 ± 1.1 | 8.9 ± 0.9 | 9.0 ± 1.2 | 0.0001b |
| 30–39 | 24.2 ± 1.7 | 20.4 ± 1.7 | 24.7 ± 1.7 | 16.6 ± 1.0 | 16.9 ± 1.7 | 16.7 ± 0.9 | ||
| 40–49 | 20.9 ± 1.6 | 24.6 ± 2.0 | 22.1 ± 1.2 | 22.9 ± 1.0 | 22.3 ± 1.5 | 24.6 ± 1.2 | ||
| 50–59 | 12.1 ± 1.2 | 13.1 ± 1.4 | 14.8 ± 1.4 | 19.1 ± 1.1 | 21.1 ± 1.8 | 18.9 ± 1.4 | ||
| 60–69 | 6.8 ± 0.7 | 6.2 ± 0.7 | 6.9 ± 0.6 | 13.8 ± 1.0 | 14.2 ± 1.2 | 15.7 ± 1.1 | ||
| ≥70 | 7.6 ± 0.7 | 7.2 ± 0.7 | 8.3 ± 0.5 | 11.9 ± 0.8 | 16.5 ± 1.1 | 14.9 ± 0.8 | ||
| Mean age (yr ± se) | 41.3 ± 0.5 | 41.3 ± 0.6 | 42.7 ± 0.5 | 0.0047c | 48.1 ± 0.4 | 51.4 ± 0.6 | 50.9 ± 0.6 | <0.0001c |
| Sex (% ± se) | ||||||||
| Male | 62.7 ± 1.5 | 61.6 ± 2.1 | 56.6 ± 1.5 | 0.0210 | 33.0 ± 1.1 | 43.8 ± 2.2 | 45.4 ± 1.4 | <0.0001 |
| Female | 37.3 ± 1.5 | 38.4 ± 2.1 | 43.4 ± 1.5 | 66.9 ± 1.1 | 56.2 ± 2.2 | 54.6 ± 1.4 | ||
| Race/ethnicity (% ± se) | ||||||||
| NH White | 46.2 ± 3.0 | 69.0 ± 2.2 | 86.0 ± 1.7 | <0.0001 | 58.0 ± 2.9 | 81.2 ± 2.3 | 89.8 ± 1.8 | <0.0001 |
| NH Black | 26.4 ± 2.3 | 8.0 ± 1.2 | 2.1 ± 0.3 | 23.1 ± 2.3 | 5.9 ± 1.1 | 2.0 ± 0.3 | ||
| Mexican-American | 11.0 ± 1.5 | 9.6 ± 1.0 | 5.4 ± 0.9 | 9.7 ± 1.8 | 6.8 ± 1.2 | 3.9 ± 0.9 | ||
| Other | 16.3 ± 1.8 | 13.5 ± 2.1 | 6.4 ± 1.1 | 9.2 ± 1.6 | 6.0 ± 1.1 | 4.2 ± 1.1 | ||
| Education (% ± se) | ||||||||
| Less than high school | 24.5 ± 1.6 | 15.2 ± 1.4 | 14.4 ± 1.4 | <0.0001 | 23.3 ± 1.3 | 18.1 ± 1.4 | 15.5 ± 1.2 | 0.0001 |
| High school | 21.3 ± 1.8 | 22.6 ± 1.9 | 26.9 ± 1.4 | 27.9 ± 1.5 | 23.8 ± 1.7 | 30.8 ± 1.5 | ||
| More than high school | 54.2 ± 2.1 | 62.1 ± 2.0 | 58.7 ± 2.0 | 48.8 ± 1.8 | 58.1 ± 2.5 | 53.7 ± 1.6 | ||
| Poverty Income ratio (% ± se) | ||||||||
| Poor: <125% | 22.5 ± 1.5 | 19.3 ± 2.3 | 14.7 ± 1.1 | <0.0001 | 26.5 ± 1.6 | 16.7 ± 1.8 | 14.3 ± 1.6 | <0.0001 |
| Near poor: 125–<300% | 34.8 ± 1.7 | 27.8 ± 2.3 | 27.6 ± 1.4 | 33.3 ± 1.4 | 29.0 ± 2.0 | 30.1 ± 1.6 | ||
| Not poor: >300% | 42.7 ± 2.1 | 52.9 ± 3.3 | 57.7 ± 1.7 | 40.2 ± 1.9 | 54.2 ± 3.2 | 55.6 ± 2.4 | ||
| Vigorous activity over the past 30 d (% ± se) | ||||||||
| No | 68.4 ± 1.9 | 57.0 ± 2.5 | 50.4 ± 1.8 | <0.0001 | 77.5 ± 1.1 | 72.4 ± 2.0 | 70.8 ± 1.6 | 0.0470 |
| Yes | 31.5 ± 1.9 | 42.9 ± 2.5 | 49.6 ± 1.8 | 22.5 ± 1.1 | 27.6 ± 2.0 | 29.1 ± 1.6 | ||
| Missing | 0.0 ± 0.0 | 0.0 ± 0.0 | 0.0 ± 0.0 | 0.0 ± 0.0 | 0.0 ± 0.0 | 0.0 ± 0.0 | ||
| PA compared with age peers (% ± se) | ||||||||
| Less | 18.3 ± 1.3 | 14.7 ± 1.3 | 10.1 ± 0.7 | <0.0001 | 35.0 ± 1.4 | 25.9 ± 1.8 | 19.2 ± 1.1 | <0.0001 |
| About the same | 46.2 ± 1.6 | 41.9 ± 2.6 | 39.9 ± 1.1 | 40.8 ± 1.2 | 40.2 ± 1.8 | 46.8 ± 1.8 | ||
| More | 34.0 ± 1.6 | 42.8 ± 2.1 | 48.5 ± 1.3 | 23.1 ± 1.2 | 31.9 ± 1.5 | 32.2 ± 1.5 | ||
| Missing | 1.5 ± 0.3 | 0.5 ± 0.2 | 1.6 ± 3.5 | 1.0 ± 0.3 | 1.9 ± 0.6 | 1.6 ± 0.3 | ||
| (Continued) | ||||||||
Table 1A.
Continued
| CO− (n = 4092)
|
CO+ (n = 4501)
|
|||||||
|---|---|---|---|---|---|---|---|---|
| 25(OH)D level
|
P value | 25(OH)D level
|
P value | |||||
| <20 ng/ml | 20–<25 ng/ml | ≥25 ng/ml | <20 ng/ml | 20–<25 ng/ml | ≥25 ng/ml | |||
| MET × h/wk (% ± se) | ||||||||
| 0–<5 | 64.3 ± 1.6 | 54.1 ± 2.2 | 46.8 ± 1.6 | <0.0001 | 68.8 ± 1.6 | 63.9 ± 1.7 | 55.0 ± 2.0 | <0.0001 |
| 5–10 | 15.9 ± 1.0 | 19.8 ± 1.7 | 23.5 ± 1.5 | 14.6 ± 1.1 | 14.2 ± 1.6 | 20.9 ± 1.4 | ||
| >10 | 19.8 ± 1.5 | 26.1 ± 2.3 | 29.7 ± 1.2 | 16.5 ± 1.2 | 21.9 ± 1.6 | 24.1 ± 1.4 | ||
| Waist circumference, cm (mean ± se) | 86.3 ± 0.28 | 86.5 ± 0.36 | 85.3 ± 0.2 | 0.0039 | 109.4 ± 0.42 | 107.6 ± 0.59 | 105.4 ± 0.40 | <0.0001 |
| 2005 HEI (mean ± se) | ||||||||
| n | 1254 | 806 | 1686 | 1878 | 909 | 1364 | ||
| HEI1: total fruit (includes 100% juice) | 2.40 ± 0.07 | 2.35 ± 0.10 | 2.44 ± 0.07 | 0.2355 | 2.25 ± 0.08 | 2.42 ± 0.09 | 2.37 ± 0.07 | 0.0171 |
| HEI2: whole fruit (not juice) | 2.59 ± 0.08 | 2.55 ± 0.11 | 2.63 ± 0.08 | 0.1123 | 2.43 ± 0.08 | 2.62 ± 0.10 | 2.60 ± 0.06 | 0.0021 |
| HEI3: total vegetables | 2.88 ± 0.05 | 2.94 ± 0.08 | 2.94 ± 0.04 | 0.1347 | 2.97 ± 0.04 | 2.92 ± 0.08 | 3.02 ± 0.05 | 0.1577 |
| HEI4: dark green and orange vegetables and legumes | 0.87 ± 0.05 | 0.99 ± 0.06 | 0.98 ± 0.04 | 0.1128 | 0.97 ± 0.04 | 0.92 ± 0.06 | 0.89 ± 0.04 | 0.3128 |
| HEI5: total grains | 4.04 ± 0.03 | 4.20 ± 0.03 | 4.02 ± 0.04 | 0.0440 | 4.19 ± 0.03 | 4.18 ± 0.05 | 4.02 ± 0.04 | 0.0530 |
| HEI6: whole grains | 0.96 ± 0.05 | 1.12 ± 0.07 | 1.24 ± 0.05 | <0.0001 | 1.06 ± 0.05 | 1.28 ± 0.07 | 1.26 ± 0.03 | <0.0001 |
| HEI7: dairy | 4.03 ± 0.12 | 4.60 ± 0.15 | 5.14 ± 0.10 | <0.0001 | 4.22 ± 0.09 | 4.84 ± 0.14 | 5.17 ± 0.14 | <0.0001 |
| HEI8: meat and beans | 7.92 ± 0.11 | 8.17 ± 0.11 | 7.76 ± 0.09 | 0.0027 | 8.19 ± 0.10 | 7.98 ± 0.14 | 8.04 ± 0.09 | 0.0275 |
| HEI9: oils | 5.15 ± 0.10 | 5.32 ± 0.11 | 5.60 ± 0.09 | 0.0002 | 5.58 ± 0.10 | 5.67 ± 0.12 | 5.77 ± 0.12 | 0.1464 |
| HEI10: saturated fat | 6.29 ± 0.13 | 6.12 ± 0.16 | 5.83 ± 0.11 | 0.0076 | 5.75 ± 0.12 | 5.43 ± 0.13 | 5.30 ± 0.12 | <0.0001 |
| HEI11: sodium | 4.35 ± 0.11 | 4.23 ± 0.12 | 4.39 ± 0.10 | 0.7342 | 3.88 ± 0.10 | 4.08 ± 0.14 | 3.97 ± 0.09 | 0.8407 |
| HEI12: calories from solid fat, alcohol, and added sugar | 7.91 ± 0.32 | 8.95 ± 0.26 | 8.19 ± 0.21 | 0.0053 | 8.76 ± 0.27 | 8.82 ± 0.35 | 8.94 ± 0.17 | 0.0149 |
| HEItotal | 49.1 ± 0.0.6 | 51.3 ± 0.6 | 51.0 ± 0.5 | 0.0007 | 50.0 ± 0.6 | 51.0 ± 0.7 | 51.2 ± 0.4 | <0.001 |
For 25(OH)D, 1 ng/ml is equivalent to 2.496 nmol/liter. MET, Metabolic equivalent tasks.
P value associated with designed-based F value comparing proportions between CO+ and CO− subgroups.
P value (and all subsequent ones with categorical variables) associated with designed-based F value comparing proportions between 25(OH)D levels within each central obesity subgroup.
P value (and all subsequent ones with continuous variables) associated with non-designed-based F value comparing means between 25(OH)D levels within each central obesity subgroup.
Table 2.
Mean and se of HEI, 25(OH)D, %BF, and selected MetD by central obesity status among U.S. adults: NHANES 2001–2004
| CO− (n = 4092)
|
CO+ (n = 4501)
|
P value | |||||
|---|---|---|---|---|---|---|---|
| N | Mean | se | N | Mean | se | ||
| Waist circumference (cm) | 4092 | 85.78 | 0.14 | 4501 | 107.42 | 0.33 | <0.001 |
| HEItotal | 3921 | 50.52 | 0.37 | 4346 | 50.60 | 0.38 | 0.003 |
| HEIdairy | 3921 | 4.73 | 0.09 | 4346 | 4.74 | 0.08 | 0.872 |
| 25(OH)D (ng/ml) | 3896 | 25.71 | 0.43 | 4288 | 22.76 | 0.46 | <0.001 |
| %BF | 4077 | 28.68 | 0.19 | 4474 | 39.4 | 0.23 | <0.001 |
| MAP (mm Hg) | 3962 | 86.80 | 0.33 | 4308 | 90.5 | 0.30 | <0.001 |
| Fasting blood glucose (mg/dl) | 1957 | 96.24 | 0.43 | 2159 | 105.74 | 0.78 | <0.001 |
| TG (mg/dl) | 1894 | 125.46 | 2.77 | 2136 | 171.51 | 6.49 | <0.001 |
| HDL-C (mg/dl) | 2069 | 53.84 | 0.53 | 2011 | 48.66 | 0.49 | <0.001 |
| HOMA-IRa | 1890 | 1.87 | 0.03 | 2127 | 4.04 | 0.12 | <0.001 |
| Uric acid (mg/dl) | 3897 | 5.24 | 0.03 | 4292 | 5.72 | 0.05 | <0.001 |
| CRP (mg/liter) | 3924 | 3.04 | 0.23 | 4321 | 5.42 | 0.26 | <0.001 |
| Index Ib | 1017 | 1.48 | 0.03 | 1026 | 3.12 | 0.07 | <0.001 |
HOMA-IR is the product of the fasting values of glucose (G0, expressed as millimoles per liter) and insulin (I0, expressed as microunits per milliliter); HOMA-IR = (I0 × G0)/22.5.
Index I is the sum of all binary disturbances (range 0–7).
Comparing CO+ with CO− in terms of mean 25(OH)D level while adjusting for potentially confounding factors in an ordinary least square (OLS) multiple linear regression model (Fig. 3) we found that on average the age- and sex-adjusted difference was −3.2 ng/ml (95% CI = −3.8 to −2.6). Further adjustment for other sociodemographic, lifestyle, and dietary factors (HEItotal) attenuated this difference to −2.2 ng/ml (P < 0.05). When adding %BF into the OLS model, the difference was markedly attenuated to −0.2 ng/ml and became statistically nonsignificant (P > 0.05).
Figure 3.

Mean difference in 25(OH)D by central obesity status (CO+ or CO−): OLS multiple linear regression findings (β with 95% CI), adjusting for sociodemographic, lifestyle, dietary factors, and % BF (NHANES 2001–2004). *, P < 0.05 for null hypothesis that adjusted β = 0 from OLS multiple linear regression, Wald test. For model 1, 25(OH)D is regressed on central obesity, adjusted for age and sex (n = 8184); model 2 adjusted for all sociodemographic, lifestyle, and dietary variables (see Covariates in Materials and Methods) (n = 7300); and model 3 further adjusted for %BF (n = 7278).
Tables 3 and 4 present findings of a series of OLS multiple linear regression models with main outcomes being %BF and selected MetD, simultaneously including HEI and 25(OH)D as main exposure variables, adjusting for sociodemographic and lifestyle factors, and stratifying by CO status (models 1a and 1b). Moreover, effect modification by CO status was examined when the main exposure was 25(OH)D (model 1c) and HEI (model 1d). Overall (models 1a and 1b), 25(OH)D level was inversely related to %BF (both subgroups), MAP (CO− group), fasting glucose (CO+ group), TG (both subgroups), HOMA-IR (both subgroups), uric acid (CO− group), and CRP (CO+ group). Based on model 1c, significant interaction between 25(OH)D and central obesity was observed in the cases of %BF, fasting blood glucose, HOMA-IR, and CRP, but not MAP, indicating a stronger inverse association among the CO+ group [P < 0.05 for 25(OH)D × CO interaction term; Wald test]. This interaction remained statistically significant (P < 0.05) even after controlling for %BF in the cases of blood glucose, HOMA-IR, and CRP (data not shown). Examining Index I, a similar pattern of interaction was observed whereby the inverse association between 25(OH)D and this index was stronger among the CO+ group. However, the 25(OH)D × CO interaction term became only borderline significant (P = 0.07) when %BF was added to the model (data not shown).
Table 3.
Dietary quality and 25(OH)D levels (z-scores) vs. %BF and selected MetD in CO+ vs. CO− U.S. adults: findings from OLS regression models (NHANES 2001–2004)
| %BF
|
MAP (mm Hg)
|
Fasting blood glucose (mg/dl)
|
TG (mg/dl)
|
HDL-C (mg/dl)
|
|||||||||||
|---|---|---|---|---|---|---|---|---|---|---|---|---|---|---|---|
| β | se | P value | β | se | P value | β | se | P value | β | se | P value | β | se | P value | |
| Effect of 25(OH)Da | |||||||||||||||
| Model 1a: CO− | |||||||||||||||
| 25(OH)D | −0.54 | 0.09 | <0.001 | −0.98 | 0.25 | <0.001 | −0.58 | 0.44 | 0.204 | −8.44 | 3.78 | 0.033 | 1.37 | 0.66 | 0.057 |
| Model 1b: CO+ | |||||||||||||||
| 25(OH)D | −0.72 | 0.09 | <0.001 | −0.81 | 0.59 | 0.179 | −4.13 | 0.85 | <0.001 | −26.8 | 10.0 | 0.012 | 1.68 | 0.83 | 0.061 |
| Model 1c: add interaction term | |||||||||||||||
| 25(OH)D | −0.53 | 0.07 | <0.001 | −0.98 | 0.24 | <0.001 | −0.16 | 0.46 | 0.734 | −11.04 | 4.09 | 0.011 | 1.27 | 0.67 | 0.077 |
| CO | 7.77 | 0.14 | <0.001 | 2.86 | 0.42 | <0.001 | 7.70 | 0.96 | <0.001 | 44.67 | 9.02 | <0.001 | −6.94 | 0.82 | <0.001 |
| 25(OH)D × CO | −0.31 | 0.12 | 0.012 | 0.21 | 0.55 | 0.709 | −4.29 | 0.82 | <0.001 | −13.02 | 8.63 | 0.142 | 0.68 | 0.54 | 0.230 |
| Effect of HEItotala | |||||||||||||||
| Model 1a: CO− | |||||||||||||||
| HEItotal | −0.13 | 0.10 | 0.200 | −0.25 | 0.33 | 0.455 | 0.23 | 0.47 | 0.620 | −1.50 | 3.27 | 0.650 | 0.23 | 0.41 | 0.578 |
| Model 1b: CO+ | |||||||||||||||
| HEItotal | 0.04 | 0.11 | 0.687 | −0.30 | 0.40 | 0.461 | −0.29 | 1.02 | 0.778 | 1.57 | 6.45 | 0.809 | 1.02 | 0.46 | 0.043 |
| Model 1d: add interaction term | |||||||||||||||
| HEItotal | 0.04 | 0.09 | 0.682 | 0.05 | 0.32 | 0.867 | 0.72 | 0.53 | 0.182 | 0.73 | 3.48 | 0.835 | 0.06 | 0.29 | 0.829 |
| CO | 7.69 | 0.14 | <0.001 | 2.87 | 0.41 | <0.001 | 7.25 | 0.79 | <0.001 | 42.17 | 8.10 | <0.001 | −7.84 | 0.55 | <0.001 |
| HEItotal × CO | −0.14 | 0.13 | 0.289 | −0.60 | 0.48 | 0.215 | 0.30 | 1.03 | 0.773 | −0.32 | 7.35 | 0.965 | 0.74 | 0.44 | 0.117 |
OLS models controlled for age groups, sex, education (dummies for high school and more than high school), poverty income ratio (dummies for near poor and not poor), race/ethnicity (dummies for non-Hispanic Black, Mexican-American, and others); categorical metabolic equivalent tasks (MET) × hours per week; and two other measures of PA (vigorous and activity compared with others). In all models, the main effects of 25(OH)D and HEItotal were also entered.
For 25 (OH)D, 1 sd corresponded to 9.43 ng/ml (see Table 1 footnote for conversion to SI units); 1 sd of HEItotal corresponded to 13.12 points.
Sample sizes for model 1a were as follows: %BF (n = 3467); MAP (n = 3392); fasting blood glucose (n = 1679); TG (n = 1675); HDL-C (n = 1815). Sample sizes for model 1b were as follows: %BF (n = 3811); MAP (n = 3698); fasting blood glucose (n = 1908); TG (n = 1907); HDL-C (n = 1829). Sample sizes for models 1c and 1d were the sum of sample sizes for models 1a and 1b for each outcome.
Table 4.
Dietary quality and 25(OH)D level (z-scores) vs. other and total number of MetD (Index I) in CO+ vs. CO− U.S. adults: findings from OLS regression models (NHANES 2001–2004)
| HOMA-IR
|
Uric acid (mg/dl)
|
CRP (mg/liter)
|
Index I: sum of all binary disturbances (range: 0–7)
|
|||||||||
|---|---|---|---|---|---|---|---|---|---|---|---|---|
| β | se | P value | β | se | P value | β | se | P value | β | se | P value | |
| Effect of 25(OH)D | ||||||||||||
| Model 1a: CO− | ||||||||||||
| 25(OH)D | −0.14 | 0.03 | <0.001 | −0.05 | 0.03 | 0.043 | 0.1 | 0.2 | 0.726 | 0.03 | 0.04 | 0.577 |
| Model 1b: CO+ | ||||||||||||
| 25(OH)D | −0.58 | 0.09 | <0.001 | −0.02 | 0.03 | 0.607 | −0.6 | 0.2 | 0.008 | −0.24 | 0.07 | 0.012 |
| Model 1c: add interaction term | ||||||||||||
| 25(OH)D | −0.52 | 0.04 | 0.227 | −0.04 | 0.02 | 0.061 | 0.1 | 2.0 | 0.593 | −0.03 | 0.04 | 0.477 |
| CO | 2.10 | 0.16 | <0.001 | 0.68 | 0.04 | <0.001 | 1.9 | 0.2 | <0.001 | 1.46 | 0.09 | <0.001 |
| 25(OH)D×CO | −0.63 | 0.09 | <0.001 | 0.01 | 0.03 | 0.840 | −0.7 | 0.2 | <0.001 | −0.21 | 0.09 | 0.027 |
| Effect of HEItotal | ||||||||||||
| Model 1a: CO− | ||||||||||||
| HEItotal | −0.04 | 0.04 | 0.311 | −0.07 | 0.03 | 0.012 | −0.2 | 0.1 | 0.147 | −0.11 | 0.06 | 0.069 |
| Model 1b: CO+ | ||||||||||||
| HEItotal | 0.02 | 0.13 | 0.867 | 0.01 | 0.02 | 0.763 | −0.4 | 0.1 | 0.009 | −0.05 | 0.07 | 0.487 |
| Model 1d: add interaction term | ||||||||||||
| HEItotal | 0.11 | 0.04 | 0.004 | −0.02 | 0.03 | 0.485 | −0.2 | 0.1 | 0.246 | −0.09 | 0.05 | 0.098 |
| CO | 1.94 | 0.14 | <0.001 | 0.73 | 0.05 | <0.001 | 0.2 | 0.1 | <0.001 | 1.44 | 0.09 | <0.001 |
| HEItotal × CO | −0.21 | 0.15 | 0.186 | 0.07 | 0.04 | 0.089 | −0.3 | 0.2 | 0.179 | −0.01 | 0.09 | 0.901 |
OLS models controlled for age (years, grouped), sex, education (dummies for high school and more than high school), poverty income ratio (dummies for near poor and not poor), race/ethnicity (dummies for non-Hispanic Black, Mexican-American, and others), categorical metabolic equivalent tasks × hours per week, and two other measures of PA (vigorous and activity compared with others). In all models, the main effects of 25(OH)D and HEItotal were also entered. For 25 (OH)D, 1 sd corresponded to 9.43 ng/ml (see Table 1 footnote for conversion to SI units); 1 sd of HEItotal corresponded to 13.12 points. HOMA-IR is the product of the fasting values of glucose (G0, expressed as millimoles per liter) and insulin (I0, expressed as microunits per milliliter); HOMA-IR = (I0 × G0)/22.5.
Sample sizes for model 1a were as follows: HOMA-IR (n = 1672); uric acid (n = 3457); CRP (n = 3471); Index I (n = 898). Sample sizes for model 1b were as follows: HOMA-IR (n = 1902); uric acid (n = 3808); CRP (n = 3820); Index I (n = 898). Sample sizes for models 1c and 1d were the sum of sample sizes for models 1a and 1b for each outcome.
In contrast, HEItotal was not associated with any of the selected MetD, except for the inverse association with uric acid among the CO− group (although HEItotal × central obesity interaction term in model 1d was only borderline significant; P = 0.089) and the positive association with HDL-C among the CO+ group (no significant interaction with central obesity; model 1d) particularly after controlling for 25(OH)D levels. When %BF was added to the model, the interaction between HEItotal and central obesity became statistically significant in the case of uric acid (P = 0.02; data not shown).
Findings from a series of SM (Table 5) indicated that pathways from dietary quality to Index I MetD through 25(OH)D and %BF differed significantly by CO status. In fact, among the CO− group (model 1 with HEItotal), overall dietary quality was inversely related to %BF, an association not mediated by 25(OH)D but had no direct effect on Index I MetD. The 25(OH)D level was inversely related to %BF, which in turn was positively associated with Index I MetD. In contrast, among the CO+ group, HEItotal had no significant associations with any of the three outcomes. 25(OH)D was negatively associated with both %BF and Index I, while %BF was positively associated with Index I disturbances.
Table 5.
Pathway from dietary quality (overall and dairy intake component) to Index I MetD through 25(OH)D and %BF: findings from SM model stratified by central obesity status (NHANES 2001–2004)
| CO− (n = 895)
|
CO+ (n = 892)
|
|||||
|---|---|---|---|---|---|---|
| α | se | t statistic | α | se | t statistic | |
| Model 1: overall diet quality | ||||||
| Path coefficients (α) from HEItotala | ||||||
| HEItotala → 25(OH)D (α12) | +0.025 | 0.030 | +0.82 | +0.031 | 0.026 | +1.20 |
| HEItotal → %BF (α13) | −0.391 | 0.161 | −2.43b | +0.224 | 0.148 | +1.51 |
| HEItotal → Index I (α14) | −0.065 | 0.048 | +1.34 | −0.078 | 0.055 | −1.43 |
| Path coefficients from 25(OH)Da | ||||||
| 25(OH)Da → %BF (α23) | −0.450 | 0.175 | −2.57b | −0.770 | 0.172 | −4.46b |
| 25(OH)D → Index I (α24) | −0.070 | 0.048 | −1.46 | −0.244 | 0.060 | −4.04b |
| Path coefficients from %BF | ||||||
| %BF → Index I (α34) | +0.078 | 0.009 | +7.98b | +0.034 | 0.012 | +2.84b |
| Model 2: dairy component of HEI | ||||||
| Path coefficients from HEIdairya | ||||||
| HEIdairy → 25(OH)D (α12) | +0.027 | 0.008 | +3.15b | +0.033 | 0.008 | +4.04b |
| HEIdairy → %BF (α13) | +0.006 | 0.046 | +0.13 | +0.044 | 0.045 | +0.99 |
| HEIdairy → Index I (α14) | −0.017 | 0.013 | −1.28 | −0.043 | 0.016 | −2.61b |
| Path coefficients from 25(OH)Da | ||||||
| 25(OH)D → %BF (α23) | −0.465 | 0.177 | −2.63b | −0.790 | 0.174 | −4.55b |
| 25(OH)D → Index I (α24) | −0.062 | 0.049 | −1.26 | −0.220 | 0.061 | −3.61b |
| Path coefficients from %BF | ||||||
| %BF → Index I (α34) | +0.080 | 0.010 | +8.18b | +0.035 | 0.012 | +2.89b |
See Materials and Methods for detailed description of Index I, which could range between 0 and 7. Exogenous variables Z considered in the model included age (years), sex, education (dummies for high school and more than high school), poverty income ratio (dummies for near poor and not poor), race/ethnicity (dummies for non-Hispanic Black, Mexican-American, and others), continuous metabolic equivalent tasks × hours per week, and two other measures of PA (vigorous and activity compared to others). Model 1 fit statistics were as follows: for CO−, χ2 [degrees of freedom (d.f.) = 40] = 50.92, P = 0.1154, RMSEA = 0.02, 90% CI = 0.00–0.03, and AGFI = 0.9735; for CO+, χ2 (d.f. = 50) = 62.80, P = 0.1056, RMSEA = 0.02, 90% CI = 0.00–0.03, and AGFI = 0.9735. Model 2 fit statistics were as follows: for CO−, χ2 (d.f. = 46) = 57.7, P = 0.116, RMSEA = 0.02, 90% CI = 0.00–0.03, and AGFI = 0.9739; for CO+, χ2 (d.f. = 56) = 77.96, P = 0.0278, RMSEA = 0.02, 90% CI = 0.01–0.03, and AGFI = 0.9706.
HEItotal and 25(OH) D were included as standardized z-cores. For 25(OH)D, 1 sd corresponded to 9.43 ng/ml (see Table 1 footnote for conversion to SI units); 1 sd of HEItotal corresponded to 13.12 points. HEIdairy, %BF, and Index I were entered as is.
P < 0.05 for null hypothesis that path coefficient α = 0.
Examining HEIdairy (model 2), among the CO− group, dairy consumption was positively associated with 25(OH)D but had no direct effects on %BF or Index I. 25(OH)D in turn was associated with a reduced %BF, which in turn was positively associated with Index I. This indicates pseudo-complete mediation of the HEIdairy-Index I association through 25(OH)D and %BF. Among the CO+ group, however, dairy consumption was both positively associated with 25(OH)D and had a direct inverse relationship with Index I but not with %BF. The inverse association between 25(OH)D and Index I was significantly stronger among CO+ participants, as was found in Table 4, with nonoverlapping 95% CI between the two groups.
Discussion
The present study is, to our knowledge, the first to examine the complex relationships among 25(OH)D, dietary quality, %BF, and MetD in a nationally representative sample of U.S. adults, stratifying by central obesity status. Our study had several key findings. We found a stronger inverse association of 25(OH)D with those MetD among the CO+ compared with the CO− participants, which is indicated by a significant interaction between 25(OH)D and central obesity in predicting %BF, fasting blood glucose, HOMA-IR, CRP, and total disturbances as measured by NCEP criteria and all other criteria (Index I). Second, we found that 25(OH)D was positively associated with overall dietary quality (measured by HEI) and showed a linear dose response with the dairy component of HEI among the CO− and CO+ groups. U.S. adults with central obesity had lower 25(OH)D, higher %BF, and increased average MetD.
Moreover, based on SM, the main pathway between HEIdairy and Index I involved predominant mediation by 25(OH)D followed by %BF among the CO− group and a nonsignificant direct association between HEIdairy and %BF or Index I as well as the lack of a direct association between 25(OH)D and Index I. Among the CO+ group, however, 25(OH)D had a significant direct inverse association with Index I in addition to its indirect inverse association with %BF, which in turn was positively associated with Index I. Moreover, HEIdairy had a direct inverse association with Index I that was independent of 25(OH)D and %BF.
Findings from a number of previous epidemiological studies indicate a protective role of 25(OH)D against various metabolic disorders and metabolic syndrome. Several studies reported that 25(OH)D was inversely related to %BF (17,29), to elevated blood pressure (20,21,23,30,31,33), elevated glucose or insulin resistance (22,26,28,31,33), and TG (23) and positively associated with HDL-C (22). In particular, studies using NHANES III (1988–1994) (26,28,29,30,33) have consistently found those associations among U.S. adults. Moreover, one recent study using NHANES 2003–2004 found an inverse relationship with NCEP ATP III-defined metabolic syndrome (25). This finding was replicated in other populations (19). Furthermore, both overall dietary quality and dairy intake were shown to be independent dietary factors that were inversely associated with adiposity (35,38,39) and many MetD (34,40,41) as well as with the metabolic syndrome (34,40,41). One recent randomized controlled clinical trial found that vitamin D supplementation did not affect adiposity but had a significant effect on other metabolic disturbances in the desired direction, including TG and inflammatory markers such as TNF-α. However, it was positively associated with increased low-density lipoprotein-cholesterol among others, and thus, additional trials are indicated to ascertain the general beneficial effect of vitamin D supplementation (67). Thus, these earlier findings are in line with ours, although none of the previous studies had examined effect modification by central obesity status.
The biological mechanism by which vitamin D may influence the metabolic syndrome has not been completely elucidated. Nevertheless, there is accumulating evidence from clinical and experimental studies suggesting that decreased vitamin D is related to insulin resistance (68), a hallmark characteristic of the metabolic syndrome in general and central obesity in particular. Adequate vitamin D status has been linked to enhanced biosynthetic capacity of pancreatic β-cells and the conversion of proinsulin to insulin. These notions are further supported by the fact that pancreatic β-cells and several classical target organs for insulin action express vitamin D receptors (69,70) and the 1α-hydroxylase enzyme, required to convert 25(OH)D to its active form (71,72). Our study observed that the protective effects of vitamin D on the various MetD (including insulin resistance as measured by HOMA-IR) seem to be stronger among the CO+ group [who had lower serum 25(OH)D levels] compared with the CO− group. These differences might be attributed to polymorphisms in the VDR gene that need to be explored in future genetic studies.
To explain the adiposity (%BF or central obesity status) vs. serum 25(OH)D inverse association, it was hypothesized that obesity status is associated with less bioavailability of the fat-soluble vitamin D, by its sequestration into excessive fat tissues (73). Furthermore, a high incidence of secondary hyperparathyroidism regulated by serum 1,25-dihydroxyvitamin D levels have been reported in obese subjects (74). These increased levels of active vitamin D may be responsible for a negative feedback inhibition of hepatic 25(OH)D synthesis (74), although the opposite was found in more recent studies (75,76). Moreover, some investigators have demonstrated that increased intracellular calcium, which is regulated by vitamin D and inversely related to dairy consumption, was responsible for stimulating lipogenesis and suppression of lipolysis (77). It is also possible that the lactose, protein, and fat in dairy foods may enhance satiety and reduce the risk of obesity, particularly central adiposity, relative to other high-carbohydrate foods and beverages (78).
In addition, 1,25-dihydroxyvitamin D, the active form of vitamin D3, is known to down-regulate the renin-angiotensin system (79), which itself plays an important role in hypertension as well as the development of insulin resistance. For the former effect, there is evidence that activation of the renal calcium receptors leads to increased prostaglandin E2 synthesis with subsequent natriuresis and blood pressure-lowering effects (80). The latter effect is mediated by various pathways in the insulin signaling cascade including the insulin receptor, the insulin receptor substrate, and phosphatidylinositol 3-kinase (81).
Finally, we have observed in our SM that among the CO+ group, the intake of dairy products as measured by HEIdairy has a direct negative association with MetD (Index I) independently of 25(OH)D or %BF. This alternative pathway is likely due to additional bioactive compounds in dairy products for which CO+ subjects may be more in need of than the CO− group, and these substances do not raise vitamin D and do not necessarily affect adiposity. The exact nature of these compounds is yet to be determined.
Our study had a number of strengths. First, it is a population-based large nationally representative study with ethnic diversity taken into account. Second, it used DXA scan measures to estimate %BF using standard radiological techniques. Third, the assay for 25(OH)D measurement is of high accuracy and had a coefficient of variation of less than 10%.
Despite its strengths, our study had several limitations. First, it is based on cross-sectional data and thus cannot test causality. It is possible that obese people, including CO+ patients, may have modified their lifestyles including diet and outdoors activities, which may contribute to their lower level of 25(OH)D than their CO− counterparts. DXA scans were less accurate at higher body mass index levels, in part due to truncal adiposity, and older persons were more likely to be excluded for DXA scans in general than their younger counterparts (82). Second, dietary intake was assessed using a single 24-h recall that may not be a good reflection of usual intake. In addition, intake of vitamin D was not readily available, and dairy consumption as measured by HEIdairy was considered as a proxy. Fourth, timing of blood sample collection and differences in latitude may have affected the distribution of serum 25(OH)D levels the measurement of which may be overestimated, because the antibody also recognizes 24,25-dihydroxyvitamin D, which includes 10–15% of the 25(OH)D value. Finally, the NHANES data does not control for seasonal influence on serum 25(OH)D levels, despite our efforts to adjust for sunlight exposure by various proxy measures of PA.
In conclusion, we found that among U.S. adults, a higher 25(OH)D was associated with higher HEI, lower %BF, and lower MetD. Furthermore, the 25(OH)D-%BF and 25(OH)D-MetD inverse associations were stronger among U.S. adults with central obesity. Finally, the pathway linking HEI (dairy consumption in particular) to MetD through 25(OH)D and %BF differed markedly by central obesity status. This highlights potential genetic differences related to central obesity, which may affect responsiveness to environmental changes in dietary exposures and 25(OH)D status. Suggesting that improvement of vitamin D status in the CO+ group will alleviate MetD symptoms cannot be concluded from these observational data. Lifestyle change remains the advice for metabolic syndrome patients until proven otherwise in a randomized controlled trial that raises 25(OH)D and attenuates metabolic disturbances. Future longitudinal studies should ascertain temporality by examining associations between baseline dietary exposures and changes in 25(OH)D, %BF, and MetD. Genetic markers related to obesity and insulin resistance, including vitamin D receptor polymorphisms (44,45,83,84,85), should be studied as effect modifiers in the 25(OH)D-%BF and 25(OH)D-MetD associations. Nevertheless, our findings that U.S. adults with central obesity had a lower level of 25(OH)D and saw a stronger inverse association between 25(OH)D and MetD suggest the need of effort to empower them to make related behavioral changes to help improve their vitamin D status.
Acknowledgments
We thank Drs. Melissa Kitner-Triolo and Lori L. Beason-Held for their internal review of the manuscript.
Footnotes
This study was supported by the National Institute on Aging, Intramural Research Program (NIA/NIH/IRP).
Disclosure Summary: The authors have no conflict of interest to disclose.
First Published Online May 12, 2010
Abbreviations: AGFI, Goodness of fit index adjusted for degrees of freedom; %BF, percent body fat; CI, confidence interval; CO+, with central obesity; CO−, without central obesity; CRP, C-reactive protein; 25(OH)D, 25-hydroxyvitamin D; DBP, diastolic blood pressure; DXA, dual-energy x-ray absorptiometry; HDL-C, high-density lipoprotein-cholesterol; HEI, healthy eating index; HOMA-IR, homeostatic model assessment for insulin resistance; MAP, mean arterial pressure; MEC, mobile examination center; MetD, metabolic disturbance; MET, metabolic equivalent; NCEP ATP III, National Cholesterol Education Program, Adult Treatment Panel III; NHANES, National Health and Nutrition Examination Surveys; OLS, ordinary least square; PA, physical activity; RMSEA, root mean square error of approximation; SBP, systolic blood pressure; SM, structural equations modeling; TG, triglycerides.
References
- Mølgaard C, Michaelsen KF 2003 Vitamin D and bone health in early life. Proc Nutr Soc 62:823–828 [DOI] [PubMed] [Google Scholar]
- Smith P, Barzel US 1984 Vitamin D deficiency osteomalacia in elderly persons. Compr Ther 10:24–32 [PubMed] [Google Scholar]
- Rizzoli R, Eisman JA, Norquist J, Ljunggren O, Krishnarajah G, Lim SK, Chandler J 2006 Risk factors for vitamin D inadequacy among women with osteoporosis: an international epidemiological study. Int J Clin Pract 60:1013–1019 [DOI] [PubMed] [Google Scholar]
- Lips P 2007 Vitamin D status and nutrition in Europe and Asia. J Steroid Biochem Mol Biol 103:620–625 [DOI] [PubMed] [Google Scholar]
- Poole KE, Loveridge N, Barker PJ, Halsall DJ, Rose C, Reeve J, Warburton EA 2006 Reduced vitamin D in acute stroke. Stroke 37:243–245 [DOI] [PubMed] [Google Scholar]
- Giovannucci E, Liu Y, Hollis BW, Rimm EB 2008 25-Hydroxyvitamin D and risk of myocardial infarction in men: a prospective study. Arch Intern Med 168:1174–1180 [DOI] [PMC free article] [PubMed] [Google Scholar]
- Dobnig H, Pilz S, Scharnagl H, Renner W, Seelhorst U, Wellnitz B, Kinkeldei J, Boehm BO, Weihrauch G, Maerz W 2008 Independent association of low serum 25-hydroxyvitamin D and 1,25-dihydroxyvitamin D levels with all-cause and cardiovascular mortality. Arch Intern Med 168:1340–1349 [DOI] [PubMed] [Google Scholar]
- Garland CF, Garland FC, Gorham ED, Lipkin M, Newmark H, Mohr SB, Holick MF 2006 The role of vitamin D in cancer prevention. Am J Public Health 96:252–261 [DOI] [PMC free article] [PubMed] [Google Scholar]
- Garland CF, Gorham ED, Mohr SB, Grant WB, Giovannucci EL, Lipkin M, Newmark H, Holick MF, Garland FC 2007 Vitamin D and prevention of breast cancer: pooled analysis. J Steroid Biochem Mol Biol 103:708–711 [DOI] [PubMed] [Google Scholar]
- Lin J, Manson JE, Lee IM, Cook NR, Buring JE, Zhang SM 2007 Intakes of calcium and vitamin D and breast cancer risk in women. Arch Intern Med 167:1050–1059 [DOI] [PubMed] [Google Scholar]
- Cannell JJ, Vieth R, Umhau JC, Holick MF, Grant WB, Madronich S, Garland CF, Giovannucci E 2006 Epidemic influenza and vitamin D. Epidemiol Infect 134:1129–1140 [DOI] [PMC free article] [PubMed] [Google Scholar]
- Laaksi I, Ruohola JP, Tuohimaa P, Auvinen A, Haataja R, Pihlajamäki H, Ylikomi T 2007 An association of serum vitamin D concentrations < 40 nmol/L with acute respiratory tract infection in young Finnish men. Am J Clin Nutr 86:714–717 [DOI] [PubMed] [Google Scholar]
- Wilkinson RJ, Llewelyn M, Toossi Z, Patel P, Pasvol G, Lalvani A, Wright D, Latif M, Davidson RN 2000 Influence of vitamin D deficiency and vitamin D receptor polymorphisms on tuberculosis among Gujarati Asians in west London: a case-control study. Lancet 355:618–621 [DOI] [PubMed] [Google Scholar]
- Autier P, Gandini S 2007 Vitamin D supplementation and total mortality: a meta-analysis of randomized controlled trials. Arch Intern Med 167:1730–1737 [DOI] [PubMed] [Google Scholar]
- Avenell A, Cook JA, Maclennan GS, Macpherson GC 2007 Vitamin D supplementation to prevent infections: a sub-study of a randomised placebo-controlled trial in older people (RECORD trial, ISRCTN 51647438). Age Ageing 36:574–577 [DOI] [PubMed] [Google Scholar]
- Lappe JM, Travers-Gustafson D, Davies KM, Recker RR, Heaney RP 2007 Vitamin D and calcium supplementation reduces cancer risk: results of a randomized trial. Am J Clin Nutr 85:1586–1591 [DOI] [PubMed] [Google Scholar]
- Arunabh S, Pollack S, Yeh J, Aloia JF 2003 Body fat content and 25-hydroxyvitamin D levels in healthy women. J Clin Endocrinol Metab 88:157–161 [DOI] [PubMed] [Google Scholar]
- Auwerx J, Bouillon R, Kesteloot H 1992 Relation between 25-hydroxyvitamin D3, apolipoprotein A-I, and high density lipoprotein cholesterol. Arterioscler Thromb 12:671–674 [DOI] [PubMed] [Google Scholar]
- Botella-Carretero JI, Alvarez-Blasco F, Villafruela JJ, Balsa JA, Vázquez C, Escobar-Morreale HF 2007 Vitamin D deficiency is associated with the metabolic syndrome in morbid obesity. Clin Nutr 26:573–580 [DOI] [PubMed] [Google Scholar]
- Forman JP, Curhan GC, Taylor EN 2008 Plasma 25-hydroxyvitamin D levels and risk of incident hypertension among young women. Hypertension 52:828–832 [DOI] [PMC free article] [PubMed] [Google Scholar]
- Forman JP, Giovannucci E, Holmes MD, Bischoff-Ferrari HA, Tworoger SS, Willett WC, Curhan GC 2007 Plasma 25-hydroxyvitamin D levels and risk of incident hypertension. Hypertension 49:1063–1069 [DOI] [PubMed] [Google Scholar]
- Hahn S, Haselhorst U, Tan S, Quadbeck B, Schmidt M, Roesler S, Kimmig R, Mann K, Janssen OE 2006 Low serum 25-hydroxyvitamin D concentrations are associated with insulin resistance and obesity in women with polycystic ovary syndrome. Exp Clin Endocrinol Diabetes 114:577–583 [DOI] [PubMed] [Google Scholar]
- Hyppönen E, Boucher BJ, Berry DJ, Power C 2008 25-Hydroxyvitamin D, IGF-1, and metabolic syndrome at 45 years of age: a cross-sectional study in the 1958 British Birth Cohort. Diabetes 57:298–305 [DOI] [PubMed] [Google Scholar]
- Martini LA, Wood RJ 2006 Vitamin D status and the metabolic syndrome. Nutr Rev 64:479–486 [DOI] [PubMed] [Google Scholar]
- Reis JP, von Mühlen D, Miller 3rd ER 2008 Relation of 25-hydroxyvitamin D and parathyroid hormone levels with metabolic syndrome among US adults. Eur J Endocrinol 159:41–48 [DOI] [PubMed] [Google Scholar]
- Scragg R, Sowers M, Bell C 2004 Serum 25-hydroxyvitamin D, diabetes, and ethnicity in the Third National Health and Nutrition Examination Survey. Diabetes Care 27:2813–2818 [DOI] [PubMed] [Google Scholar]
- Lind L, Hänni A, Lithell H, Hvarfner A, Sörensen OH, Ljunghall S 1995 Vitamin D is related to blood pressure and other cardiovascular risk factors in middle-aged men. Am J Hypertens 8:894–901 [DOI] [PubMed] [Google Scholar]
- Chonchol M, Scragg R 2007 25-Hydroxyvitamin D, insulin resistance, and kidney function in the Third National Health and Nutrition Examination Survey. Kidney Int 71:134–139 [DOI] [PubMed] [Google Scholar]
- Looker AC 2005 Body fat and vitamin D status in Black versus white women. J Clin Endocrinol Metab 90:635–640 [DOI] [PubMed] [Google Scholar]
- Scragg R, Sowers M, Bell C 2007 Serum 25-hydroxyvitamin D, ethnicity, and blood pressure in the Third National Health and Nutrition Examination Survey. Am J Hypertens 20:713–719 [DOI] [PubMed] [Google Scholar]
- Gannagé-Yared MH, Chedid R, Khalife S, Azzi E, Zoghbi F, Halaby G 2009 Vitamin D in relation to metabolic risk factors, insulin sensitivity and adiponectin in a young Middle-Eastern population. Eur J Endocrinol 160:965–971 [DOI] [PubMed] [Google Scholar]
- Pérez-López FR 2009 Vitamin D metabolism and cardiovascular risk factors in postmenopausal women. Maturitas 62:248–262 [DOI] [PubMed] [Google Scholar]
- Martins D, Wolf M, Pan D, Zadshir A, Tareen N, Thadhani R, Felsenfeld A, Levine B, Mehrotra R, Norris K 2007 Prevalence of cardiovascular risk factors and the serum levels of 25-hydroxyvitamin D in the United States: data from the Third National Health and Nutrition Examination Survey. Arch Intern Med 167:1159–1165 [DOI] [PubMed] [Google Scholar]
- Azadbakht L, Mirmiran P, Esmaillzadeh A, Azizi F 2006 Dietary diversity score and cardiovascular risk factors in Tehranian adults. Public Health Nutr 9:728–736 [DOI] [PubMed] [Google Scholar]
- Guo X, Warden BA, Paeratakul S, Bray GA 2004 Healthy Eating Index and obesity. Eur J Clin Nutr 58:1580–1586 [DOI] [PubMed] [Google Scholar]
- McCullough ML, Feskanich D, Rimm EB, Giovannucci EL, Ascherio A, Variyam JN, Spiegelman D, Stampfer MJ, Willett WC 2000 Adherence to the Dietary Guidelines for Americans and risk of major chronic disease in men. Am J Clin Nutr 72:1223–1231 [DOI] [PubMed] [Google Scholar]
- McCullough ML, Feskanich D, Stampfer MJ, Giovannucci EL, Rimm EB, Hu FB, Spiegelman D, Hunter DJ, Colditz GA, Willett WC 2002 Diet quality and major chronic disease risk in men and women: moving toward improved dietary guidance. Am J Clin Nutr 76:1261–1271 [DOI] [PubMed] [Google Scholar]
- Quatromoni PA, Copenhafer DL, D'Agostino RB, Millen BE 2002 Dietary patterns predict the development of overweight in women: the Framingham Nutrition Studies. J Am Diet Assoc 102:1239–1246 [DOI] [PubMed] [Google Scholar]
- Quatromoni PA, Pencina M, Cobain MR, Jacques PF, D'Agostino RB 2006 Dietary quality predicts adult weight gain: findings from the Framingham Offspring Study. Obesity (Silver Spring) 14:1383–1391 [DOI] [PubMed] [Google Scholar]
- Azadbakht L, Mirmiran P, Esmaillzadeh A, Azizi F 2005 Dairy consumption is inversely associated with the prevalence of the metabolic syndrome in Tehranian adults. Am J Clin Nutr 82:523–530 [DOI] [PubMed] [Google Scholar]
- Beydoun MA, Gary TL, Caballero BH, Lawrence RS, Cheskin LJ, Wang Y 2008 Ethnic differences in dairy and related nutrient consumption among US adults and their association with obesity, central obesity, and the metabolic syndrome. Am J Clin Nutr 87:1914–1925 [DOI] [PMC free article] [PubMed] [Google Scholar]
- Jaffiol C 2008 [Milk and dairy products in the prevention and therapy of obesity, type 2 diabetes and metabolic syndrome]. Bull Acad Natl Med 192:749–758 (French) [PubMed] [Google Scholar]
- Beydoun MA, Wang Y 2009 Gender-ethnic disparity in BMI and waist circumference distribution shifts in US adults. Obesity (Silver Spring) 17:169–176 [DOI] [PMC free article] [PubMed] [Google Scholar]
- Speer G, Cseh K, Winkler G, Vargha P, Braun E, Takács I, Lakatos P 2001 Vitamin D and estrogen receptor gene polymorphisms in type 2 diabetes mellitus and in android type obesity. Eur J Endocrinol 144:385–389 [DOI] [PubMed] [Google Scholar]
- Ye WZ, Reis AF, Dubois-Laforgue D, Bellanné-Chantelot C, Timsit J, Velho G 2001 Vitamin D receptor gene polymorphisms are associated with obesity in type 2 diabetic subjects with early age of onset. Eur J Endocrinol 145:181–186 [DOI] [PubMed] [Google Scholar]
- Meng YX, Ford ES, Li C, Quarshie A, Al-Mahmoud AM, Giles W, Gibbons GH, Strayhorn G 2007 Association of C-reactive protein with surrogate measures of insulin resistance among nondiabetic US from National Health and Nutrition Examination Survey 1999–2002. Clin Chem 53:2152–2159 [DOI] [PubMed] [Google Scholar]
- Onat A, Uyarel H, Hergenç G, Karabulut A, Albayrak S, Sari I, Yazici M, Kele° I 2006 Serum uric acid is a determinant of metabolic syndrome in a population-based study. Am J Hypertens 19:1055–1062 [DOI] [PubMed] [Google Scholar]
- Piestrzeniewicz K, £uczak K, Komorowski J, Jankiewicz-Wika J, Goch JH 2007 Relation of C-reactive protein to obesity, adipose tissue hormones and cardiovascular risk factors in men treated with early percutaneous intervention in course of acute myocardial infarction. Neuro Endocrinol Lett 28:427–432 [PubMed] [Google Scholar]
- Song Y, Ridker PM, Manson JE, Cook NR, Buring JE, Liu S 2005 Magnesium intake, C-reactive protein, and the prevalence of metabolic syndrome in middle-aged and older U.S. women. Diabetes Care 28:1438–1444 [DOI] [PubMed] [Google Scholar]
- Ford ES, Mokdad AH, Liu S 2005 Healthy Eating Index and C-reactive protein concentration: findings from the National Health and Nutrition Examination Survey III, 1988–1994. Eur J Clin Nutr 59:278–283 [DOI] [PubMed] [Google Scholar]
- Fung TT, McCullough ML, Newby PK, Manson JE, Meigs JB, Rifai N, Willett WC, Hu FB 2005 Diet-quality scores and plasma concentrations of markers of inflammation and endothelial dysfunction. Am J Clin Nutr 82:163–173 [DOI] [PubMed] [Google Scholar]
- Ogden CL, Carroll MD, Curtin LR, McDowell MA, Tabak CJ, Flegal KM 2006 Prevalence of overweight and obesity in the United States, 1999–2004. JAMA 295:1549–1555 [DOI] [PubMed] [Google Scholar]
- Proctor DN, O'Brien PC, Atkinson EJ, Nair KS 1999 Comparison of techniques to estimate total body skeletal muscle mass in people of different age groups. Am J Physiol 277:E489–E495 [DOI] [PubMed] [Google Scholar]
- Perloff D, Grim C, Flack J, Frohlich ED, Hill M, McDonald M, Morgenstern BZ 1993 Human blood pressure determination by sphygmomanometry. Circulation 88:2460–2470 [DOI] [PubMed] [Google Scholar]
- Center for Disease Control and Prevention 2006 National Health and Nutrition Examination Survey. http://www.cdc.gov/nchs/nhanes.htm [Google Scholar]
- Expert Panel on Detection, Evaluation, and Treatment of High Blood Cholesterol in Adults 2001 Executive Summary of The Third Report of the National Cholesterol Education Program (NCEP) Expert Panel on Detection, Evaluation, and Treatment of High Blood Cholesterol in Adults (Adult Treatment Panel III). JAMA 285: 2486–2497 [DOI] [PubMed] [Google Scholar]
- Wallace TM, Levy JC, Matthews DR 2004 Use and abuse of HOMA modeling. Diabetes Care 27:1487–1495 [DOI] [PubMed] [Google Scholar]
- Matthews DR, Hosker JP, Rudenski AS, Naylor BA, Treacher DF, Turner RC 1985 Homeostasis model assessment: insulin resistance and β-cell function from fasting plasma glucose and insulin concentrations in man. Diabetologia 28:412–419 [DOI] [PubMed] [Google Scholar]
- 2003 Handbook of diagnostic tests. 3rd ed. Philadelphia: Lippincott Williams & Wilkins [Google Scholar]
- Ridker PM, Cushman M, Stampfer MJ, Tracy RP, Hennekens CH 1997 Inflammation, aspirin, and the risk of cardiovascular disease in apparently healthy men. N Engl J Med 336:973–979 [DOI] [PubMed] [Google Scholar]
- U.S. Department of Agriculture 2005 Healthy Eating Index 2005. http://www.cnpp.usda.gov/Publications/HEI/healthyeatingindex2005factsheet.pdf [Google Scholar]
- Cheng YJ, Gregg EW, De Rekeneire N, Williams DE, Imperatore G, Caspersen CJ, Kahn HS 2007 Muscle-strengthening activity and its association with insulin sensitivity. Diabetes Care 30:2264–2270 [DOI] [PubMed] [Google Scholar]
- Lagerros YT, Lagiou P 2007 Assessment of physical activity and energy expenditure in epidemiological research of chronic diseases. Eur J Epidemiol 22:353–362 [DOI] [PubMed] [Google Scholar]
- National Institutes of Health; National Heart, Lung, and Blood Institute; North American Association for the Study of Obesity 2000 The practical guide: identification, evaluation, and treatment of overweight and obesity in adults. Bethesda, MD: National Institutes of Health [Google Scholar]
- Lohr SL 1999 Sampling: design and analysis. Pacific Grove, CA: Duxbury Press [Google Scholar]
- Hatcher L 1994 A step-by-step approach to using the SAS system for factor analysis ad structural equation modeling. Cary, NC: SAS [Google Scholar]
- Zittermann A, Frisch S, Berthold HK, Götting C, Kuhn J, Kleesiek K, Stehle P, Koertke H, Koerfer R 2009 Vitamin D supplementation enhances the beneficial effects of weight loss on cardiovascular disease risk markers. Am J Clin Nutr 89:1321–1327 [DOI] [PubMed] [Google Scholar]
- Chiu KC, Chu A, Go VL, Saad MF 2004 Hypovitaminosis D is associated with insulin resistance and β-cell dysfunction. Am J Clin Nutr 79:820–825 [DOI] [PubMed] [Google Scholar]
- Johnson JA, Grande JP, Roche PC, Kumar R 1994 Immunohistochemical localization of the 1,25(OH)2D3 receptor and calbindin D28k in human and rat pancreas. Am J Physiol 267:E356–E360 [DOI] [PubMed] [Google Scholar]
- Simpson RU, Thomas GA, Arnold AJ 1985 Identification of 1,25-dihydroxyvitamin D3 receptors and activities in muscle. J Biol Chem 260:8882–8891 [PubMed] [Google Scholar]
- Bland R, Markovic D, Hills CE, Hughes SV, Chan SL, Squires PE, Hewison M 2004 Expression of 25-hydroxyvitamin D3-1α-hydroxylase in pancreatic islets. J Steroid Biochem Mol Biol 89–90:121–125 [DOI] [PubMed] [Google Scholar]
- Somjen D, Weisman Y, Kohen F, Gayer B, Limor R, Sharon O, Jaccard N, Knoll E, Stern N 2005 25-Hydroxyvitamin D3-1α-hydroxylase is expressed in human vascular smooth muscle cells and is upregulated by parathyroid hormone and estrogenic compounds. Circulation 111:1666–1671 [DOI] [PubMed] [Google Scholar]
- Wortsman J, Matsuoka LY, Chen TC, Lu Z, Holick MF 2000 Decreased bioavailability of vitamin D in obesity. Am J Clin Nutr 72:690–693 [DOI] [PubMed] [Google Scholar]
- Bell NH, Epstein S, Greene A, Shary J, Oexmann MJ, Shaw S 1985 Evidence for alteration of the vitamin D-endocrine system in obese subjects. J Clin Invest 76:370–373 [DOI] [PMC free article] [PubMed] [Google Scholar]
- Konradsen S, Ag H, Lindberg F, Hexeberg S, Jorde R 2008 Serum 1,25-dihydroxy vitamin D is inversely associated with body mass index. Eur J Nutr 47:87–91 [DOI] [PubMed] [Google Scholar]
- Parikh SJ, Edelman M, Uwaifo GI, Freedman RJ, Semega-Janneh M, Reynolds J, Yanovski JA 2004 The relationship between obesity and serum 1,25-dihydroxy vitamin D concentrations in healthy adults. J Clin Endocrinol Metab 89:1196–1199 [DOI] [PubMed] [Google Scholar]
- Zemel MB 2003 Role of dietary calcium and dairy products in modulating adiposity. Lipids 38:139–146 [DOI] [PubMed] [Google Scholar]
- Pereira MA, Jacobs Jr DR, Van Horn L, Slattery ML, Kartashov AI, Ludwig DS 2002 Dairy consumption, obesity, and the insulin resistance syndrome in young adults: the CARDIA Study. JAMA 287:2081–2089 [DOI] [PubMed] [Google Scholar]
- Li YC 2003 Vitamin D regulation of the renin-angiotensin system. J Cell Biochem 88:327–331 [DOI] [PubMed] [Google Scholar]
- Wang D, An SJ, Wang WH, McGiff JC, Ferreri NR 2001 CaR-mediated COX-2 expression in primary cultured mTAL cells. Am J Physiol Renal Physiol 281:F658–F664 [DOI] [PubMed] [Google Scholar]
- Shiuchi T, Iwai M, Li HS, Wu L, Min LJ, Li JM, Okumura M, Cui TX, Horiuchi M 2004 Angiotensin II type-1 receptor blocker valsartan enhances insulin sensitivity in skeletal muscles of diabetic mice. Hypertension 43:1003–1010 [DOI] [PubMed] [Google Scholar]
- Flegal KM, Shepherd JA, Looker AC, Graubard BI, Borrud LG, Ogden CL, Harris TB, Everhart JE, Schenker N 2009 Comparisons of percentage body fat, body mass index, waist circumference, and waist-stature ratio in adults. Am J Clin Nutr 89:500–508 [DOI] [PMC free article] [PubMed] [Google Scholar]
- Grundberg E, Brändström H, Ribom EL, Ljunggren O, Mallmin H, Kindmark A 2004 Genetic variation in the human vitamin D receptor is associated with muscle strength, fat mass and body weight in Swedish women. Eur J Endocrinol 150:323–328 [DOI] [PubMed] [Google Scholar]
- Oh JY, Barrett-Connor E 2002 Association between vitamin D receptor polymorphism and type 2 diabetes or metabolic syndrome in community-dwelling older adults: the Rancho Bernardo Study. Metabolism 51:356–359 [DOI] [PubMed] [Google Scholar]
- Ortlepp JR, Lauscher J, Hoffmann R, Hanrath P, Joost HG 2001 The vitamin D receptor gene variant is associated with the prevalence of type 2 diabetes mellitus and coronary artery disease. Diabet Med 18:842–845 [DOI] [PubMed] [Google Scholar]