Abstract
Different global patterns of brain activity are associated with distinct arousal and behavioral states of an animal, but how the brain rapidly switches between different states remains unclear. We here report that repetitive high-frequency burst spiking of a single cortical neuron could trigger a switch between the cortical states resembling slow-wave and REM sleep. This is reflected in the switching of the membrane potential of the stimulated neuron from slow UP/DOWN oscillations to a persistent-UP state or vice versa, with concurrent changes in the temporal pattern of cortical LFP recorded several millimeters away. These results point to the power of single cortical neurons in modulating the behavioral state of an animal.
Different behavioral states of the animal are characterized by distinct patterns of global brain activity. For example, slow-wave sleep is associated with slow oscillations, with UP-DOWN membrane potential transitions in cortical neurons and high-amplitude, low-frequency local field potential (LFP) and EEG signals (1–6). In contrast, low-amplitude high-frequency cortical activity prevails during rapid-eye-movement (REM) sleep and wakefulness, with neuronal membrane potentials fluctuating around a depolarized level (3). In recent years, significant progress has been made in identifying the neuromodulatory circuits in the hypothalamus, brain stem, and basal forebrain that are involved in regulating the global brain state (7–12). However, the role of cortical neurons in this regulation remains unclear. Inspired by recent findings that activation of a single cortical neuron can significantly modulate sensory perception and motor output (13, 14), we set out to test whether single neuron stimulation can modify the global brain state.
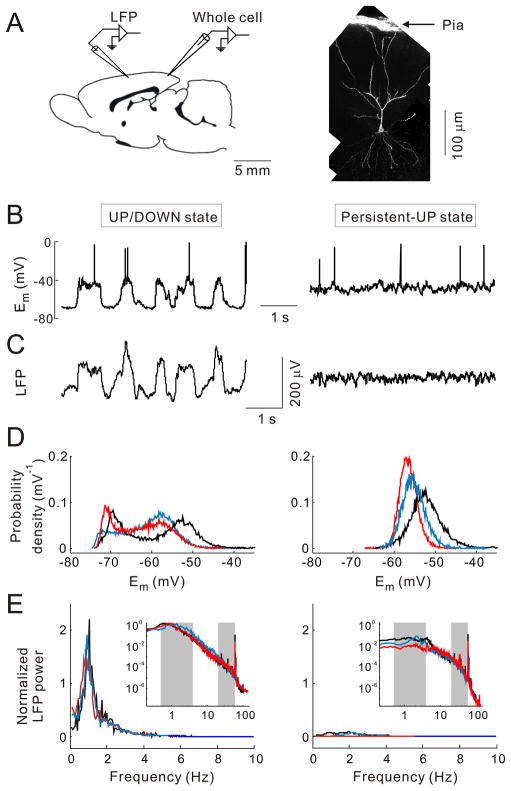
Whole-cell patch recordings were made from the superficial layers of visual or somatosensory cortex of urethane-anaesthetized adult rats (15) (Fig. 1A, Fig. S1A). We routinely observed two types of spontaneous activity: the membrane potential (Em) exhibited either a bimodal distribution with UP/DOWN transitions at ~1 Hz (Figs. 1B and 1D, left panel, hereafter referred to as “UP/DOWN” state) or a unimodal distribution with high-frequency fluctuations around a depolarized level (right panel, “persistent-UP” state). Each of these states observed in a single cell corresponded to a distinct pattern of LFP, recorded simultaneously in a cortical region 0.3–6 mm from the patch electrode (Fig. 1A). UP/DOWN Em transitions were highly correlated with high-amplitude slow LFP deflections (1–3, 16) (Fig. 1C, left panel), whereas the persistent-UP state of the single neuron was accompanied by low-amplitude, fast LFP fluctuations (3, 16) (right panel). The power spectra of these LFP signals (Fig. 1E) showed a prominent difference at low frequencies (0.5–4 Hz). Thus, the UP/DOWN and persistent-UP states of single neurons reflect distinct global cortical states, which resemble slow-wave and REM sleep, respectively (4, 16, 17).
Fig. 1.
UP/DOWN and persistent-UP states observed in simultaneous whole-cell and LFP recordings in rat cortex. (A) Left, schematic illustration of recording configuration. Whole-cell and LFP electrodes were separated by 0.3–6 mm. Right, a whole-cell recorded pyramidal neuron in somatosensory cortex. (B) UP/DOWN (left) and persistent-UP (right) states observed in a visual cortical neuron. (C) LFP recorded 2 mm from the patch recording in (B). (D) Distributions of membrane potentials (Em) during UP/DOWN (left) and persistent-UP (right) states. Data are from 3 cells (marked by different colors). (E) LFP power spectra from the same experiments as in (D), each normalized by the mean power at 0.5–1.5 Hz during UP/DOWN state. Insets: power spectra on log-log scales. Gray shadings, low and high frequency ranges for computing L/H power ratio.
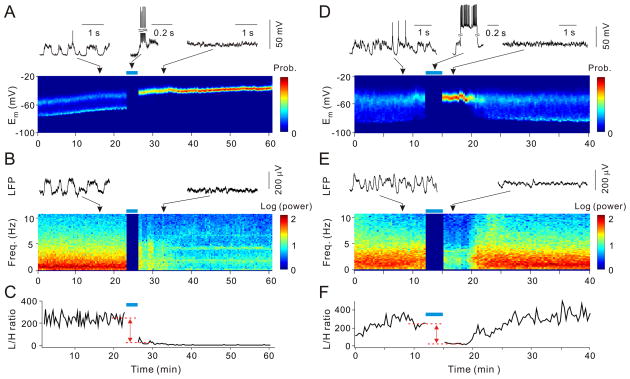
High-frequency burst spiking of the patched neuron induced by depolarizing current injections (350–600 ms/step, 30–40 steps with 4–4.5 s intervals, or 8 ms/pulse, 5–15 pulses/burst, 40–80 bursts with 2–2.5 s intervals) could trigger a switch between these cortical states. In the example in Fig. 2A, the recorded visual cortical neuron was in stable UP/DOWN state (exhibiting bimodal Em distribution) for >20 min. Repeated burst spiking at 50 Hz (for ~3 min) (15) caused a switch from the UP/DOWN to persistent-UP state (exhibiting unimodal Em distribution), which lasted through the duration of recording (~30 min). Concurrent with the change in Em distribution of the patched neuron, there was a marked reduction of low-frequency signals in the LFP recorded ~1 mm away (Fig. 2B), indicating a switch from the cortical state characteristic of slow-wave sleep to that of REM sleep (17). Figures 2D and 2E show another example, in which LFP was recorded ~5 mm from the patch electrode. In this case, both the single neuron Em and the LFP reverted to their original patterns after ~5 min. A third example is shown in Fig. S1, where burst spiking of a somatosensory cortical neuron changed the global cortical state, as revealed by both LFP and EEG recordings. Single neuron burst spiking also induced a similar switch of cortical state under isoflurane anesthesia (Fig. S2), indicating that the effect is not specific to urethane anesthesia.
Fig. 2.
Switch from UP/DOWN to persistent-UP state induced by single-neuron burst spiking. (A) State switch indicated by change from bimodal to unimodal Em distribution (color coded, computed in 20-s windows). Blue bar: burst spiking period. Insets above, sample whole-cell recording traces during periods marked by arrows. (B) State switch indicated by change in LFP power spectrum (color coded, log scale, computed in 20-s windows) recorded ~1 mm from whole-cell electrode. Insets, sample LFP traces. (C) L/H power ratio (between 0.5–4 Hz and 20–60 Hz) for LFP in (B). Dashed red lines: averaged values 3 min before and 3 min after burst spiking; distance between these lines was used to measure burst-induced L/H ratio change. (D–F) Similar to (A–C), from another experiment; LFP was recorded ~5 mm from patch electrode.
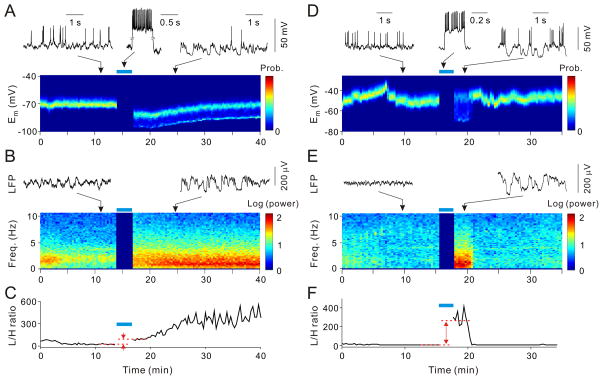
The high-frequency bursts of a single neuron could also cause a switch in the opposite direction, from the persistent-UP to UP/DOWN state. In the example shown in Figs. 3A and 3B, the cortex was in the persistent-UP state for >10 min, as indicated by both the unimodal Em distribution (Fig. 3A) and low-amplitude, fast LFP fluctuations (Fig. 3B). Repetitive burst spiking of the patched neuron caused a switch into the UP/DOWN state, with bimodal Em distribution (Fig. 3A) and high-amplitude slow LFP deflections (Fig. 3B) that lasted for >20 min. Figures 3D and 3E show another example of burst-induced switch from the persistent-UP to UP/DOWN state, but in this case the cortex spontaneously reverted to the persistent-UP state after ~3 min.
Fig. 3.
Switch from persistent-UP to UP/DOWN state induced by single-neuron spiking. (A) State switch indicated by change from unimodal to bimodal Em distribution. (B) State switch indicated by change in LFP power spectrum (recorded ~5 mm from whole-cell electrode). (C) L/H power ratio, for LFP in (B). (D–F) Similar to (A–C), from another experiment; LFP was recorded ~1 mm from patch electrode.
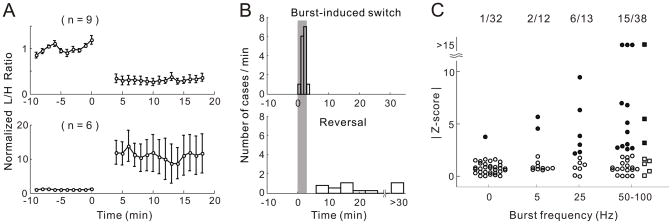
To quantify the burst-induced changes in cortical state, we computed the ratio between LFP power in the ranges of 0.5–4 Hz and 20–60 Hz (referred to as “L/H power ratio”) (15). As shown in Figs. 2C, 2F, 3C, and 3F, marked increase or decrease of L/H power ratio was found after single-neuron burst spiking. To determine whether in each experiment the observed change in L/H ratio over the ~3 min spiking period could be explained by a spontaneous change of the cortical state, we used the control period of 10–30 min before burst spiking to estimate the spontaneous variation of L/H ratio over each 3-min interval. The burst-induced change was compared to the distribution of this spontaneous variation to determine its statistical significance. We found significant changes in LFP L/H ratio (p < 0.05) after evoking high-frequency bursts (50–100 Hz, 200–1000 spikes total) in single neurons in 15 out of 38 experiments (Fig. 4A, 9 from UP/DOWN to persistent-UP state and 6 in the opposite direction, with each experiment performed on a different neuron). In these 15 experiments, the abrupt change indicative of cortical state switch often occurred during the period of burst spiking (Fig. 4B, upper plot, 2.0±0.8 min after burst onset, mean±SD). On the other hand, the time for spontaneous reversal to the original state showed large variations (Fig. 4B, lower plot, data from the same 15 experiments), with 4/15 cases showing no reversal within the 30 min recording after burst spiking.
Fig. 4.
Time course and frequency dependence of the switch of cortical state. (A) Average LFP L/H power ratio for 15/38 experiments with significant ratio changes induced by spiking at 50–100 Hz (solid symbols in C). Upper, average of 9 experiments showing significant UP/DOWN to persistent-UP transitions; lower plot, average of 6 experiments showing persistent-UP to UP/DOWN transitions. L/H ratio of each experiment was normalized by its mean before spiking. Error bar, ±SEM. (B) Distributions of time for spiking-induced switch (upper) and spontaneous reversal (lower), for the same 15 experiments as in (A). Gray stripe, burst spiking period. (C) |Z-score| for burst-induced LFP L/H ratio change vs. burst frequency. Each point represents one experiment performed on one whole-cell recorded neuron in visual (circle) or somatosensory (square) cortex. Solid symbols, experiments with significant ratio changes (p < 0.05); “0 Hz”, control experiments with no spiking during the 3-min sham period. Compared to “0 Hz”, Z-score distribution was significantly different for 25 Hz (p = 0.010, two-sample Kolmogorov-Smirnov test) and 50–100 Hz (p = 0.0014) but not for 5 Hz (p = 0.20). Probability of burst-induced transition (percentage of solid symbols) is significantly higher for 25 Hz (46%, p < 0.001, bootstrap (15)) and 50–100 Hz (39%, p < 0.001), but not for 5 Hz (16%, p = 0.11).
We next examined the dependence of the cortical state switch on burst frequency by varying the spike frequency within each burst from 0 to 100 Hz. In 32 control experiments, in which no spiking was evoked during a 3-min “sham period” (0 Hz, 20–23 min after establishing whole-cell recording), we found only one case with significant L/H ratio change (p < 0.05). At a burst frequency of 5 Hz, only 2/12 cases showed significant ratio change. However, between 25 and 100 Hz, ~40% (6/13 at 25 Hz and 15/38 at 50–100 Hz) of the cases showed significant changes (Fig. 4C). Thus, the switch of cortical states by single neurons requires high-frequency bursting.
Slow oscillations have been shown to be initiated in deep layers of the cortex (18–20). In this study, most of the stimulated neurons appeared to be excitatory neurons in superficial layers, as judged by their spiking patterns upon current injection (Figs. 2A, 2D, 3A, and 3D), depths of the recording electrodes (in most cases <500 μm from pia), and by histological reconstruction of a subset of recorded neurons (Figs. 1A, S1A). Each of these neurons is likely to project to several thousand cortical neurons (21), and a small percentage of these connections may be strong enough to trigger postsynaptic spiking (22, 23) and to activate a local network (24). The high-frequency bursts required for triggering the state switch (Fig. 4C) could further enhance the effect of single neuron spiking through temporal summation of postsynaptic potentials and short-term synaptic facilitation (25), e.g., those found at excitatory synapses onto Martinotti cells (26). Given the extensive connections from layer 2/3 to layer 5 (ref. 21), the spiking activity in layer 2/3 may strongly modulate the dynamics in deep cortical layers, resulting in either initiation or termination of slow oscillations. Such local activity modulation may spread globally through either cortico-cortical connections or the thalamo-cortico-reticular loop (4, 27). In addition, the transitions between slow-wave sleep, REM sleep, and awake cortical states are known to be regulated by neuromodulatory systems in the hypothalamus, brainstem, and basal forebrain (4, 8–12, 28, 29), which project diffusely to the thalamus and cortex and are capable of triggering synchronous state changes across multiple brain areas. Thus, the switch of global brain states induced by cortical neuronal burst spiking could be mediated by descending projections from the cortex to these modulatory circuits (10, 28). In particular, the naturally occurring bi-directional switches between slow-wave and REM sleep are thought to be controlled by a flip-flop circuit consisting of mutually inhibitory REM-ON and REM-OFF areas (10). Spiking activity in the cortex may tip the balance between REM-ON and REM-OFF neurons, thus causing the observed state change. Future studies on both the flip-flop circuit and their cortical inputs will help elucidate the mechanisms underlying the switches among different brain states.
Previous studies have shown that stimulation of a single motor cortical neuron can evoke whisker movement (13), and spiking of a single somatosensory cortical neuron can induce behaviorally reportable effect (14). Our study showed that burst spiking of a single neuron can trigger a switch in the global brain state, further underscoring the functional importance of individual neuronal activity.
Supplementary Material
Acknowledgments
This work was supported by grants from NIH and NSF (SBE-0542013 to TDLC). We thank Wenzhi Sun for technical help.
References and Notes
- 1.Steriade M, Nunez A, Amzica F. J Neurosci. 1993;13:3252. doi: 10.1523/JNEUROSCI.13-08-03252.1993. [DOI] [PMC free article] [PubMed] [Google Scholar]
- 2.Contreras D, Steriade M. J Neurosci. 1995;15:604. doi: 10.1523/JNEUROSCI.15-01-00604.1995. [DOI] [PMC free article] [PubMed] [Google Scholar]
- 3.Steriade M, Timofeev I, Grenier F. J Neurophysiol. 2001;85:1969. doi: 10.1152/jn.2001.85.5.1969. [DOI] [PubMed] [Google Scholar]
- 4.Steriade M, McCormick D, Sejnowski T. Science. 1993;262:679. doi: 10.1126/science.8235588. [DOI] [PubMed] [Google Scholar]
- 5.Anderson J, Lampl I, Reichova I, Carandini M, Ferster D. Nat Neurosci. 2000;3:617. doi: 10.1038/75797. [DOI] [PubMed] [Google Scholar]
- 6.Wilson CJ, Groves PM. Brain Res. 1981;220:67. doi: 10.1016/0006-8993(81)90211-0. [DOI] [PubMed] [Google Scholar]
- 7.Steriade M, McCarley RW. Brainstem control of wakefulness and sleep. Plenum; New York: 1990. [Google Scholar]
- 8.Sinton CM, McCarley RW. Semin Neurol. 2004;24:211. doi: 10.1055/s-2004-835067. [DOI] [PubMed] [Google Scholar]
- 9.Saper CB, Scammell TE, Lu J. Nature. 2005;437:1257. doi: 10.1038/nature04284. [DOI] [PubMed] [Google Scholar]
- 10.Lu J, Sherman D, Devor M, Saper CB. Nature. 2006;441:589. doi: 10.1038/nature04767. [DOI] [PubMed] [Google Scholar]
- 11.Behn CG, Brown EN, Scammell TE, Kopell NJ. J Neurophysiol. 2007;97:3828. doi: 10.1152/jn.01184.2006. [DOI] [PMC free article] [PubMed] [Google Scholar]
- 12.Moruzzi G. Ergeb Physiol. 1972;64:1. doi: 10.1007/3-540-05462-6_1. [DOI] [PubMed] [Google Scholar]
- 13.Brecht M, Schneider M, Sakmann B, Margrie TW. Nature. 2004;427:704. doi: 10.1038/nature02266. [DOI] [PubMed] [Google Scholar]
- 14.Houweling AR, Brecht M. Nature. 2008;451:65. doi: 10.1038/nature06447. [DOI] [PubMed] [Google Scholar]
- 15.Materials and Methods are available as supporting material on Science Online.
- 16.Destexhe A, Contreras D, Steriade M. J Neurosci. 1999;19:4595. doi: 10.1523/JNEUROSCI.19-11-04595.1999. [DOI] [PMC free article] [PubMed] [Google Scholar]
- 17.Gervasoni D, et al. J Neurosci. 2004;24:11137. doi: 10.1523/JNEUROSCI.3524-04.2004. [DOI] [PMC free article] [PubMed] [Google Scholar]
- 18.Steriade M, Nunez A, Amzica F. J Neurosci. 1993;13:3266. doi: 10.1523/JNEUROSCI.13-08-03266.1993. [DOI] [PMC free article] [PubMed] [Google Scholar]
- 19.Timofeev I, Grenier F, Bazhenov M, Sejnowski TJ, Steriade M. Cereb Cortex. 2000;10:1185. doi: 10.1093/cercor/10.12.1185. [DOI] [PubMed] [Google Scholar]
- 20.Sanchez-Vives MV, McCormick DA. Nat Neurosci. 2000;3:1027. doi: 10.1038/79848. [DOI] [PubMed] [Google Scholar]
- 21.Douglas RJ, Martin KA. Annu Rev Neurosci. 2004;27:419. doi: 10.1146/annurev.neuro.27.070203.144152. [DOI] [PubMed] [Google Scholar]
- 22.Song S, Sjostrom PJ, Reigl M, Nelson S, Chklovskii DB. PLoS Biology. 2005;3:e68. doi: 10.1371/journal.pbio.0030068. [DOI] [PMC free article] [PubMed] [Google Scholar]
- 23.Peterlin ZA, Kozloski J, Mao BQ, Tsiola A, Yuste R. Proc Natl Acad Sci U S A. 2000;97:3619. doi: 10.1073/pnas.97.7.3619. [DOI] [PMC free article] [PubMed] [Google Scholar]
- 24.Bazhenov M, Timofeev I, Steriade M, Sejnowski TJ. J Neurosci. 2002;22:8691. doi: 10.1523/JNEUROSCI.22-19-08691.2002. [DOI] [PMC free article] [PubMed] [Google Scholar]
- 25.Zucker RS, Regehr W. Annu Rev Physiol. 2002;64:355. doi: 10.1146/annurev.physiol.64.092501.114547. [DOI] [PubMed] [Google Scholar]
- 26.Silberberg G, Markram H. Neuron. 2007;53:735. doi: 10.1016/j.neuron.2007.02.012. [DOI] [PubMed] [Google Scholar]
- 27.McCormick DA, Bal T. Annu Rev Neurosci. 1997;20:185. doi: 10.1146/annurev.neuro.20.1.185. [DOI] [PubMed] [Google Scholar]
- 28.Pace-Schott EF, Hobson JA. Nat Rev Neurosci. 2002;3:591. doi: 10.1038/nrn895. [DOI] [PubMed] [Google Scholar]
- 29.Jones BE. Prog Brain Res. 2004;145:157. doi: 10.1016/S0079-6123(03)45011-5. [DOI] [PubMed] [Google Scholar]
Associated Data
This section collects any data citations, data availability statements, or supplementary materials included in this article.


