

Abstract
Background
Micro-RNAs (miRNAs) control gene expression by destabilizing targeted transcripts and inhibiting their translation. Aberrant expression of miRNAs has been described in many human cancers, including chronic myeloid leukemia. Current first-line therapy for newly diagnosed chronic myeloid leukemia is imatinib mesylate, which typically produces a rapid hematologic response. However the effect of imatinib on miRNA expression in vivo has not been thoroughly examined.
Design and Methods
Using a TaqMan Low-Density Array system, we analyzed miRNA expression in blood samples from newly diagnosed chronic myeloid leukemia patients before and within the first two weeks of imatinib therapy. Quantitative real-time PCR was used to validate imatinib-modulated miRNAs in sequential primary chronic myeloid leukemia samples (n=11, plus 12 additional validation patients). Bioinformatic target gene prediction analysis was performed based on changes in miRNA expression.
Results
We observed increased expression of miR-150 and miR-146a, and reduced expression of miR-142-3p and miR-199b-5p (3-fold median change) after two weeks of imatinib therapy. A significant correlation (P<0.05) between the Sokal score and pre-treatment miR-142-3p levels was noted. Expression changes in the same miRNAs were consistently found in an additional cohort of chronic myeloid leukemia patients, as compared to healthy subjects. Peripheral blood cells from chronic phase and blast crisis patients displayed a 30-fold lower expression of miR-150 compared to normal samples, which is of particular interest since c-Myb, a known target of miR-150, was recently shown to be necessary for Bcr-Abl-mediated transformation.
Conclusions
We found that imatinib treatment of chronic myeloid leukemia patients rapidly normalizes the characteristic miRNA expression profile, suggesting that miRNAs may serve as a novel clinically useful biomarker in this disease.
Keywords: BCR-ABL, miRNA, imatinib, chronic myeloid leukemia
Introduction
Micro-RNAs (miRNAs) are small, endogenous non-coding RNAs that posttranscriptionally regulate gene expression through partial base-pairing with the 3′-untranslated region of target mRNAs, resulting in mRNA destabilization and translational inhibition.1,2 These molecules regulate many biological processes, such as cell differentiation, proliferation, apoptosis, and have been implicated in cancers and leukemias.3,4 The overexpression of miRNAs can perturb normal hematopoiesis, as first identified by Chen et al.5 The involvement of miRNAs in hematologic malignancies was initially suggested in chronic lymphocytic leukemia (CLL).6 Subsequent expression profiling studies identified miRNA signatures characterizing CLL outcome,7,8 acute lymphoblastic leukemia9 and acute myeloid leukemia (AML) associated with various cytogenetic abnormalities.10,11 For example, increased expression of miR-155 has been detected in various leukemias and lymphomas,12 and mice reconstituted with miR-155-expressing bone marrow cells were shown to develop a myeloproliferative disorder.13 Similarly, overexpression of the miR-17~92 cluster promotes B-cell lymphoma in a mouse model,14 and mice with increased expression of this cluster in lymphocytes develop lymphoproliferative and autoimmune diseases.15
The contribution of miRNAs to the development of, or response to therapy in chronic myeloid leukemia (CML) has not been examined in depth. Venturini et al.16 recently described the increased expression of the miR-17~92 cluster in chronic phase (CP) CML patients that was not found in blast crisis (BC) samples. CML is characterized by the expression of the BCR-ABL fusion gene, resulting from the t(9;22) (q34;q11) translocation. Through its constitutive tyrosine kinase (TK) activity, Bcr-Abl activates a number of signaling pathways which lead to the leukemic phenotype.17 The TK inhibitor imatinib mesylate (IM) is currently the first-line therapy for newly diagnosed CML patients, leading to the rapid clearance of leukemic cells in peripheral blood in more than 95% of cases.18 However, a subset of patients do not respond to IM treatment, owing to intolerance or drug resistance.
To identify miRNAs implicated in CML we sought to determine the repertoire of miRNAs expressed in leukemic cells from newly diagnosed patients with CML, prior to and within the first two weeks during IM therapy. Using these early time points allowed us to monitor miRNA expression before the leukemic cells became undetectable. We hypothesized that differentially expressed miRNAs would likely play a role in the leukemic cells, and could provide useful novel biomarkers in CML. We used the TaqMan Low Density Array (TLDA) microfluidic system to profile the expression of 365 human mature miRNAs in sequential primary CML samples. This analysis led to the identification of several miRNAs modulated in vivo by imatinib, which displayed increased (miR-150, miR-146a) or decreased expression (miR-142-3p, miR-199b-5p) after the start of IM therapy as compared to pre-treatment levels. These miRNAs were also differentially expressed in an additional cohort of CML chronic phase patients, and we showed for the first time that the expression of miR-150 was reduced in blast crisis samples as well. Furthermore, we found significant positive and negative correlations between miRNA expression levels and clinical data before treatment. We discuss candidate target genes for these miRNAs, of relevance in CML.
Design and Methods
Patient samples
Blood samples were obtained from 10 CML patients in the Clinical Investigation Centre (CIC), INSERM 802 at Poitiers University Hospital (Table 1). Samples were collected at diagnosis or on the day before the start of IM treatment (day 0), and when available within 24 hours after the initiation of IM therapy (day 1), and after one week (day 7) and two weeks (day 14) of IM therapy. One additional patient (P06), for whom no pre-treatment sample was available, was included in this set, using miRNA expression data obtained at day 1 to estimate the expression fold change at day 14. However this patient was not used for the correlation analyses with pre-treatment clinical data. Imatinib was administered at a standard dose of 400 mg each day, at fixed hours. Additional blood or bone marrow samples were obtained from CML patients at diagnosis prior to IM treatment or in blast crisis, as well as from healthy volunteer donors. The study was approved by the scientific committee of the CIC-INSERM 802 (registration number CIC 101-2007) and each patient/donor gave written informed consent in accordance with the Declaration of Helsinki. Peripheral blood mononuclear cells (PBMCs) were prepared by sedimentation over a Ficoll cushion. Cells were lysed in Trizol (Invitrogen, Carlsbad, CA) and stored at −80ºC before RNA extraction.
Table 1.
Patients’ clinical parameters at diagnosis and day 0.

TaqMan low-density array screening
Reverse transcription (RT) reaction was performed using human Megaplex™ RT primers (ABI Applied Biosystems, Foster City, CA, USA), which contains a pool of 365 individual miRNA-specific primers, according to the manufacturer’s instructions. Real-time quantitative PCR [(q)RT-PCR] was then carried out on an ABI 7900HT real-time PCR machine with the LDA thermal cycler block, using pre-defined TLDA thermal cycling conditions. QRT-PCR data were extracted with SDS2.3 and RQ Manager Software (ABI). In order to obtain comparative data across all time points, the 4 samples corresponding to each time point were analyzed simultaneously, along with baseline (day 0) samples. Thresholds for the determination of Ct values were manually set to 0.2, 0.1, or 0.05 for each miRNA across the 16 samples, depending on the quality of the amplification. Relative fold change was calculated using the ΔCt method, normalized to RNU48 expression, based on averaged ΔCt for each time point compared to day 0.
MiRNA quantitative RT-PCR
Total RNA (100 ng) was treated with DNase I (Invitrogen), precipitated overnight and poly-adenylated using E. coli poly(A) polymerase (Ambion, Austin, TX, USA). After phenol/chloroform extraction and overnight precipitation, poly(A)-tailed RNAs were reverse-transcribed using SuperScript III (Invitrogen) and the oligo-d(T)/adapter primer : 5′-GCGAGCACAGAATTAATACGACTCACTATAGGACGGCTTTTTTTTTTTTTTTVN-3′. MiRNA qRT-PCR was then performed using 1 μL of 1/10-diluted cDNAs in a 10-μL reaction containing 0.3 μM of the adapter-specific reverse primer 5′-GCGAGCACAGAATTAATACGACTCAC-3′ and miRNA-specific forward primer (Online Supplementary Table S1), 0.1X SybrGreen (Invitrogen) and 1X HotStart Taq MasterMix (Qiagen, Valencia, CA, USA). Endogenous control RNU48 was amplified using 5′-TGATGATGACCCCAGGTAACTC-3′ (forward) and 5′-GAGCGCTGCGGTGATG-3′ (reverse). Real-time PCR was performed in triplicate reactions on a Rotorgene RG-3000 (Corbett, Sydney, Australia), with the following settings: 50°C/2 min, 95°C/13 min, then 40 cycles of [95°C/15 sec, 58°C/15 sec touchdown −1°C for 7 cycles, 72°C/15sec], followed by melt cycle. Expression of miR-155 was measured using TaqMan detection assays #4373124 (miR-155) and #4373383 (RNU48), according to the manufacturer’s instructions (ABI).
Statistical analysis
The significance of fold change in miRNA expression was analyzed using the Wilcoxon signed rank test applied to the ΔCt values. MiRNA differential expression analysis between unrelated samples was conducted using the 2-tailed Mann-Whitney U test, and correlation analyses were computed using the Spearman rank correlation test. Analyses were performed using GraphPad Prism v.5 (La Jolla, CA, USA) and SAS v.9 (Cary, NJ, USA) Software. Results with a P value <0.05 were considered significant.
Target gene prediction analysis
TargetScan 5.019 was searched amongst conserved predictions for genes targeted by highly expressed miR-142-3p, miR-199b-5p, or both, but neither by lowly expressed miR-146 nor miR-150, and vice versa.
Results
Identification of differentially expressed miRNAs in primary cells from chronic myeloid leukemia patients treated with imatinib
Screening of miRNA expression using the TLDA system was initially performed on 4 patients who had samples taken at day 0, day 1, day 7 and day 14 of IM treatment (Table 1). In order to validate the TLDA data from these patients, previously characterized miRNAs from the miR-17~92 cluster on chromosome (Chr) 13 as well as its paralogous clusters, miR-106a~363 on Chr X and miR-106b~25 on Chr 7, were examined.16 Of the 13 miRNAs analyzed, 11 were consistently detected in all samples, most of which displayed a slightly reduced expression after the first day of IM treatment (Figure 1A). A transient increase in expression for some of these miRNAs was noted at day 7, resulting essentially from atypical expression data in a single sample, that was not observed in the other 3 samples. By day 14, 10 miRNAs showed a variable reduction in expression level compared to day 0. We selected 3 of these miRNAs and confirmed their reduced expression at day 1 and day 14 by quantitative (q)RT-PCR (Figure 1B). Altogether, these data suggest that expression of the miR-17~92 cluster in vivo is decreased upon IM therapy, in line with the previous in vitro study, thus providing an internal validation for our TLDA analysis.
Figure 1.

Identification of miRNAs differentially expressed in CML patients during imatinib mesylate (IM) therapy. (A) Average fold change compared to pre-treatment levels of the miR-17~92 cluster members using TaqMan low density array (TLDA) analysis (n=4). (B) QRT-PCR validation of the TLDA results showing the fold change in miR-17-3p, miR-18, and miR-20 after 1 and 14 days of IM treatment. (C) Fold change of a selection of 18 miRNAs from the TLDA analysis at day 1, 7, and 14, relative to day 0 (set to 1). Data represent mean + SD of the 4 samples tested.
We demonstrated the consistent expression of 141 mature miRNAs across all samples out of a possible 365 represented on the TLDA analysis. Fifty-two miRNAs (37%) showed log2 variations of more than 0.6 (i.e. >1.5- fold change) in expression from day 0 to day 14, of which 44 were decreased and 8 increased by day 14 (Online Supplementary Table S2). We selected a set of 18 miRNAs for further analysis (Figure 1C) based upon their averaged fold change in expression (log2 variations >0.6 at day 14; miR-18, -32, -98, -132, -148a, -199b-5p, -301a, -374a, -422b; Online Supplementary Table S2) or their known involvement in various aspects of blood cell physiology (miR-23, -27, -142-3p, -143, -145, -146a, -155, -222, -223). Interestingly, some of these miRNAs showed a progressive decrease (miR-142-3p, miR-148a, miR-199b-5p, miR-222) or increase (miR-146a) in expression during IM therapy. miR-150 and miR-181a, which are involved in hematopoiesis,5,20 were also included in this set, as neither were represented on the TLDA analysis. Subsequent analysis focused on miRNA expression changes between day 0 and day 14. Of the 20 miRNAs selected, 13 were reliably and reproducibly amplified by qRT-PCR in the 11 CML samples (Figure 2A). Six miRNAs showed a median fold change greater than 3 between day 0 and day 14, with reduced expression of miR-142-3p, miR-199b-5p, as well as the genomically clustered miR-143/miR-145, and increased expression of miR-146a and miR-150 after IM treatment. Except for miR-143, expression variations reached statistical significance (Wilcoxon’s signed rank test, Figure 2; Online Supplementary Table S3).
Figure 2.

Validation of deregulated miRNAs in CML. (A) Fold change compared to pre-treatment levels of 13 miRNAs at day 14 following IM therapy analyzed by qRT-PCR (n=11 patients). Fold change significance was tested using a non-parametric t-test on paired samples (2-tailed Wilcoxon’s test); (*)P<0.05; (**) P<0.01. (B–D) Statistical analysis of miRNA expression in the sequential CML samples and healthy controls (CONT). The ΔCt values (Ct of RNU48 minus Ct of miRNA), which reflect logarithmic scale changes, are shown for all samples. *P<0.05; **P<0.01; ns: no significant difference (2-tailed Mann-Whitney test). Bar: median.
To further assess how these changes in miRNA expression differed from normal levels, we used the ΔCt values to determine which miRNAs were significantly differentially expressed in CML samples compared to PBMC samples obtained from 6 healthy donors (controls). The expression levels of miR-150 and miR-146a, which are strongly correlated in leukemic cells (Online Supplementary Table S4), showed a progressive increase from day 0 to day 14, with highest levels in control samples (Figure 2B). Indeed, at day 14, miR-146a expression was no longer signficantly different from controls. Conversely, while miR-142-3p and miR-199b-5p expression levels were strongly correlated (Online Supplementary Table S4), they displayed a progressive decrease in expression from day 0 to day 14 samples, with the lowest levels found in controls (Figure 2C). In both cases, there was a significant difference in their expression levels between day-0 CML and control samples. Furthermore, expression of miR-145, but not miR-143, was significantly different between day 0 samples and controls, although these two miRNAs displayed a similar decrease in their expression pattern from day 0 to day 14 (Figure 2D). Finally, the small difference in miR-181a expression between day 0 samples and controls was statistically significant, whereas variations displayed by miR-18 and miR-148a were of borderline significance (data not shown).
Overall these results demonstrate a significantly increased expression of miR-150 and miR-146a, and a decrease in miR-142-3p, miR-199b-5p, and miR-145 expression, in peripheral blood cells in newly diagnosed CML patients after treatment with imatinib. Our data also demonstrate that their aberrant expression in leukemic cells tends towards, or reaches normal control values after 14 days IM treatment.
Correlation between miRNA expression levels and clinical data
White blood cell counts (WBC) before IM treatment strongly correlated with miR-143, miR-145 and with miR-199b-5p expression levels (P<0.001, P<0.01 and P<0.05 respectively, Table 2). An inverse correlation was observed between the WBC and miR-150 expression at day 0. These results suggest that low expression levels of miR-150, and high expression levels of miR-143/miR-145/miR- 199b-5p reflect the high leukocyte counts found in newly diagnosed CML patients. Platelet levels at day 0 were strongly associated with miR-181a and miR-18 levels (P<0.01), as well as miR-155 (P<0.05). The hemoglobin level at day 0 correlated with miR-27 and miR-148a expression (P<0.01, Table 2). Importantly, there was no correlation between miRNA expression changes and the variations in lymphocyte versus neutrophil composition at these 2 time points, suggesting that the observed changes in miRNA expression do not reflect changes in peripheral blood composition (Online Supplementary Table S5).
Table 2.
Correlation analysis between miRNA expression level and clinical data before IM therapy.

Although most of the day 0 samples were collected after initial diagnosis (Table 1), we sought to examine whether miRNA expression levels correlated with the Sokal risk score.21 Analysis of the clinical features at day 0 and diagnosis revealed that 9 out of 10 patients exhibited similar blood cell counts at these two time points, whereas the last patient displayed large variations in WBC (patient P11, Table 1). Given that, as shown above, the expression of some miRNAs correlated with the WBC, we performed the correlation analysis on the remaining 9 patients only, and found that miR-142-3p correlated to the Sokal score (Table 2). This result suggests that miR-142-3p expression levels at diagnosis could be used for prognostic purposes in CML.
Furthermore, miR-18 fold change between day 0 and day 14 inversely correlated to the time before the occurrence of a first complete hematologic response (r=−0.7198, P=0.0125). Curiously, this miRNA is decreased in patients treated with imatinib. This may indicate that the rapid inhibition of miR-18 is detrimental to an early hematologic remission. Finally, although only 4 patients in this study presented with blasts in peripheral blood at diagnosis (Table 1), this group of patients showed higher levels of miR-142-3p and miR-199b-5p expression than the group without blasts (data not shown).
Analysis of differentially expressed miRNAs in a separate chronic myeloid leukemia test set
We showed that a number of miRNAs were significantly differentially expressed between pre-treatment CML patients and healthy donors. This raised the question whether these miRNAs were consistently differentially expressed in CML as compared to normal cells, which would be indicative of a more direct role for these miRNAs in leukemic cells. We therefore measured the expression level of selected miRNAs by qRT-PCR in samples from an additional 12 CML patients, including 6 patients at diagnosis before IM treatment (chronic phase, CP) and 6 in blast crisis (BC), including 2 patients who relapsed after imatinib. miR-150 expression was significantly reduced by approximately 30-fold in both CP and BC patients as compared to normal cells (Figure 3A), and miR-146a expression was significantly reduced in CP samples (Figure 3B). On the other hand, miR-142-3p and miR-199b-5p displayed a significantly higher expression in CP, but not BC samples, compared to controls (Figure 3C and D). miR-145 and miR-181a expression was not significantly different between CP, BC, and control groups (data not shown). These results confirmed the consistent reduction in expression of miR-150 and miR-146a, and increased expression of miR-142-3p and miR-199b-5p in CML samples at diagnosis, and showed that low expression of miR-150 was maintained in BC phase.
Figure 3.
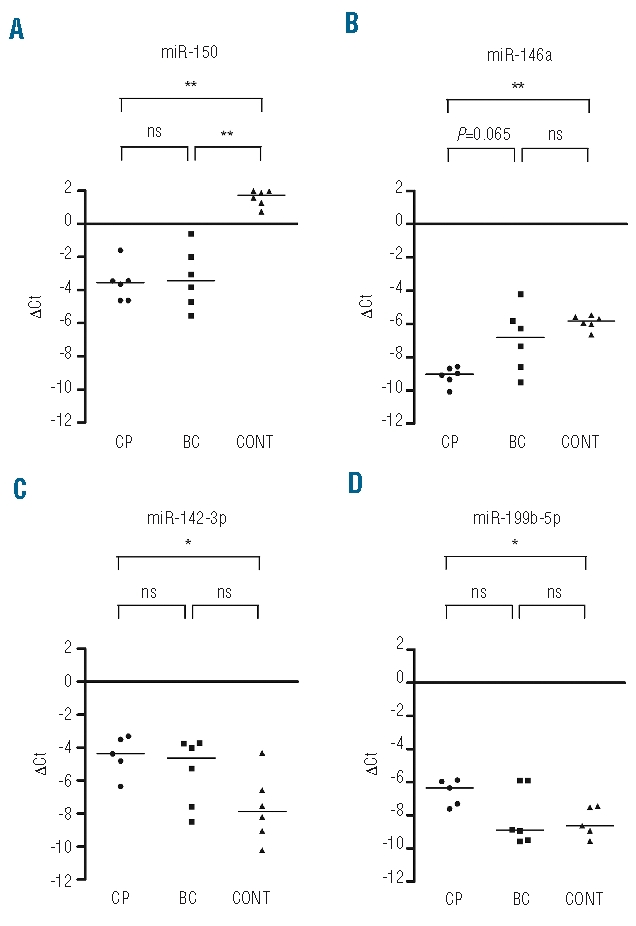
Analysis of miRNA expression in a subsequent test set of CML patients. Expression level (ΔCt) of miR-150 (A), miR-146a (B), miR-142-3p (C), and miR-199b-5p (D) in 6 chronic phase (CP) and 6 blast crisis (BC) CML patients. *P<0.05; **P<0.01; ns: no significant difference (2-tailed Mann-Whitney test). Bar: median; cont: normal control PBMCs.
Target gene prediction analysis
In order to provide insights regarding genes of relevance for CML that could be targeted by the miRNAs identified in our study, we searched for predictions using TargetScan 5.0,19 considering genes simultaneously targeted by the highly expressed miR-142-3p and miR-199b-5p, but not by miR-146a and miR-150, and vice-versa (Table 3). This approach relies on our recent observation that miRNA targets are often targeted at multiple sites,28 which substantially enhances the specificity of predictions. Putative target genes of miR-142-3p and miR-199b-5p included ARGHEF12, MAP3K11, and MYH9, while the complementary analysis identified 2 known genes putatively co-targeted by miR-146a and miR-150, including the metalloproteinase gene MMP16. Searching for genes targeted by any individual miRNA but not the other 2 (e.g. genes targeted by miR-146a or miR-150, but not by miR-142-3p nor miR-199b-5p) resulted in larger numbers of candidate genes (Online Supplementary Table S6).
Table 3.
Target gene predictions for differentially expressed miRNAs in chronic myeloid leukemia.

Discussion
In this study, we analyzed the expression profile of miRNAs in patients newly diagnosed with CML undergoing upfront therapy with imatinib mesylate (IM). Of 141 mature miRNAs consistently detected, 52 were differentially expressed by more than 1.5-fold, most of which exhibited reduced expression by day 14 of IM therapy compared to pre-treatment samples. We demonstrated the significantly increased expression of miR-150 and miR-146a, and decreased expression of miR-142-3p and miR-199b-5p in PBMCs of CML patients after 14 days of IM treatment. Expression levels of miRNAs tended to normalize to levels seen in non-leukemic PBMCs by day 14 of IM treatment. The changes in miRNA expression are likely attributable to the leukemic cells, since after two weeks of IM therapy, only one patient had achieved complete hematologic remission (Table 1). Therefore, we identified miRNAs that are modulated in vivo by imatinib in CML patients.
We found that miR-150, miR-146a, miR-142-3p and miR-199b-5p consistently exhibited aberrant expression in an additional group of patients with CML at diagnosis compared to healthy subjects. This raises the possibility that these miRNAs could be involved in Bcr-Abl-mediated leukemogenesis, although further studies are required to show whether they display differential expression in more primitive hematopoietic cells of CML patients during IM treatment. Interestingly, Venturini et al.16 identified miR-142-3p as being decreased in K562 cells after IM treatment, although its differential expression was not conclusively demonstrated in primary CML samples. Moreover, in CD34+ cells of AML patients, a high expression of miR-199a, which belongs to the same miRNA family as miR-199b, was recently shown to be associated with poor outcome.10 The CD34+ cells from AML samples also exhibited reduced expression of miR-146 with respect to CD34+ cells from healthy subjects.10
Recently, Agirre et al.29 reported decreased expression of miR-10a, miR-150 and miR-151, and increased expression of miR-96, in both CD34+ and bone marrow mononuclear cells of CML patients at diagnosis compared to healthy subjects. This is consistent with our data demonstrating decreased expression of miR-150 in CML samples, and increased expression of miR-151 and miR-10a by day 14 following IM treatment (Online Supplementary Table S2). These data suggest that the aberrant expression of miR-150, miR-146a, miR-142-3p and miR-199b-5p identified in our study likely plays a role in leukemic cells, and potentially in the more primitive hematopoietic compartment in chronic phase CML patients.
miR-146a, miR-155 and miR-132 have been shown to be increased in monocytes in response to LPS stimulation, suggesting their involvement in the regulation of the immune system.30 Since we found an increased expression in both miR-132 and miR-146a by day 14 of IM treatment (Table S1), their reduced expression in CML cells could play a role in impairing an immune response against CML cells. Also of interest was the increased expression of miR-215 and miR-192 after IM treatment. These miRNAs were recently shown to be increased by p53 in diverse settings, and to contribute to subsequent cell cycle arrest.31 Given that IM treatment induced p53 expression in BCR-ABL-expressing cells,32 it is, therefore, possible that miR-215 and miR-192 could play a role in IM-induced, p53-mediated cell cycle regulation of CML cells.
miRNA expression levels before treatment correlated with various clinical parameters, including WBC, platelet counts and hemoglobin levels (Table 2). In addition, we found a correlation between miR-142-3p expression level in CML patients and the Sokal risk score at diagnosis. Expression of both miR-150 and miR-146a was consistent for all but one patient (Figure 2A). In contrast to the other 10 patients, this patient exhibited decreased expression of these miRNAs by day 14 of IM treatment compared to day 0. Interestingly, this patient was the only one who ceased IM treatment after four months, having achieved complete hematologic remission, because of the occurrence of acute hepatitis. Although it is only one case, it will be of interest to determine whether measuring miR-150 and miR-146a expression as early as within the first two weeks of IM therapy could be indicative of IM intolerance later on. Of note, this patient was included in the TLDA analysis, which may explain, at least in part, the high heterogeneity observed in the miRNA expression results.
We identified several genes predicted to be targets of both miR-142-3p and miR-199b-5p, and neither miR-146a nor miR-150 (and vice versa), that are known to be involved in hematopoiesis or leukemia, including ARHGEF12, MAP3K11, and MYH9. The Rho guanine nucleotide exchange factor gene ARHGEF12 (also known as LARG) was first identified as a fusion partner for MLL in acute myeloid leukemia.23 MAP3K11 encodes a serine/threonine kinase involved in the activation of both the p38 MAPK and JNK signaling pathways.33 This gene was shown to interact functionally with BCR-ABL in fibroblast and hematopoietic cell transformation.24 The gene MYH9 encodes a non-muscle myosin heavy chain which is up-regulated in myeloid cells upon differentiation25 and is mutated in several hematopoietic disorders.34 Genes putatively co-targeted by miR-146a and miR-150 included MMP16/MT3-MMP, which encodes a metalloproteinase that confers basement membrane transmigration ability to cancer cells.35 Of note, it was recently suggested that miR-146b, another member of the miR-146 family, targeted MMP16 in the human U373 glioma cells.27
In addition to these predictions, a number of genes have already been validated as being targeted by these miRNAs. Specifically, miR-150 targets the oncogene MYB,36,37 which encodes a transcription factor that is often over-expressed in hematologic malignancies, including CML.38 Furthermore, in a mouse model of CML blast crisis, it was recently found that c-Myb was required for Bcr-Abl-dependent leukemogenesis.39 Interestingly, overexpression of miR-150 in K562 CML cells strongly inhibits c-MYB protein expression.37 It is thus possible that c-Myb upregulation induced by Bcr-Abl may be mediated, at least in part, by the reduced expression of miR-150. miR-146 was recently shown to negatively regulate the NF-κB pathway by inhibiting the expression of IRAK1 and TRAF6.30,40 NF-κB transcriptional activity is constitutively activated by Bcr-Abl and mediates Bcr-Abl-induced transformation in cell lines and primary cells.41,42 Furthermore, inhibition of NF-κB activity induces apoptosis of BCR-ABL-expressing cells.43 This suggests that reduced expression of miR-146a could be involved in the constitutive activation of NF-κB signaling induced by Bcr-Abl, thereby contributing to its transforming and anti-apoptotic activity. In support of these ideas, both MYB and TRAF6 were identified in our target gene prediction analysis as not being targeted by either miR-142-3p or miR-199b-5p (Online Supplementary Table S6). miR-199b-5p was recently reported to negatively regulate the Notch pathway in meduloblastoma cells by inhibiting the Notch target gene HES1, leading to reduced cell proliferation.44 Interestingly, constitutive activation of Notch in K562 cells was shown to inhibit cell proliferation and colony-forming activity, along with increased HES1 mRNA levels.45 It is, therefore, possible that the increased expression of miR-199b-5p could play a role in the inhibition of Notch signaling in CML cells, contributing to their increased proliferative activity.
In summary, IM treatment results in a relatively rapid increase in the expression of miR-150 and miR-146a, and decreased expression of miR-142-3p and miR-199b-5p in PBMCs of patients newly diagnosed with CML. We showed that the aberrant expression level of these miRNAs was tending towards normal levels after only two weeks of IM therapy. These miRNAs, by regulating certain predicted and known target genes, may be involved in Bcr-Abl-driven leukemogenesis.
Acknowledgements
the authors would like to thank Wilfred Leung for providing technical assistance.
Footnotes
Funding: this work was supported by the Fondation de France contre la Leucémie, the Australian National Health and Medical Research Council Project Grant (358300 to J.E.J.R.) and Training fellowship (571156 to W.R.), the Rebecca L. Cooper Foundation, the Cell and Gene Trust, the Clive and Vera Ramaciotti Foundation, and the Cancer Institute of NSW.
Authorship and Disclosures
SF, AGT, and JEJR designed the research; SF performed the experiments and analyzed data; WR analyzed the TLDA results and performed the target gene prediction analysis; JG analyzed data and performed statistical analyses; JH contributed design of the TLDA experiments and provided conceptual input; M-LB and J-CC processed patient samples; FG and AGT provided patient samples and clinical data; SF and JEJR wrote the manuscript.
The authors declare the following competing financial interests: AGT: Bristol Myers, Novartis (Honoraria, travel expenses). JEJR: Sydney IVF (Approved pathology practitioner and member of Ethics Committee), Gilead Biosciences (Honorarium for lectures, travel expenses).
The online version of this article has a Supplementary Appendix.
References
- 1.Bartel DP. MicroRNAs: target recognition and regulatory functions. Cell. 2009;136(2):215–33. doi: 10.1016/j.cell.2009.01.002. [DOI] [PMC free article] [PubMed] [Google Scholar]
- 2.Carthew RW, Sontheimer EJ. Origins and Mechanisms of miRNAs and siRNAs. Cell. 2009;136(4):642–55. doi: 10.1016/j.cell.2009.01.035. [DOI] [PMC free article] [PubMed] [Google Scholar]
- 3.Lu J, Getz G, Miska EA, Alvarez-Saavedra E, Lamb J, Peck D, et al. MicroRNA expression profiles classify human cancers. Nature. 2005;435(7043):834–8. doi: 10.1038/nature03702. [DOI] [PubMed] [Google Scholar]
- 4.Volinia S, Calin GA, Liu CG, Ambs S, Cimmino A, Petrocca F, et al. A microRNA expression signature of human solid tumors defines cancer gene targets. Proc Natl Acad Sci USA. 2006;103(7):2257–61. doi: 10.1073/pnas.0510565103. [DOI] [PMC free article] [PubMed] [Google Scholar]
- 5.Chen CZ, Li L, Lodish HF, Bartel DP. MicroRNAs modulate hematopoietic lineage differentiation. Science. 2004;303 (5654):83–6. doi: 10.1126/science.1091903. [DOI] [PubMed] [Google Scholar]
- 6.Calin GA, Dumitru CD, Shimizu M, Bichi R, Zupo S, Noch E, et al. Frequent deletions and down-regulation of micro- RNA genes miR15 and miR16 at 13q14 in chronic lymphocytic leukemia. Proc Natl Acad Sci USA. 2002;99(24):15524–9. doi: 10.1073/pnas.242606799. [DOI] [PMC free article] [PubMed] [Google Scholar]
- 7.Calin GA, Ferracin M, Cimmino A, Di Leva G, Shimizu M, Wojcik SE, et al. A MicroRNA signature associated with prognosis and progression in chronic lymphocytic leukemia. N Engl J Med. 2005;353(17):1793–801. doi: 10.1056/NEJMoa050995. [DOI] [PubMed] [Google Scholar]
- 8.Marton S, Garcia MR, Robello C, Persson H, Trajtenberg F, Pritsch O, et al. Small RNAs analysis in CLL reveals a deregulation of miRNA expression and novel miRNA candidates of putative relevance in CLL pathogenesis. Leukemia. 2008;22(2):330–8. doi: 10.1038/sj.leu.2405022. [DOI] [PubMed] [Google Scholar]
- 9.Mi S, Lu J, Sun M, Li Z, Zhang H, Neilly MB, et al. MicroRNA expression signatures accurately discriminate acute lymphoblastic leukemia from acute myeloid leukemia. Proc Natl Acad Sci USA. 2007;104(50):19971–6. doi: 10.1073/pnas.0709313104. [DOI] [PMC free article] [PubMed] [Google Scholar]
- 10.Garzon R, Volinia S, Liu CG, Fernandez-Cymering C, Palumbo T, Pichiorri F, et al. MicroRNA signatures associated with cytogenetics and prognosis in acute myeloid leukemia. Blood. 2008;111(6):3183–9. doi: 10.1182/blood-2007-07-098749. [DOI] [PMC free article] [PubMed] [Google Scholar]
- 11.Li Z, Lu J, Sun M, Mi S, Zhang H, Luo RT, et al. Distinct microRNA expression profiles in acute myeloid leukemia with common translocations. Proc Natl Acad Sci USA. 2008;105(40):15535–40. doi: 10.1073/pnas.0808266105. [DOI] [PMC free article] [PubMed] [Google Scholar]
- 12.Garzon R, Croce CM. MicroRNAs in normal and malignant hematopoiesis. Curr Opin Hematol. 2008;15(4):352–8. doi: 10.1097/MOH.0b013e328303e15d. [DOI] [PubMed] [Google Scholar]
- 13.O’Connell RM, Rao DS, Chaudhuri AA, Boldin MP, Taganov KD, Nicoll J, et al. Sustained expression of microRNA-155 in hematopoietic stem cells causes a myeloproliferative disorder. J Exp Med. 2008;205(3):585–94. doi: 10.1084/jem.20072108. [DOI] [PMC free article] [PubMed] [Google Scholar]
- 14.He L, Thomson JM, Hemann MT, Hernando-Monge E, Mu D, Goodson S, et al. A microRNA polycistron as a potential human oncogene. Nature. 2005;435(7043):828–33. doi: 10.1038/nature03552. [DOI] [PMC free article] [PubMed] [Google Scholar]
- 15.Xiao C, Srinivasan L, Calado DP, Patterson HC, Zhang B, Wang J, et al. Lymphoproliferative disease and autoimmunity in mice with increased miR-17–92 expression in lymphocytes. Nat Immunol. 2008;9(4):405–14. doi: 10.1038/ni1575. [DOI] [PMC free article] [PubMed] [Google Scholar]
- 16.Venturini L, Battmer K, Castoldi M, Schultheis B, Hochhaus A, Muckenthaler MU, et al. Expression of the miR-17–92 polycistron in chronic myeloid leukemia (CML) CD34+ cells. Blood. 2007;109(10):4399–405. doi: 10.1182/blood-2006-09-045104. [DOI] [PubMed] [Google Scholar]
- 17.Ren R. Mechanisms of BCR-ABL in the pathogenesis of chronic myelogenous leukaemia. Nat Rev Cancer. 2005;5(3):172–83. doi: 10.1038/nrc1567. [DOI] [PubMed] [Google Scholar]
- 18.Hochhaus A, O’Brien SG, Guilhot F, Druker BJ, Branford S, Foroni L, et al. Six-year follow-up of patients receiving imatinib for the first-line treatment of chronic myeloid leukemia. Leukemia. 2009;23(6):1054–61. doi: 10.1038/leu.2009.38. [DOI] [PubMed] [Google Scholar]
- 19.Friedman RC, Farh KK, Burge CB, Bartel DP. Most mammalian mRNAs are conserved targets of microRNAs. Genome Res. 2009;19(1):92–105. doi: 10.1101/gr.082701.108. [DOI] [PMC free article] [PubMed] [Google Scholar]
- 20.Xiao C, Rajewsky K. MicroRNA control in the immune system: basic principles. Cell. 2009;136(1):26–36. doi: 10.1016/j.cell.2008.12.027. [DOI] [PubMed] [Google Scholar]
- 21.Sokal JE, Baccarani M, Tura S, Fiacchini M, Cervantes F, Rozman C, et al. Prognostic discrimination among younger patients with chronic granulocytic leukemia: relevance to bone marrow transplantation. Blood. 1985;66(6):1352–7. [PubMed] [Google Scholar]
- 22.Martello G, Zacchigna L, Inui M, Montagner M, Adorno M, Mamidi A, et al. MicroRNA control of Nodal signalling. Nature. 2007;449(7159):183–8. doi: 10.1038/nature06100. [DOI] [PubMed] [Google Scholar]
- 23.Kourlas PJ, Strout MP, Becknell B, Veronese ML, Croce CM, Theil KS, et al. Identification of a gene at 11q23 encoding a guanine nucleotide exchange factor: evidence for its fusion with MLL in acute myeloid leukemia. Proc Natl Acad Sci USA. 2000;97(5):2145–50. doi: 10.1073/pnas.040569197. [DOI] [PMC free article] [PubMed] [Google Scholar]
- 24.Mahlmann S, McLaughlin J, Afar DE, Mohr R, Kay RJ, Witte ON. Dissection of signaling pathways and cloning of new signal transducers in tyrosine kinase-induced pathways by genetic selection. Leukemia. 1998;12(12):1858–65. doi: 10.1038/sj.leu.2401231. [DOI] [PubMed] [Google Scholar]
- 25.Toothaker LE, Gonzalez DA, Tung N, Lemons RS, Le Beau MM, Arnaout MA, et al. Cellular myosin heavy chain in human leukocytes: isolation of 5′ cDNA clones, characterization of the protein, chromosomal localization, and upregulation during myeloid differentiation. Blood. 1991;78(7):1826–33. [PubMed] [Google Scholar]
- 26.Bernardi R, Guernah I, Jin D, Grisendi S, Alimonti A, Teruya-Feldstein J, et al. PML inhibits HIF-1alpha translation and neoangiogenesis through repression of mTOR. Nature. 2006;442(7104):779–85. doi: 10.1038/nature05029. [DOI] [PubMed] [Google Scholar]
- 27.Xia H, Qi Y, Ng SS, Chen X, Li D, Chen S, et al. microRNA-146b inhibits glioma cell migration and invasion by targeting MMPs. Brain Res. 2009;1269:158–65. doi: 10.1016/j.brainres.2009.02.037. [DOI] [PubMed] [Google Scholar]
- 28.Ritchie W, Flamant S, Rasko JE. Predicting microRNA targets and functions: traps for the unwary. Nat Methods. 2009;6(6):397–8. doi: 10.1038/nmeth0609-397. [DOI] [PubMed] [Google Scholar]
- 29.Agirre X, Jimenez-Velasco A, San Jose-Eneriz E, Garate L, Bandres E, Cordeu L, et al. Down-regulation of hsa-miR-10a in chronic myeloid leukemia CD34+ cells increases USF2-mediated cell growth. Mol Cancer Res. 2008;6(12):1830–40. doi: 10.1158/1541-7786.MCR-08-0167. [DOI] [PubMed] [Google Scholar]
- 30.Taganov KD, Boldin MP, Chang KJ, Baltimore D. NF-kappaB-dependent induction of microRNA miR-146, an inhibitor targeted to signaling proteins of innate immune responses. Proc Natl Acad Sci USA. 2006;103(33):12481–6. doi: 10.1073/pnas.0605298103. [DOI] [PMC free article] [PubMed] [Google Scholar]
- 31.Georges SA, Biery MC, Kim SY, Schelter JM, Guo J, Chang AN, et al. Coordinated regulation of cell cycle transcripts by p53-Inducible microRNAs, miR-192 and miR-215. Cancer Res. 2008;68(24):10105–12. doi: 10.1158/0008-5472.CAN-08-1846. [DOI] [PubMed] [Google Scholar]
- 32.Wendel HG, de Stanchina E, Cepero E, Ray S, Emig M, Fridman JS, et al. Loss of p53 impedes the antileukemic response to BCR-ABL inhibition. Proc Natl Acad Sci USA. 2006;103(19):7444–9. doi: 10.1073/pnas.0602402103. [DOI] [PMC free article] [PubMed] [Google Scholar]
- 33.Tibbles LA, Ing YL, Kiefer F, Chan J, Iscove N, Woodgett JR, et al. MLK-3 activates the SAPK/JNK and p38/RK pathways via SEK1 and MKK3/6. EMBO J. 1996;15(24):7026–35. [PMC free article] [PubMed] [Google Scholar]
- 34.Seri M, Cusano R, Gangarossa S, Caridi G, Bordo D, Lo Nigro C, et al. Mutations in MYH9 result in the May-Hegglin anomaly, and Fechtner and Sebastian syndromes. The May-Heggllin/Fechtner Syndrome Consortium. Nat Genet. 2000;26(1):103–5. doi: 10.1038/79063. [DOI] [PubMed] [Google Scholar]
- 35.Hotary K, Li XY, Allen E, Stevens SL, Weiss SJ. A cancer cell metalloprotease triad regulates the basement membrane transmigration program. Genes Dev. 2006;20(19):2673–86. doi: 10.1101/gad.1451806. [DOI] [PMC free article] [PubMed] [Google Scholar]
- 36.Xiao C, Calado DP, Galler G, Thai TH, Patterson HC, Wang J, et al. MiR-150 controls B cell differentiation by targeting the transcription factor c-Myb. Cell. 2007;131(1):146–59. doi: 10.1016/j.cell.2007.07.021. [DOI] [PubMed] [Google Scholar]
- 37.Lu J, Guo S, Ebert BL, Zhang H, Peng X, Bosco J, et al. MicroRNA-mediated control of cell fate in megakaryocyte-erythrocyte progenitors. Dev Cell. 2008;14(6):843–53. doi: 10.1016/j.devcel.2008.03.012. [DOI] [PMC free article] [PubMed] [Google Scholar]
- 38.Slamon DJ, Boone TC, Murdock DC, Keith DE, Press MF, Larson RA, et al. Studies of the human c-myb gene and its product in human acute leukemias. Science. 1986;233(4761):347–51. doi: 10.1126/science.3014652. [DOI] [PubMed] [Google Scholar]
- 39.Lidonnici MR, Corradini F, Waldron T, Bender TP, Calabretta B. Requirement of c-Myb for p210(BCR/ABL)-dependent transformation of hematopoietic progenitors and leukemogenesis. Blood. 2008;111(9):4771–9. doi: 10.1182/blood-2007-08-105072. [DOI] [PMC free article] [PubMed] [Google Scholar]
- 40.Bhaumik D, Scott GK, Schokrpur S, Patil CK, Campisi J, Benz CC. Expression of microRNA-146 suppresses NF-kappaB activity with reduction of metastatic potential in breast cancer cells. Oncogene. 2008;27(42):5643–7. doi: 10.1038/onc.2008.171. [DOI] [PMC free article] [PubMed] [Google Scholar]
- 41.Hamdane M, David-Cordonnier MH, D’Halluin JC. Activation of p65 NF-kappaB protein by p210BCR-ABL in a myeloid cell line (P210BCR-ABL activates p65 NF-kappaB) Oncogene. 1997;15(19):2267–75. doi: 10.1038/sj.onc.1201411. [DOI] [PubMed] [Google Scholar]
- 42.Reuther JY, Reuther GW, Cortez D, Pendergast AM, Baldwin AS., Jr A requirement for NF-kappaB activation in Bcr-Abl-mediated transformation. Genes Dev. 1998;12(7):968–81. doi: 10.1101/gad.12.7.968. [DOI] [PMC free article] [PubMed] [Google Scholar]
- 43.Duncan EA, Goetz CA, Stein SJ, Mayo KJ, Skaggs BJ, Ziegelbauer K, et al. IkappaB kinase beta inhibition induces cell death in Imatinib-resistant and T315I Dasatinib-resistant BCR-ABL+ cells. Mol Cancer Ther. 2008;7(2):391–7. doi: 10.1158/1535-7163.MCT-07-0305. [DOI] [PubMed] [Google Scholar]
- 44.Garzia L, Andolfo I, Cusanelli E, Marino N, Petrosino G, De Martino D, et al. MicroRNA-199b-5p impairs cancer stem cells through negative regulation of HES1 in medulloblastoma. PLoS ONE. 2009;4(3):e4998. doi: 10.1371/journal.pone.0004998. [DOI] [PMC free article] [PubMed] [Google Scholar]
- 45.Yin DD, Fan FY, Hu XB, Hou LH, Zhang XP, Liu L, et al. Notch signaling inhibits the growth of the human chronic myeloid leukemia cell line K562. Leuk Res. 2009;33(1):109–14. doi: 10.1016/j.leukres.2008.06.023. [DOI] [PubMed] [Google Scholar]