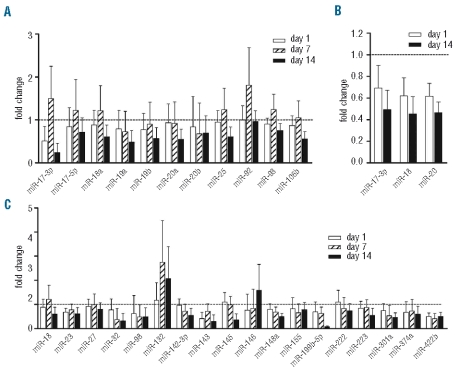
Figure 1.
Identification of miRNAs differentially expressed in CML patients during imatinib mesylate (IM) therapy. (A) Average fold change compared to pre-treatment levels of the miR-17~92 cluster members using TaqMan low density array (TLDA) analysis (n=4). (B) QRT-PCR validation of the TLDA results showing the fold change in miR-17-3p, miR-18, and miR-20 after 1 and 14 days of IM treatment. (C) Fold change of a selection of 18 miRNAs from the TLDA analysis at day 1, 7, and 14, relative to day 0 (set to 1). Data represent mean + SD of the 4 samples tested.

