Abstract
We have developed a generic approach to determine enzyme activities in vitro and monitor their functional status in vivo. Specifically, a method to generate donor (CbOH)-acceptor (Me2NCp) near infrared (NIR) fluorescent dye pairs for preparing enzyme activatable molecular systems were developed based on the structural template of heptamethine cyanine dyes. Using caspase-3 as a model enzyme, we prepared two new caspase-3 sensitive compounds with high fluorescence quenching efficiency: Me2NCp-DEVD-K(CbOH)-OH (4) and AcGK(Me2NCp)-DEVD-APK(CbOH)-NH2 (5). The mechanism of quenching was based on combined effects of direct (classical) and reverse fluorescence resonance energy transfer (FRET). Caspase-3 cleavage of the scissile DEVD amide bond regenerated the NIR fluorescence of both donor and acceptor dyes. While both compounds were cleaved by caspase-3, substrate 5 was cleaved more readily than 4, yielding kcat and KM, values of 1.02 ± 0.06 s−1 and 15 ± 3 μM, respectively. Treatment of A549 tumor cells with paclitaxel resulted in >2-fold increase in the fluorescence intensity by NIR confocal microscopy, suggesting the activation of pro-caspase-3 to caspase-3. A similar trend was observed in a mouse model, where the fluorescence intensity was nearly twice the value in caspase-3-rich tissue relative to the control. These results demonstrate the use of the same NIR activatable molecular systems for monitoring the activities of enzymes across a wide spatial scale ranging from in vitro kinetics measurements to in cellulo and in vivo localization of caspase-3 activation. The NIR activatable molecular probes provide an effective strategy to screen new drugs in vitro and monitor treatment response in living organisms.
Keywords: Enzyme kinetics, caspase, near infrared fluorescence, activatable probes, quenching mechanism, FRET
Introduction
Discovery of disease biomarkers and molecular targets for biomedical application has been accelerated by advances in the fields of genomics and proteomics.1 Often, specific diseased tissue volume exhibits heterogeneous expression of multiple molecular targets and the molecular expression patterns can vary during disease development.2 Subsequent translation of these findings from in vitro assays to living systems is the central focus of in vivo molecular imaging.3–5 An important goal of molecular imaging is to provide adequate in vivo characterization of diseases and accurate prognosis through imaging a specific molecular target or an array of diverse molecular processes simultaneously. Although CT and MRI provide high anatomical resolution, their low contrast sensitivity limits the current utility of these methods in molecular imaging.6 Instead, molecular imaging in humans is mostly pursued using highly sensitive radionuclear methods such as positron emission tomography (PET). However, the use of ionizing radiation presents significant logistical barriers, and PET is inefficient for longitudinal studies due to the short half-life of the radioisotopes. Moreover, microscopic cellular imaging with PET is currently impracticable, thereby precluding direct validation of in vivo findings with radioisotopes in cells. Thus, for high-resolution cellular studies, high throughput screening, and identification of new molecular targets in cells and in vivo, fluorescence methods remain dominant.
Translation of fluorescence cell microscopy methods to in vivo molecular imaging has been spurred by concurrent advancements in photonics (e.g. light sources, detectors, and filters), tissue optics, imaging methodologies, and near-infrared (NIR) fluorescent molecular probes (e.g. molecules conjugated to tumor targeting moieties such as antibodies, peptides and peptidomimetics). 7–10 Imaging in the NIR region between 700 and 900 nm is attractive for biological imaging because low tissue absorption of light allows excitation photons to reach deep tissues (estimated at >10 cm),11 thereby extending the utility of optical imaging beyond superficial tissues and organs.
The unique ability to selectively activate the fluorescence signal of fluorescent dyes has facilitated their use in detecting and monitoring the activities of diagnostic and prognostic enzymes in cells and a variety of animal models of human diseases.11–14 Motivated in part by the lack of efficient non-polymeric activatable NIR fluorescent probes, initial studies focused on the use of self-quenched dyes anchored on polymeric materials.11, 12,14 Despite the successful demonstration of using these probes in optical imaging, the complexity and large size of the polymer constructs limit their use and present additional regulatory hurdles for human applications. For these reasons, efforts to develop simpler NIR FRET systems have recently increased.13, 15,16 In particular, such systems with smaller size have several advantages, including rapid diffusion to target organs, delivery to extravascular space, ease of synthesis and product characterization, evasion of the immune surveillance system, and targeting of both extracellular and intracellular disease biomarkers.
In this study, we describe a generic approach for developing simple stealth NIR fluorescent enzyme substrates that can be activated by an enzyme. We also demonstrate the feasibility of using the probes to determine enzyme kinetics parameters as well as to conduct in vivo imaging of the enzyme activity. Although the method is applicable to many proteases, we used caspase-3 as a model system because of its role in programmed cell death (apoptosis induction), which provides a method for monitoring the efficacy of new drugs and the disease response to treatment.
Experimental Methods
Synthesis
A Varian 300 MHz NMR was used to characterize the dyes and Shimadzu LCMS system was used to monitor compound synthesis and additional characterization by Electron Ionization (EI) MS in the positive ion mode. Purity of compounds was determined with an analytical HPLC system monitored at 214 nm wavelength for dye-peptide conjugates. Compound 2 was prepared by the method described in the literature.17 A similar method was used to prepare compound 1 (cybate), which was isolated as glisten purple solid without the need for additional purification by chromatography. MS/EI: 525.6 (M+H+). 1H NMR (300 MHz, CD3OD) δ1.69 (s, 12 H), 2.79 (t, J = 7.2 Hz, 4H), 4.37 (t, J = 7.2 Hz, 4H), 6.34 (d, J = 13.8 Hz, 2H), 6.57 (t, J = 12.6 Hz, 2H), 7.21–7.48 (m, 8H), 7.61 (t, J = 13.2 Hz, 1H), 7.95 (t, J = 13.2 Hz, 2H); 13C NMR (75 MHz, CD3OD) δ 28.1, 32.8, 41.1, 50.5, 105.2, 112.1, 123.5, 126.2, 127.6, 129.9, 142.5, 143.4, 143.5, 153.4, 173.4, 174.0.
Preparation of the dimethyl amide derivative of cypate (3) was achieved by the reaction of 2 (1 mmol) with N,N-dimethylamine (0.4 mmol) in a mixture of DMF and DCM at room temperature for 3 h. Compound 3 was isolated from the crude products by normal phase chromatography to afford up to 35% of the compound. MS/EI: 652.2 (M+H+). 1H NMR (300 MHz, CD3OD) δ 1.97 (s, 12 H), 2.86–2.98 (m, 10H), 4.49 (t, J = 6.6 Hz, 4H), 6.36 (d, J = 13.2 Hz, 2H), 6.60 (t, J = 12.6 Hz, 2H), 7.46 (t, J = 8.1 Hz, 2H), 7.57-7.64 (m, 5H), 7.96-8.09 (m, 6H), 8.22 (d, J = 8.1 Hz, 2H); 13C NMR (75 MHz, CD3OD) δ 27.7, 31.8, 33.0, 36.0, 38.0, 41.2, 41.8, 52.3, 104.8, 112.1, 112.2, 123.5, 126.1, 127.6, 128.8, 129.6, 131.2, 131.8, 133.5, 134.9, 141.0, 152.3, 172.2, 174.0, 174.7.
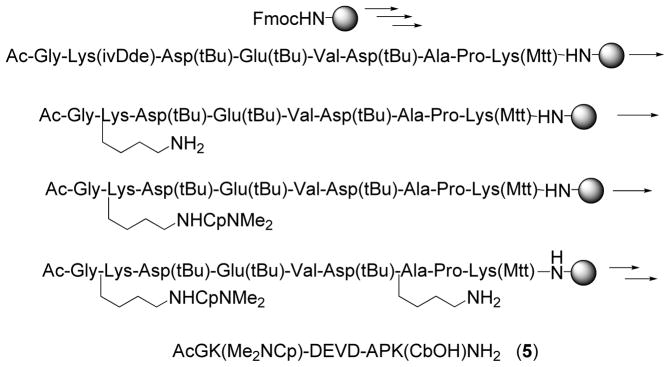
Caspase-3 peptide substrate was prepared on a 30-μmol scale by standard solid phase Fmoc peptide synthesis.18, 19 To selectively couple the dye to the peptide in compound 4, he N-terminal Fmoc was removed with 20% piperidine in DMF, followed by the coupling of dye 3 using standard coupling reagents HOBT/HBTU.19 Similarly, dye 1 was coupled to the ε-amino group of the C-terminal lysine after removing the ε-amino methyltrityl (Mtt) protecting group with 2% TFA in DCM. For compound 5, two orthogonally protected lysine amino acids were incorporated into the peptide sequence toward the N- (Lys (Dde)) and C- (Lys(Mtt)) termini. Conjugation of dye 3 was achieved after removing the ε-amino Mtt protecting group as described above. The second dye 1 was attached to the peptide after removing the ε-amino Dde protecting group with 20% hydrazine in DMF. The peptides were cleaved from the resin and all amino acid side chain protecting groups were removed with a cleavage mixture of 85% TFA, 5% H2O, 5% PhOH, and 5% thioanisole for 4 h at room temperature. The crude peptides were precipitated with cold tert-butyl methyl ether and purified by RP-HPLC using gradient elution protocol described previously.19. The purified compounds were lyophilized in 67% H2O and 33% MeCN and characterized by analytical HPLC and electrospray MS (EI-MS). MS/EI for Me2NCp-DEVD-KCbOH (4): 872.95 (M+2H+), 1745.70 (M+H+); MS/EI for AcGK(CpNMe2)-DEVD-APK(CbOH)NH2 (5): MS/EI 1069.25 (M+2H+).
Spectroscopy
The absorption spectra were recorded on a Beckman Coulter DU 640 spectrophotometer, and the fluorescence spectra were recorded on a Fluorolog III fluorometer with 700 nm excitation and 5 nm slits. All measurements were conducted at room temperature. Compounds 1–5 were dissolved in spectral grade DMSO and diluted with 20% DMSO in water. Molar absorptivities were determined as average using three point measurements at their absorption maximum. Fluorescence was measured at the appropriate excitation wavelength with absorbance below 0.1 to avoid an inner-filter effect. Fluorescence quantum yield was determined by comparison with ICG dissolved in 100% DMSO (QY=0.12).
Prior to enzymatic study, the compound 5 in assay buffer was split into two equal parts. One part was diluted with 1 mL of water in 1.5 mL eppendorf tube. After vigorous vortexing, the sample was transferred to a 1 mL semi-micro acrylic cuvette (Fisher Sci.) for optical measurements. Another part was enzymatically cleaved by caspase-3, diluted with water to 1 mL volume and placed in a 1 mL semi-micro acrylic cuvette for optical measurements.
Molecular modeling
Molecular modeling was conducted using CAChe 5.0 (The CAChe Group, Fujitsu, Beaverton, OR). The model molecule included all the amino acids in the chain but not the dyes. Both dyes were replaced with two atoms (carbons) located at each end of the chain, where nitrogens from the dyes would have been located. The distance between the dummy atoms was used as an approximate distance between two dyes and approximated the distance between the indolium nitrogen of 1 and benz[e]indolium nitrogen of 3. The geometry was first locally minimized using force field with MM3 parameters and then globally minimized using extensive conformation search implemented in CONFLEX package20 with MM3 parameters. The generated structures were optimized by Mechanics using Augmented MM3. After locating the global minimum conformation with CONFLEX, the conformational space of 5 was constructed by varying the distance between two dummy atoms. The energy was calculated at each distance within the range 25–60 Å and 0.5 Å increment. Total 71 points were optimized to generate a potential energy surface.
FRET calculation
The calculated Förster distance for the pairs was determined from emission spectra of the donor and absorption spectra of the acceptor using a FRET-calculator developed in our laboratory. The software calculates Förster radius (Ro) from raw absorption and emission spectra and plots the Energy Transfer (Et) vs. the distance between two dyes (r) using known equations21.
Fluorescence lifetime measurement
The fluorescence lifetime was measured using the time-correlated single-photon-counting (TCSPC) technique (Horiba) with excitation source NanoLed® 773 nm impulse repetition rate 1 MHz (Horiba) at 90o to the R928P detector (Hamamatsu Photonics, Japan). The detector was set to 820 nm with a 20 nm bandpass. The electrical signal was amplified by TB-02 pulse amplifier (Horiba) and the amplified signal was fed to the constant fraction discriminator CFD (Philips, The Netherlands). The first detected photon was used as a Start signal by time-to-amplitude converter (TAC) and the excitation pulse triggered the Stop signal. The multichannel analyzer (MCA) recorded repetitive start–stop signals from the TAC and generated a histogram of photons as a function of time-calibrated channels (6.88 ps/channel) until the peak signal reached 10,000 counts. The lifetime was recorded on a 50 ns scale. The instrument response function was obtained using Rayleigh scatter of Ludox-40 (0.03% in MQ water; Sigma-Aldrich) in a quartz cuvette at 773 nm emission. The measurements were conducted at room temperature. DAS6 v6.1 decay analysis software (Horiba) was used for lifetime calculations. The goodness of fit was judged by chi-squared values, Durbin–Watson parameters and visual observations of fitted line, residuals and autocorrelation function. Two-exponential decay equations for compounds in 20% DMSO/water solvents were used for data fitting. In all cases lifetime components with insignificant contribution (<3%) were discarded and the remaining lifetime components were used for further analysis.
NIR fluorescence confocal microscopy
We reconfigured a confocal fluorescence microscope (FV 1000, Olympus) to operate in the NIR wavelengths. A 785 nm laser diode coupled into a single mode fiber was used as a light source (FiberTEC-785, 40 mW, Blue Sky Research, Milpitas, CA). The output of the single mode fiber was collimated to a beam with diameter of 2.2 mm and divergence of 0.021°. The collimator and beam steering optical components were all mounted directly to the floating microscope optical breadboard. The light intensity was adjustable electronically via the laser driver as well as through use of neutral density filters in the path of the collimated beam. The maximum laser power directed into the FV1000 was 18 mW with a typical operational input power of ~1 mW. The beam was then steered into the FV1000 through the IR laser port and subsequent beam path. A dichroic filter at 785 nm (Z785RDC, Chroma Technology Corp, Rockingham, VT) reflected the beam into the excitation path and a band pass filter centered at 817 nm (FWHM =25 nm) served as a barrier filter to isolate NIR fluorescence emission before detection through the third channel FV1000 PMT. Alignment between the NIR and visible channels was achieved using a reflecting target. The resulting confocal microscope permits co-registered confocal imaging of both visible and NIR fluorescent probes. In addition to the NIR laser, we also used standard UV/vis lasers for imaging the nuclei, as described below.
Determination of caspase-3 enzyme kinetics parameters
Enzyme kinetics was carried out using commercially available recombinant human caspase-3 and a caspase-3 colorimetric substrate, Ac-DEVD-pNA. All reactions were carried out in an assay buffer consisting of 10 mM PIPES, pH 7.4, 2 mM EDTA, 0.1% CHAPS, 5 mM DTT. Hydrolyses were performed in triplicate in 96-well microtiter plates in a total volume of 200 μL. Compound 5 was formulated as a concentrated stock (10.7 mM, DMSO) where the concentration was determined by absorbance (ε780nm = 224,000 M−1cm−1 based on compound 2). Caspase-3 was formulated as a stock in assay buffer (5.8 nM). To determine the total concentration of catalytic sites of caspase-3 (i.e. [Et]), Ac-DEVD-pNA was incubated over a range of concentrations (2.5 to 50 μM) with caspase-3 (290 pM) in assay buffer (25°C) and the resulting increase in absorbance was measured on a microtiter plate reader (Synergy HT, BioTek Instruments, Inc., Winooski, VT) at λ = 504 nm. Initial velocities in terms of μM/s were determined by fitting the initial linear section of the progress curve. The initial velocity (vo) with respect to substrate concentration was fit to vo=kcat[Et][S]/(KM+[S]) using GraphPad Prism 4.0. Utilizing known kcat and KM values, the total enzyme concentration of caspase 3 was calculated. 13,22 The micro plate reader is not sensitive for detecting the NIR fluorescence of compounds 4 and 5 with high sensitivity. Therefore, the fluorescence released by enzyme mediated hydrolysis was measured at multiple time points on a LI-COR Odyssey™ Infrared Imaging System (LI-COR Biotechnology, Lincoln, NE) at λex=785 nm and λem=805 nm. The kcat and KM values of 5 were determined by incubating 5 (0.5 to 100 μM) with caspase 3 (290 pM) in assay buffer. Initial velocities were obtained from plots of fluorescence with respect to time using only the linear portion of the data. The slope from these plots was divided by the fluorescence corresponding to complete hydrolysis and multiplied by the substrate concentration to obtain initial velocity (vo) in units of μM/s. These initial velocities were plotted with respect to substrate concentration and fit non-linearly (vo=kcat[Et][S]/(KM+[S]), GraphPad Prism 4.0) to yield the turnover number (kcat) and Michaelis-Menten constant (KM). The error values are reported as ± standard error of the mean.
Detection of Caspase-3 activity induced by Paclitaxel in A549 cells using NIR confocal fluorescence microscopy
The lung cancer cell line, A549, was purchased from American Type Culture Collection (ATCC) Manassas, VA and maintained at 37°C and 5% CO2 in Ham’s F12K medium supplemented with 10% fetal bovine serum, 100 unit/ml penicillin, 100 μg/ml streptomycin. The cells (1×10⁵ cell/well) were cultured in LabTek 8-chamber slides (Nunc Inc. Rochest, NY) overnight. Transfection was performed on A549 cells incubated with 5μl of GeneJuice (Novagen, Madison, WI) and 10 μM of 5 in 100μl of opt-MEM medium (Invitrogen, Carlsbad, CA) in each well for 24 h at 37°C according to the manufacturer’s instructions. The transfected cells treated with 5μm Paclitaxel in culture medium for 2 h at 37° were washed three times with 0.01M PBS and imaged at room temperature using a reconfigured confocal fluorescence microscope. To detect NIR fluorescence enhancement, we modified our FV1000 confocal microscope with a 785 nm CW laser, as described above. The mean fluorescence intensity (Ex/Em=785/805–830) in the cytoplasm of 12 different cells was determined using the Olympus Fluoview software. The fluorescence intensity between the control and paclitaxel-treated A549 cells was plotted. Data are reported as means SD. For statistical comparison, t-test was employed and p values small than 0.05 were considered to be statistically significant.
In vivo imaging of caspase-3 activation of NIR fluorescent substrate
Male Swiss-Webster mice were anesthetized with isoflurane gas and positioned in dorsal recumbency for imaging in the LI-COR Odyssey™ NIR imaging system. All scans were completed with simultaneous excitation/emission measurement at 785/805 nm. For optimal positioning and autofluorescence measurement, low resolution (337 μm/pixel) fast scans were performed prior to intravenous administration of the caspase -3 substrate 5 (2 nmol in 20 μL 20% DMSO/water) via the lateral tail vein. This was followed by a high resolution (21 μm/pixel) scan immediately after position optimization. With minimal mouse movement, saline (10 μL) was injected intradermally into central region of the left pinna and caspase-3 (10 μg) in PBS (10 μL) was injected similarly into the right pinna. High resolution scans were performed every 6 minutes for 1 h postinjection. For image analysis, equal-size regions of interest were drawn around the injection site and total fluorescence intensity was counted for comparison.
Results and Discussion
Choice of NIR fluorescent dye pair
Designing a cleavable NIR fluorescent molecular systems required careful selection of the two dyes. The majority of NIR fluorescent dyes used in optical imaging studies are polymethine carbocyanine dyes because of their excellent spectral properties and biocompatibility.7,14, 23 Naturally, we employed polymethine dyes to construct the activatable probe. To be successful, a high level of the energy transfer (e.g. FRET) between the two dyes on the probe had to be achieved and required the selection of two carbocyanine dyes with different but overlapping spectra. We envisioned that one of the most critical requirements in the probe design would be the absence of fluorescence prior to activation and high fluorescence upon activation. For in vivo imaging, quenching the emission from both a donor and an acceptor dye would provide high signal-to-noise ratio after enzymatic cleavage by capturing light emanating from the donor, acceptor, or both. Traditional donor-acceptor FRET probes, where the donor is quenched and acceptor is not, will not fully satisfy this criterion because fluorescence from the acceptor produces significant amount of emission prior to activation, substantially increasing a background signal. This is particularly significant in non-polymeric NIR fluorescence-quenched molecular systems where the broad absorption spectrum of the polymethine dyes preclude selective excitation of the donor dye without exciting the acceptor dye. Complete fluorescence quenching of the donor-acceptor dyes would require a dye pair with double energy transfer involving a direct (donor’s emission and acceptor’s absorption) and a reverse (acceptor’s emission and donor’s absorption) spectral overlap. The inherent narrow broad absorption and emission spectra as well as the small Stokes shift of polymethine dyes makes them suitable for this application.
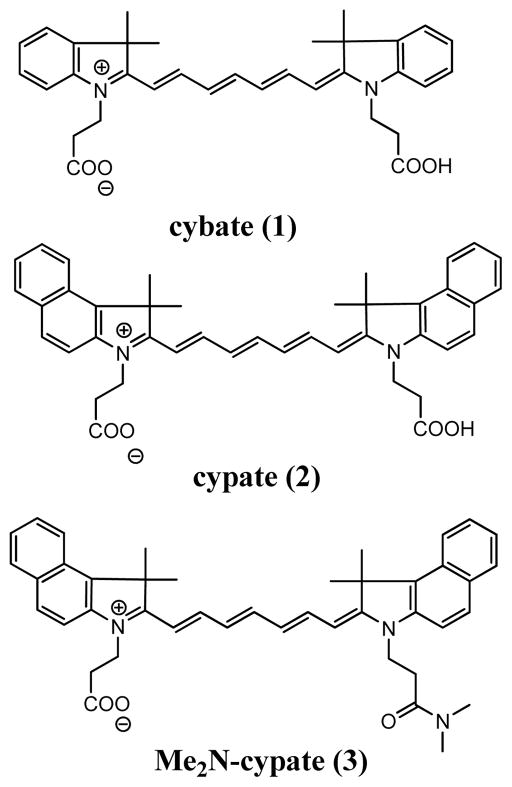
Polymethine carbocyanine consist of two heterocyclic groups (indolium or benzoindolium) linked by a heptamethine bridge (Figure 1). Altering the length of a methine chain is an established method to shift absorption and fluorescence spectra in relatively large 100 nm steps. In addition, modification of their heterocyclic rings is a known method to generate smaller spectral shifts (1–50 nm),16 thus allowing fine tuning of dye’s optical properties. To utilize this approach in the probe design, the absorption of the short-wavelength dye should fall within 40 nm of the long-wavelength dye. It is obvious that a change in the number of methine groups is less favorable for these molecules because the 100 nm shift in the absorption spectrum will minimize spectral overlap between the donor and acceptor dyes, preventing the reverse energy transfer and rendering ineffective the direct mechanism. This lack of spectral overlap will, therefore, produce significant background fluorescence from the donor dye and residual fluorescence from the acceptor dye.
Figure 1.
Structures of NIR fluorescent dyes developed for enhanced spectral overlap for efficient donor and acceptor fluorescence quenching. Modification of 2 to 3 for mono carboxyl function to benefit bioconjugation.
Therefore, modifying the heterocyclic rings would produce smaller spectral shift, which falls within the desired range. Consequently, we focused on modifying the heterocyclic ring system as a general method to develop NIR fluorescent donor-acceptor dye pairs for this application. Structure-spectral properties analysis led us to prepare a new NIR fluorescent indolium heptamethine dye called cybate (1) as a low wavelength donor dye for the acceptor benzoindolium analogue, cypate, 2 (Figure 1). Chemically, 1 and 2 possess two carboxyl groups that could equally react with an amine. To minimize side reactions during peptide conjugation, one of the carboxyl groups of cypate was converted to the N,N-dimethyl amide derivative (Me2N-CpOH, 3). This modification allowed us to first conjugate 3, followed by 1 to the desired enzyme peptide substrate.
Design and synthesis of cleavable NIR caspase-3 enzyme substrates
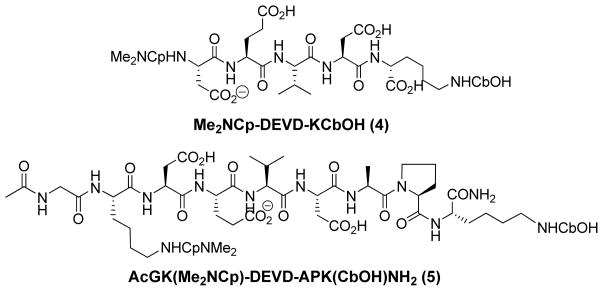
To demonstrate the feasibility of using 1 and 3 in the dual fluorescence quenching mechanism, we used the basic peptide sequence recognizable by caspase-3 (see below), Asp-Glu-Val-Asp (DEVD, representing the single letter amino acid code) for the study. Cleavage of the peptide substrate occurs at the C-terminal aspartic acid of the peptide. Consequently, we conjugated 1 and 3 at the N- and C-terminal of the peptide substrate, respectively, to quench fluorescence emission, which can be restored upon site-specific cleavage by caspase-3. Two NIR FRET systems, Me2NCp-DEVDK(CbOH)-OH (4) and Ac-GK(Me2NCyp)-DEVDAPK(CbOH)-NH2 (5) were designed to assess the effect of placing the dyes proximal or distal to caspase-3 recognition site of the tetrapeptide DEVD.
We previously reported the use of 2 for a variety of optical imaging studies.7,24 –27 Compound 1 was prepared by a similar method reported for 2.17 The synthesis of a representative caspase-3 activatable system 5 is summarized in Scheme 1. The peptide was assembled on solid support by standard solid phase peptide synthesis. To incorporate the two dyes to the same peptide, we included orthogonally protected lysine residues in the peptide sequence. We first removed the Dde protecting group with hydrazine to add 3 before deprotecting the second lysine (Mtt) residue with dilute TFA to conjugate cybate. Removal of the side-chain protecting groups and cleavage of the dual dye-labeled peptide from solid support was accomplished with a TFA cleavage mixture to afford the expected product. The compound was isolated by HPLC purification and characterized by NMR, LC-MS, and spectroscopic methods.
Scheme 1.
Synthesis of a representative NIR FRET compound
Spectral properties of NIR caspase-3 probe
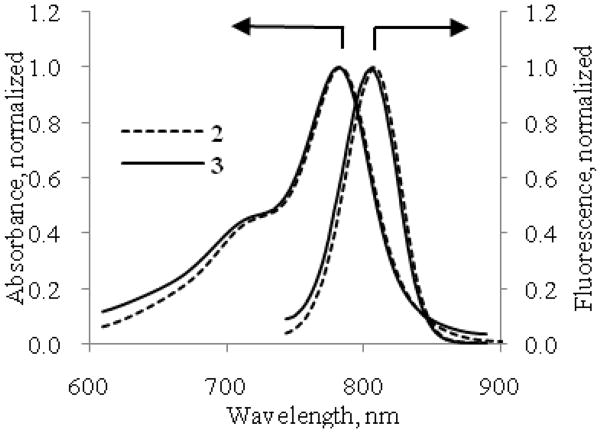
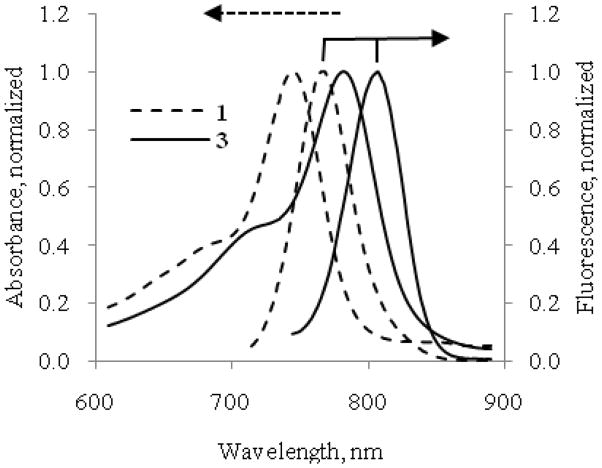
The absorption and fluorescence spectra of compounds 1–5 were evaluated in 20% DMSO in water. This solvent system solubilizes all the dyes and their peptide conjugates and it has been used previously for administering optical molecular probes in animals.18 At sub-μM concentration, the indolium dye 1 showed a maximum absorption at 748 nm, 35 nm less than that of the benzoindolium dye 2 (Table 1). Similarly, the maximum emission of 1 at 768 nm is 44 nm less than that of 2. Both dyes have high molar absorptivity (105 M−1 cm−1) comparable to indocyanine green (ICG) under similar conditions. The results of absorption and fluorescent studies are summarized in Table 1. Considering that modification of 2 to the monodimethyl amide 3 could alter its spectral properties, we compared the absorption and emission spectra of 2 and 3. Our results showed that the spectral characteristics for these compounds are similar (Figure 3 and Table 1). The emission band of the donor dye 1 significantly overlaps the absorption band of the acceptor dye 3 (Figure 4) and at the same time the absorption band of dye 1 still substantially overlaps with emission band of 3.
Table 1.
| Entry | λabs max, nm | λem max, nm | Lifetime ta, ns | Quantum yielda |
|---|---|---|---|---|
| 1 | 748 | 768 | 0.52 | 0.170 |
| 2 | 783 | 808 | 0.25 | 0.031 |
| 3 | 783 | 807 | 0.24 | 0.025 |
| 4 | 777 | none | n/d | 0.002 |
| 5 | 759, 790 | 763 | n/d | <0.001 |
relative to ICG in DMSO, QY=0.12
Figure 3.
Absorption and emission (excitation 720 nm) spectra of compounds 2 (dotted line) and 3 (straight line) in 20%DMSO/water. Spectra are normalized to their maximum intensities. Complete overlap of the spectra suggests identical optical properties of the compounds.
Figure 4.
Normalized absorption and emission spectra of compounds 1 (dotted line) and 3 (straight line) in 20% DMSO/water. (Excitation parameters: for 1 – 700 nm, for 3 – 720 nm) do show the overlap between the emission of 1 and absorption of 3 as well as the overlap between absorption of 1 and emission of 3.
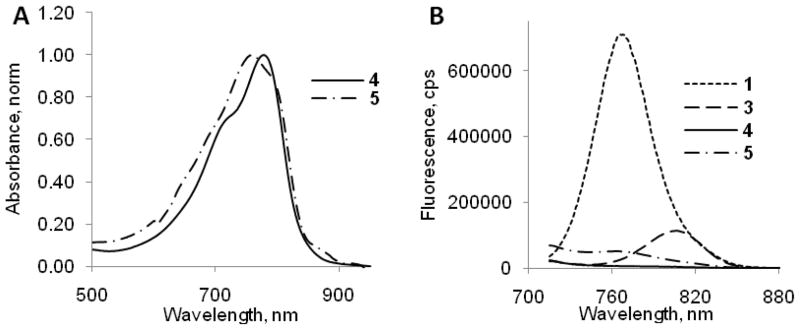
The spectra of a physical mixture of the two dyes 1 and 3 were largely the product of individual components (not shown), which is in a good agreement with additivity rule.28 In contrast to physical mixing, we found that covalent binding of the two dyes to the same molecule as in 4 and 5 resulted in a similar absorption profile but, as expected, almost complete suppression of the fluorescence signal above 700 nm as well as concomitant decrease in the calculated fluorescence quantum yield to virtually zero (Figure 5). We attributed the strong quenching of fluorescence to the effect of the non-radiative resonance energy transfer (FRET) and possibly π-π interaction between the two dyes. Specifically, most of the quenching was caused by Förster resonance energy transfer mechanism since spectral properties of participating dyes 1 and 3 and caspase-3 probes 4 and 5 demonstrated a number of features common to FRET systems. These include significant spectral overlap, decrease in fluorescence lifetime, and typical FRET distances between the dyes on the molecular constructs. Sandwich-type aggregation (H-aggregation) might also contribute to the quenching. This mechanism is facilitated by the hydrophobic nature of the dyes and π -π interaction between the fluorophores. We recently demonstrated this quenching mechanism with conjugating multiple cypate molecules to a nanoparticle29
Figure 5.
Normalized absorption (A) and fluorescence spectra (B) (excitation 700 nm) of representative compounds in 20% DMSO/water. Emission spectra were normalized to the same level of absorbance at 700 nm. Fluorescence spectra show that separately 1 and 3 are fluorescent; when coupled, significant quenching of emission of 4 and 5 occurs.
Analysis of the absorption and emission spectra of 1 and 3 (Figure 4) reveals that not only does the emission spectrum of the donor 1 significantly overlap with the absorption spectra of the acceptor 3 that is required for FRET to occur, but also part of the emission spectrum of the acceptor 3 overlaps with the absorption spectrum of the donor 1. The double overlap traps the resonance energy between the two fluorophores and results in significant quenching of the fluorescence emission of both dyes. Indeed, spectral overlap analysis showed two channels for the direct and reverse energy transfer: Förster distance for the direct FRET between dyes 1 and 3 in compound 5 was found to be 61.28 Å, whilereverse Förster distance for the same pair was determined to be 46.07 Å. Using molecular modeling, we determined that the maximum allowable distance between 1 and 3 in compound 5 was 42.5 Å, which corresponds to 90% energy transfer from 1 to 3 and 61% energy transfer in the reverse direction. The energy transfers were calculated for the most stretched conformation of 5 (the actual energy transfers) and therefore, quenching of the caspase-3 probe may be even higher than the calculated value because the average distance between two fluorophores is expected to be much shorter in solution.
Caspase-3 enzyme kinetics in vitro
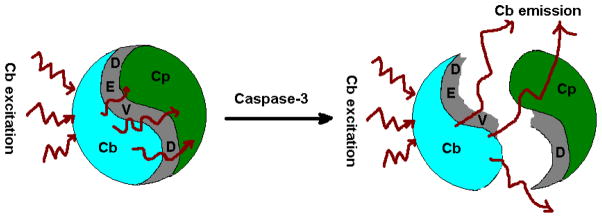
We used the caspase-3 enzyme substrates prepared to demonstrate the feasibility of using this new activatable probe to monitor enzyme activities because of the importance of this enzyme in programmed cell death known as apoptosis.13 Apoptosis is a normal physiological process that counters cell proliferation. The discovery of a link between apoptosis and cancer have led to the development of new cancer drugs that can induce cell death by a variety of activation mechanisms. 30–34 Recent advances in molecular biology have unraveled the roles of caspases, a family of cysteinyl aspartate-specific proteases in apoptosis. Thus, interest in imaging the expression of caspases has increased recently. Particularly, the role of caspase-3 in apoptosis induction13 makes it attractive as a biomarker of early treatment response. Unlike previous studies,35 the fluorescence of our new molecular system (Scheme 2) is doubly quenched by a new mechanism and the probe consists of dye pairs with both excitation and emission wavelengths >700 nm to minimize tissue autofluorescence, enhance detection sensitivity, and improve light penetration in tissue.36
Scheme 2.
Schematics illustrating the activation of fluorescence by caspase-3 cleavage and release of the NIR FRET compounds.
While compounds 4 and 5 were hydrolyzed by caspase-3, the cleavage rate of 4 was very slow, preventing a full kinetic characterization. Most likely, conjugation of the NIR dyes in close proximity to the cleavage site of 4 resulted in an apparent loss of a catalytic efficiency.
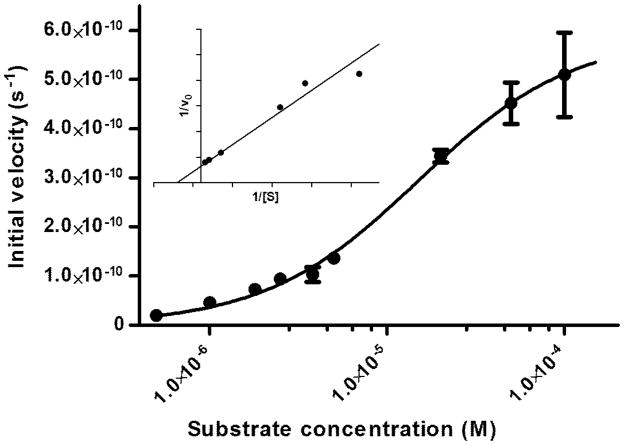
In contrast, 5 was readily cleaved by caspase-3. The substrate displayed classic Michaelis -Menten kinetics (Figure 6) with enzyme kinetic parameters kcat and KM of 1.02 ± 0.06 s−1 and 15 ± 3 μM, respectively. The observed KM for 5 compares favorably with standard substrates Ac-DEVD-AMC (KM = 9.7 μM) and Ac-DEVD-pNA (KM = 11 μM).37, 38 We also observed a similar catalytic turnover of caspase-3 by 5 (kcat = 1.02 ± 0.06 s−1) to those of the standard substrates Ac-DEVD-AMC (kcat = 0.75 s−1) and Ac-DEVD-pNA (kcat = 2.4 s−1).37, 38 Compound 5 was efficiently cleaved by caspase-3 (kcat/KM = 6.8 × 10⁴ M−1 s−1), which is comparable to those for the aforementioned acylated standard substrates. Therefore, the relatively bulky NIR dyes flanking the hydrolysis site do not significantly alter the catalytic efficiency of caspase-3. The computed kcat/KM values of a substrate are important criteria in the evaluation of quenched substrate for molecular imaging because it provides a benchmark in the evaluation of an enzyme substrate with quenched fluorophores for molecular imaging. Substrates with the highest kcat/KM values are expected to be the most rapidly hydrolyzed before wash-out from the target site, resulting in greater signal to noise ratio.
Figure 6.
Semi-log plot of the nonlinear fit of initial velocity with respect to substrate concentration and the corresponding Lineweaver-Burk plot (inset). Substrate 5 concentrations varied from 70 nM to 100 μM. From this fit, the kinetic parameters, kcat and KM, were found to be 1.02 ± 0.06 s−1 and 15 ± 3 μM, respectively.
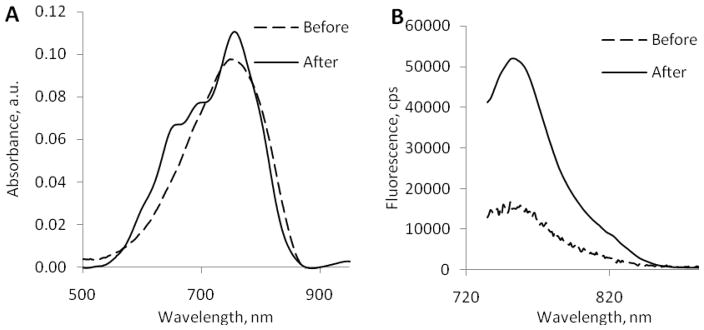
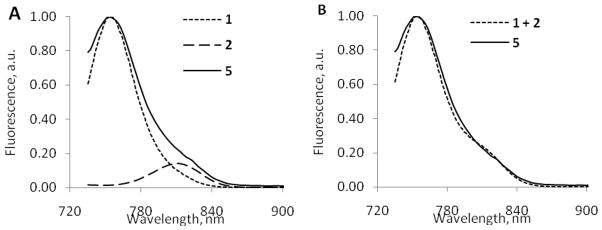
The absorption spectra after the cleavage became more structured compared to the un-cleaved substrate 5, revealing characteristic features of free (not conjugated to each other) dyes 1 and 3 (Figure 7). The emission spectra after the cleavage 5 was also structured and consisted of the large band centered at 760 nm and a small band at 810 nm. The deconvolution of the emission spectrum into two components is shown in Figure 8, A and the individual spectra clearly resemble the emission profiles of 1 and 2. (The validation of the deconvolution is given in Figure 8, B, where the arithmetical summation of absorption values of hypothetical mixture of cybate and cypate fits closely to the experimentally derived emission of hydrolyzed substrate 5). The differences in intensities between 760 nm and 810 nm in the emission of 5 after the cleavage (ratio F760/F810 = 7.16) were similar to the differences in the quantum yield of cybate and Me2N-cypate (the ratio φ1/φ3 =0.170/0.025=6.8, see Table 1) indicating the absence of any post hydrolysis quenching.
Figure 7.
Absorption (A) and emission (B) spectra of 5 before and after enzymatic cleavage. (excitation 700 nm). While absorption spectra were similar in intensity before and after the cleavage, the emission spectra of the cleaved 5 were much higher than for uncleaved compound (excitation 720 nm)
Figure 8.
A: Deconvoluted emission spectra of cleaved 5 into two individual components 1 and 2. B: comparison of the emission spectra of 5 to the arithmetical summation of absorption values of hypothetical mixture of cybate 1 and cypate 2 (excitation 720 nm)
Imaging of caspase-3 activation in cells
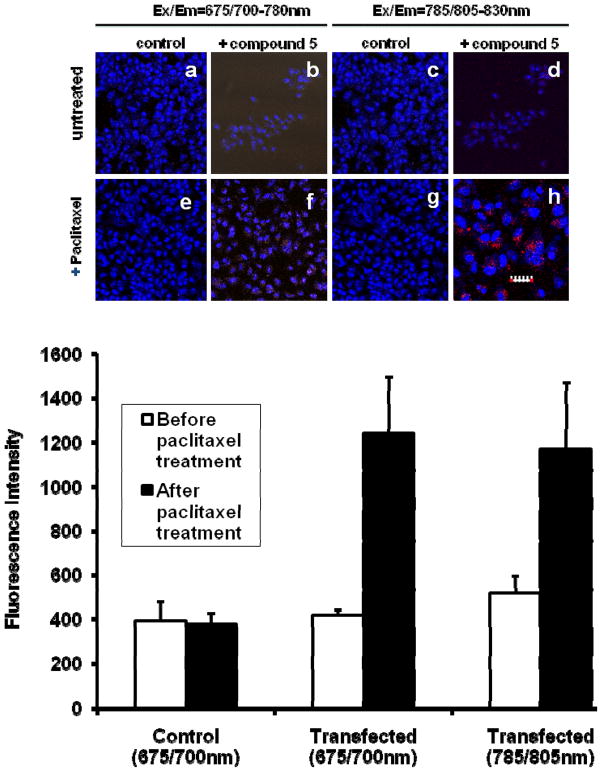
Although many FRET-mediated approaches to monitor caspase-3 activation in cells have been reported,39–44 we set out to explore the feasibility of using the newly developed NIR fluorescent compound 5 to image the activation of caspase-3 in response to drug treatment. A previous study has shown that paclitaxel effectively induced caspase-3 mediated apoptosis in the human lung carcinoma A549 cells after 24 h of treatment.45 Consequently, we first transiently transfected A549 cells with 5, which possesses enzyme kinetics parameters similar to standard substrates for caspase-3 (see above). Subsequent treatment of the A549 cells with 5 μM paclitaxel for 2 h was sufficient to activate caspase-3 in the cells. Before activation of caspase-3, the fluorescence of compound 5 (10 μM) transfected A549 cells was essentially quenched at both the 700 nm and 785 nm excitation channels. However, a significant increase in the fluorescence intensity was observed after paclitaxel treatment relative to the untreated controls (Figure 9, top panel). Quantitative analysis of the fluorescence intensity of treated compared to untreated A549 cells show about a 3-fold increase in fluorescence after activation of caspase-3 with paclitaxel (Figure 9, bottom panel). Optimization of the caspase-3 substrate may be needed to further enhance signal amplification in cells. This could be accomplished by the use of a hydrophilic donor or acceptor dye that could be removed rapidly from cells after cleavage to prevent concentration-dependent fluorescence quenching if both dyes remain in the same cellular compartment after cleavage. However, this result demonstrates the potential of monitoring apoptosis induction in caspase-3 positive cells by using our new NIR fluorescence quenching mechanism and caspase-3 probes.
Figure 9.
NIR confocal microscopy of A549 cells transfected with compound 5. Top panel: The confocal fluorescence image of 5 in the cytoplasm of A549 cells before (a–d) and after (e–h) 5μM paclitaxel activation of caspase-3 for 2h at 37°C. Nuclei and compound 5 were colored blue and red, respectively. The scale bar is 30 μm for a–g and 15μm for h (to amplify the visual distribution of the probe in cells). Bottom panel: Quantitative analysis of the fluorescent intensity in the cytoplasm of A549 cells transfected with compound 5 before and after caspase-3 activation with 5μM paclitaxel for 2 h at 37°C ( p< 0.05). Control was not transfected with compound 5 before treatment with paclitaxel.
Activation of Caspase-3 NIR fluorescent substrate in mice
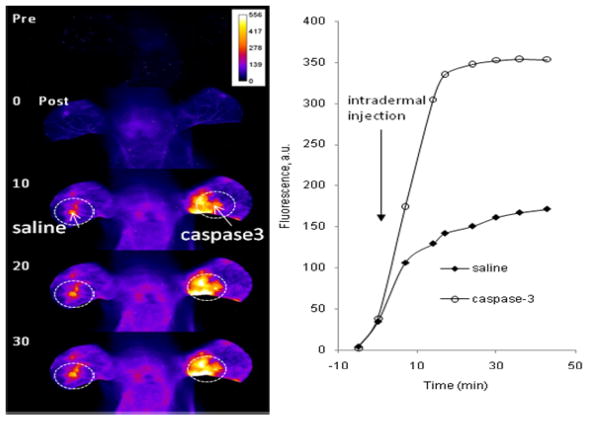
To assess the possibility of imaging activated caspase-3 in living organisms, we developed a simple mouse model of caspase-3 expression. Compound 5 was first administered by tail vein injection. Whole-body imaging exhibited significant fluorescence relative to tissue autofluorescence (not shown) immediately after the intravenous injection of 5. This fluorescence was probably due to nonspecific activation of 5. It could also be attributed to the disruption of aggregation upon binding of 5 to blood proteins. 46 Irrespective of the activation mechanism, we used the nonspecific fluorescence enhancement as background fluorescence for imaging purposes. After optimizing the imagin position, caspase-3 protein was injected intradermally into the central region of the left ear and an equal volume of saline was administered in the right ear to serve as control. The administration of saline showed visible bruising in the injection area but none was observed after the caspase-3 injection. After the injection of saline or caspase-3, higher fluorescence was observed in the caspase-3-injected ear (Figure 10). The site of saline injection also showed higher fluorescence intensity than surrounding ear tissue, likely due to proteolysis by enzymes released in response to tissue injury. The fluorescence intensity change observed proximal to the injection site probably resulted from the diffusion and lymphatic drainage of the enzyme shortly after injection. The fluorescence intensity increased with time in the ear injected with caspase-3 and reached a plateau within 20 minutes after injection. We attribute this plateau to enzyme saturation, inactivation, and/or diffusion of the probe from the tissue. While this model does not reflect natural caspase activity, it shows the feasibility of our probe for in vivo enzyme activity through fluorescence dequenching.
Figure 10.
Fluorescence intensity maps of mouse head and ears before (top image), immediately after (second image from top) intravenous administration of 5 and at time points after further external intradermal injection of either saline control or caspase-3 in opposite ears. Corresponding plot of fluorescence intensity over time for regions of interest drawn over the intradermal injection sites. The measured fluorescence intensity increased about more than double for the caspase-3 injection over the saline injection site and more than 3 times that of surrounding healthy tissue. Fluorescence was monitored at 805 nm at 785 nm excitation. For comparison, Caspase-3 was applied only on right ear and saline was injected in the left ear.
In vivo protease imaging is in its nascent stage but the feasibility of these studies in small animals has been reported. For example, MMP-2 activity in mouse models was visualized with a poly-lysine-PEG co-polymer of relatively high molecular weight (450 kDa), when conjugated to a peptide that is a substrate for MMP-2. This peptide itself was a substrate for MMP-2 (kcat = 4.1 sec−1 and KM = 290 μM, kcat/KM = 1.4 × 10⁴ M−1s−1).11, 12 Presumably, conjugation to the polymer did not change these kinetic parameters. In another study, a fluorescein-linear peptide bearing a MMP-7 hydrolysis site and tetramethylrhodamine (TMR) were conjugated to a polyamido-amino dendrimeric polymer (14 kDa).47 Fluorescein was the donor and TMR the acceptor. The dendrimeric peptide was efficiently (kcat/KM = 1.9 × 10⁵ M−1 s−1) and selectively (MMP-2 kcat/KM = 3.4 × 10³ M−1 s−1, MMP-3 kcat/KM = 1.5 × 10⁴ M−1 s−1) cleaved by the target, MMP-7. While the endogenous fluorescence was competing with fluorescein fluorescence, a subcutaneous tumor (MMP-7 positive) was visualized relative to a control (MMP-7 negative). An additional example of in vivo tumor imaging with a polymeric quenched-fluorescent probe relies on the activation by cathepsin D.14 The peptide substrate bearing the Cy5.5 quenched probes had a relatively high efficiency for cathepsin D mediated hydrolysis (kcat/KM= 7 × 10⁶ M−1 s−1). While the xenografted tumor expressed the target cathepsin D (zymography), the cathepsin D levels were not quantified. Together, these examples suggest that there is a range of kcat/KM values of ~1 × 10⁴ to 7 × 10⁶ M−1 s−1 for proteolytic substrates that successfully imaged in vivo proteolytic activity.11,12, 14 The value for compound 5 (kcat/KM = 6.8 × 10⁻⁴ M−1 s−1) is well within that range and supports the use of the new molecular probes for in cellulo and in vivo imaging studies.
Conclusions
We have developed new donor-acceptor NIR fluorescent dye systems with both excitation and emission wavelengths above 700 nm. Strong spectral overlaps between absorption and emission spectra of 1 and 3 were responsible for quenching not only of the emission from the donor but also the emission from the acceptor. Fluorescence quenching of dye 1 in the presence of 3 resulted from a direct FRET mechanism (at least 90% energy transfer) but quenching of 3 in the same molecular construct was attributed to a reverse FRET (at least 61 % energy transfer). The dual quenching strategies provided low background fluorescence for enzyme assays and biological imaging. Nonspecific fluorescence dequenching of the caspase-3 probes allowed us to image the distribution of the substrate in the body and the specific activation of fluorescence by caspase-3 was used to report the enzyme activity in cells and tissue. Using a peptide substrate recognized by caspase-3, we demonstrated the feasibility of imaging caspase-3 activation in cells and small animals. The approach described opens up the possibility of diverse structural modification and optimization of non-polymer based NIR fluorescence activatable probes for imaging a variety of molecular processes. In particular, the results demonstrate the use of the same molecular probe for monitoring the activities of enzymes across a broad range of spatial scales, spanning from in vitro kinetics measurements to in cellulo and in vivo localization of caspase-3 activation.
Figure 2.
Chemical structures of two NIR fluorescence-quenched molecular probes cleavable by Caspase-3. In both cases, two dyes are placed on either side of DEVD peptide sequence. Both dyes are distal to the DEVD peptide sequence in compound 5 relative to compound 4. The N-terminus of 5 was capped with acetylgylcine.
Acknowledgments
This research was supported in part by the National Institutes of Health grants R01 CA109754, R01 EB1430, R33 CA100972, and R24 CA83060. We are also thankful to Yuri Yershov for developing the FRET calculator.
References
- 1.Duffy MJ. Predictive markers in breast and other cancers: a review. Clin Chem. 2005;51:494–503. doi: 10.1373/clinchem.2004.046227. [DOI] [PubMed] [Google Scholar]
- 2.Reubi C, Gugger M, Waser B. Co-expressed peptide receptors in breast cancer as a molecular basis for in vivo multireceptor tumour targeting. Eur J Nucl Med Mol Imaging. 2002;29:855–62. doi: 10.1007/s00259-002-0794-5. [DOI] [PubMed] [Google Scholar]
- 3.Kelloff GJ, Krohn KA, Larson SM, Weissleder R, Mankoff DA, Hoffman JM, Link JM, Guyton KZ, Eckelman WC, Scher HI, O’Shaughnessy J, Cheson BD, Sigman CC, Tatum JL, Mills GQ, Sullivan DC, Woodcock J. The progress and promise of molecular imaging probes in oncologic drug development. Clin Cancer Res. 2005;11:7967–85. doi: 10.1158/1078-0432.CCR-05-1302. [DOI] [PubMed] [Google Scholar]
- 4.Reubi JC. Peptide receptors as molecular targets for cancer diagnosis and therapy. Endocr Rev. 2003;24:389–427. doi: 10.1210/er.2002-0007. [DOI] [PubMed] [Google Scholar]
- 5.Jaffer FA, Weissleder R. Molecular Imaging in the Clinical Arena. JAMA. 2005;293:855–862. doi: 10.1001/jama.293.7.855. [DOI] [PubMed] [Google Scholar]
- 6.Rudin M, Weissleder R. Molecular imaging in drug discovery and development. Nat Rev Drug Discov. 2003;2:123–131. doi: 10.1038/nrd1007. [DOI] [PubMed] [Google Scholar]
- 7.Achilefu S. Lighting up tumors with receptor-specific optical molecular probes. Technol Cancer Res Treat. 2004;3:393–409. doi: 10.1177/153303460400300410. [DOI] [PubMed] [Google Scholar]
- 8.Sokolov K, Aaron J, Hsu B, Nida D, Gillenwater A, Follen M, MacAulay C, Adler-Storthz K, Korgel B, Descour M, Pasqualini R, Arap W, Lam W, Richards-Kortum R. Optical systems for in vivo molecular imaging of cancer. Technol Cancer Res Treat. 2003;2:491–504. doi: 10.1177/153303460300200602. [DOI] [PubMed] [Google Scholar]
- 9.Tung CH. Fluorescent peptide probes for in vivo diagnostic imaging. Biopolymers. 2004;76:391–403. doi: 10.1002/bip.20139. [DOI] [PubMed] [Google Scholar]
- 10.Graves EE, Ripoll J, Weissleder R, Ntziachristos V. A submillimeter resolution fluorescence molecular imaging system for small animal imaging. Med Phys. 2003;30:901–11. doi: 10.1118/1.1568977. [DOI] [PubMed] [Google Scholar]
- 11.Mahmood U, Weissleder R. Near-infrared optical imaging of proteases in cancer. Mol Cancer Ther. 2003;2:489–496. [PubMed] [Google Scholar]
- 12.Bremer C, Tung CH, Weissleder R. In vivo molecular target assessment of matrix metalloproteinase inhibition. Nat Med. 2001;7:743–8. doi: 10.1038/89126. [DOI] [PubMed] [Google Scholar]
- 13.Bullok KE, Maxwell D, Kesarwala AH, Gammon S, Prior JL, Snow M, Stanley S, Piwnica-Worms D. Biochemical and in vivo characterization of a small, membrane-permeant, caspase-activatable far-red fluorescent peptide for imaging apoptosis. Biochemistry. 2007;46:4055–65. doi: 10.1021/bi061959n. [DOI] [PubMed] [Google Scholar]
- 14.Tung CH, Mahmood U, Bredow S, Weissleder R. In vivo imaging of proteolytic enzyme activity using a novel molecular reporter. Cancer Res. 2000;60:4953–8. [PubMed] [Google Scholar]
- 15.Pham W, Choi Y, Weissleder R, Tung CH. Developing a peptide-based near-infrared molecular probe for protease sensing. Bioconjug Chem. 2004;15:1403–7. doi: 10.1021/bc049924s. [DOI] [PubMed] [Google Scholar]
- 16.Bouteiller C, Clave G, Bernardin A, Chipon B, Massonneau M, Renard PY, Romieu A. Novel water-soluble near-infrared cyanine dyes: synthesis, spectral properties, and use in the preparation of internally quenched fluorescent probes. Bioconjug Chem. 2007;18:1303–17. doi: 10.1021/bc0700281. [DOI] [PubMed] [Google Scholar]
- 17.Ye Y, Li WP, Anderson CJ, Kao J, Nikiforovich GV, Achilefu S. Synthesis and characterization of a macrocyclic near-infrared optical scaffold. J Am Chem Soc. 2003;125:7766–7. doi: 10.1021/ja034186o. [DOI] [PubMed] [Google Scholar]
- 18.Achilefu S, Dorshow RB, Bugaj JE, Rajagopalan R. Novel receptor-targeted fluorescent contrast agents for in vivo tumor imaging. Invest Radiol. 2000;35:479–85. doi: 10.1097/00004424-200008000-00004. [DOI] [PubMed] [Google Scholar]
- 19.Achilefu S, Jimenez HN, Dorshow RB, Bugaj JE, Webb EG, Wilhelm RR, Rajagopalan R, Johler J, Erion JL. Synthesis, in vitro receptor binding, and in vivo evaluation of fluorescein and carbocyanine peptide-based optical contrast agents. J Med Chem. 2002;45:2003–15. doi: 10.1021/jm010519l. [DOI] [PubMed] [Google Scholar]
- 20.Goto H, Osawa E. An Efficient Algorithm for Searching Low-Energy Conformers of Cyclic and Acyclic Molecules. Journal of the Chemical Society-Perkin Transactions. 1993;2:187–198. [Google Scholar]
- 21.Lakowicz JR. Principles of Fluorescence Spectroscopy. 2006. [Google Scholar]
- 22.Motulsky H, Christopoulos A. Fitting models to biological data using linear and nonlinear regression: a practical guide to curve fitting. Oxford University Press; Oxford; New York: 2004. p. 351. [Google Scholar]
- 23.Sevick-Muraca EM, Sharma R, Rasmussen JC, Marshall MV, Wendt JA, Pham HQ, Bonefas E, Houston JP, Sampath L, Adams KE, Blanchard DK, Fisher RE, Chiang SB, Elledge R, Mawad ME. Imaging of lymph flow in breast cancer patients after microdose administration of a near-infrared fluorophore: feasibility study. Radiology. 2008;246:734–41. doi: 10.1148/radiol.2463070962. [DOI] [PMC free article] [PubMed] [Google Scholar]
- 24.Achilefu S, Bloch S, Markiewicz MA, Zhong T, Ye Y, Dorshow RB, Chance B, Liang K. Synergistic effects of light-emitting probes and peptides for targeting and monitoring integrin expression. Proc Natl Acad Sci U S A. 2005;102:7976–81. doi: 10.1073/pnas.0503500102. [DOI] [PMC free article] [PubMed] [Google Scholar]
- 25.Bloch S, Lesage F, McIntosh L, Gandjbakhche A, Liang K, Achilefu S. Whole-body fluorescence lifetime imaging of a tumor-targeted near-infrared molecular probe in mice. J Biomed Opt. 2005;10:054003. doi: 10.1117/1.2070148. [DOI] [PubMed] [Google Scholar]
- 26.Ye Y, Bloch S, Achilefu S. Polyvalent carbocyanine molecular beacons for molecular recognitions. J Am Chem Soc. 2004;126:7740–1. doi: 10.1021/ja049441z. [DOI] [PubMed] [Google Scholar]
- 27.Zhang Z, Liang K, Bloch S, Berezin M, Achilefu S. Monomolecular multimodal fluorescence-radioisotope imaging agents. Bioconjug Chem. 2005;16:1232–9. doi: 10.1021/bc050136s. [DOI] [PubMed] [Google Scholar]
- 28.Smith B. Quantitative Spectroscopy: Theory and Practice. Academic Press; 2002. p. 200. [Google Scholar]
- 29.Almutairi A, Akers WJ, Berezin MY, Achilefu S, Frechet JM. Monitoring the Biodegradation of Dendritic Near-Infrared Nanoprobes by in Vivo Fluorescence Imaging. Mol Pharm. 2008 doi: 10.1021/mp8000952. [DOI] [PMC free article] [PubMed] [Google Scholar]
- 30.Buolamwini JK. Novel anticancer drug discovery. Curr Opin Chem Biol. 1999;3:500–9. doi: 10.1016/S1367-5931(99)80073-8. [DOI] [PubMed] [Google Scholar]
- 31.Chiou SK, Jones MK, Tarnawski AS. Survivin - an anti-apoptosis protein: its biological roles and implications for cancer and beyond. Med Sci Monit. 2003;9:PI25–9. [PubMed] [Google Scholar]
- 32.Monks NR, Biswas DK, Pardee AB. Blocking anti-apoptosis as a strategy for cancer chemotherapy: NF-kappaB as a target. J Cell Biochem. 2004;92:646–50. doi: 10.1002/jcb.20080. [DOI] [PubMed] [Google Scholar]
- 33.Roccaro AM, Hideshima T, Richardson PG, Russo D, Ribatti D, Vacca A, Dammacco F, Anderson KC. Bortezomib as an antitumor agent. Curr Pharm Biotechnol. 2006;7:441–8. doi: 10.2174/138920106779116865. [DOI] [PubMed] [Google Scholar]
- 34.Zangemeister-Wittke U, Stahel RA. Novel approachesto the treatment of small-cell lung cancer. Cell Mol Life Sci. 1999;55:1585–98. doi: 10.1007/s000180050398. [DOI] [PMC free article] [PubMed] [Google Scholar]
- 35.Messerli SM, Prabhakar S, Tang Y, Shah K, Cortes ML, Murthy V, Weissleder R, Breakefield XO, Tung CH. A novel method for imaging apoptosis using a caspase-1 near-infrared fluorescent probe. Neoplasia. 2004;6:95–105. doi: 10.1593/neo.03214. [DOI] [PMC free article] [PubMed] [Google Scholar]
- 36.Adams KE, Ke S, Kwon S, Liang F, Fan Z, Lu Y, Hirschi K, Mawad ME, Barry MA, Sevick-Muraca EM. Comparison of visible and near-infrared wavelength-excitable fluorescent dyes for molecular imaging of cancer. J Biomed Opt. 2007;12:024017. doi: 10.1117/1.2717137. [DOI] [PubMed] [Google Scholar]
- 37.Moretti A, Weig HJ, Ott T, Seyfarth M, Holthoff HP, Grewe D, Gillitzer A, Bott-Flugel L, Schomig A, Ungerer M, Laugwitz KL. Essential myosin light chain as a target for caspase-3 in failing myocardium. Proc Natl Acad Sci U S A. 2002;99:11860–5. doi: 10.1073/pnas.182373099. [DOI] [PMC free article] [PubMed] [Google Scholar]
- 38.Talanian RV, Quinlan C, Trautz S, Hackett MC, Mankovich JA, Banach D, Ghayur T, Brady KD, Wong WW. Substrate specificities of caspase family proteases. J Biol Chem. 1997;272:9677–82. doi: 10.1074/jbc.272.15.9677. [DOI] [PubMed] [Google Scholar]
- 39.Rehm M, Dussmann H, Janicke RU, Tavare JM, Kogel D, Prehn JH. Single-cell fluorescence resonance energy transfer analysis demonstrates that caspase activation during apoptosis is a rapid process. Role of caspase-3. J Biol Chem. 2002;277:24506–14. doi: 10.1074/jbc.M110789200. [DOI] [PubMed] [Google Scholar]
- 40.Tyas L, Brophy VA, Pope A, Rivett AJ, Tavare JM. Rapid caspase-3 activation during apoptosis revealed using fluorescence-resonance energy transfer. EMBO Rep. 2000;1:266–70. doi: 10.1093/embo-reports/kvd050. [DOI] [PMC free article] [PubMed] [Google Scholar]
- 41.Harpur AG, Wouters FS, Bastiaens PI. Imaging FRET between spectrally similar GFP molecules in single cells. Nat Biotechnol. 2001;19:167–9. doi: 10.1038/84443. [DOI] [PubMed] [Google Scholar]
- 42.O’Brien MA, Daily WJ, Hesselberth PE, Moravec RA, Scurria MA, Klaubert DH, Bulleit RF, Wood KV. Homogeneous, bioluminescent protease assays: caspase-3 as a model. J Biomol Screen. 2005;10:137–48. doi: 10.1177/1087057104271865. [DOI] [PubMed] [Google Scholar]
- 43.Zhang HZ, Kasibhatla S, Guastella J, Tseng B, Drewe J, Cai SX. N-Ac-DEVD-N′-(Polyfluorobenzoyl)-R110: novel cell-permeable fluorogenic caspase substrates for the detection of caspase activity and apoptosis. Bioconjug Chem. 2003;14:458–63. doi: 10.1021/bc0256188. [DOI] [PubMed] [Google Scholar]
- 44.Zhuang X, Kim H, Pereira MJ, Babcock HP, Walter NG, Chu S. Correlating structural dynamics and function in single ribozyme molecules. Science. 2002;296:1473–6. doi: 10.1126/science.1069013. [DOI] [PubMed] [Google Scholar]
- 45.Das GC, Holiday D, Gallardo R, Haas C. Taxol-induced cell cycle arrest and apoptosis: dose-response relationship in lung cancer cells of different wild-type p53 status and under isogenic condition. Cancer Lett. 2001;165:147–53. doi: 10.1016/s0304-3835(01)00404-9. [DOI] [PubMed] [Google Scholar]
- 46.Berezin MY, Lee H, Akers W, Nikiforovich G, Achilefu S. Ratiometric analysis of fluorescence lifetime for probing binding sites in albumin with near-infrared fluorescent molecular probes. Photochem Photobiol. 2007;83:1371–8. doi: 10.1111/j.1751-1097.2007.00173.x. [DOI] [PubMed] [Google Scholar]
- 47.McIntyre JO, Fingleton B, Wells KS, Piston DW, Lynch CC, Gautam S, Matrisian LM. Development of a novel fluorogenic proteolytic beacon for in vivo detection and imaging of tumour-associated matrix metalloproteinase-7 activity. Biochem J. 2004;377:617–28. doi: 10.1042/BJ20030582. [DOI] [PMC free article] [PubMed] [Google Scholar]


