

Abstract
Morphogen gradients, which provide positional information to cells in a developing tissue, could in principle adopt any nonuniform profile. To our knowledge, how the profile of a morphogen gradient affects positional precision has not been well studied experimentally. Here, we compare the positional precision provided by the Drosophila morphogenetic protein Bicoid (Bcd) in wild-type (wt) embryos with embryos lacking an interacting cofactor. The Bcd gradient in the latter case exhibits decreased positional precision around mid-embryo compared with its wt counterpart. The domain boundary of Hunchback (Hb), a target activated by Bcd, becomes more variable in mutant embryos. By considering embryo-to-embryo, internal, and measurement fluctuations, we dissect mathematically the relevant sources of fluctuations that contribute to the error in positional information. Using this approach, we show that the defect in Hb boundary positioning in mutant embryos is directly reflective of an altered Bcd gradient profile with increasing flatness toward mid-embryo. Furthermore, we find that noise in the Bcd input signal is dominated by internal fluctuations but, due to time and spatial averaging, the spatial precision of the Hb boundary is primarily affected by embryo-to-embryo variations. Our results demonstrate that the positional information provided by the wt Bcd gradient profile is highly precise and necessary for patterning precision.
Introduction
Morphogens are molecules that form concentration gradients to provide positional information to cells, thereby instructing them to adopt distinct developmental fates (1–4). Although many molecules have been suggested to possess properties expected of morphogens, only a few have been quantitatively characterized with experimentally observed data (5–9). All of these characterized gradients follow an exponentially decaying function of distance x, where the morphogen density obeys B = B0e–x/λ, but with distinct decay lengths λ and amplitudes B0. In principle, morphogen gradients could assume any nonuniform profile and, in fact, it has been suggested (10–13) that certain profiles of morphogen gradients may have properties that are advantageous for specific tasks, such as buffering embryo-to-embryo variations (11,12) or size scaling (10). Understanding how morphogen gradients work and how precisely they provide positional information is an important biological and theoretical problem that has attracted considerable interest (14,15). In this report, we describe experimental and theoretical studies to analyze how the profile of a morphogen gradient affects its ability to confer precise positional information during development.
Bicoid (Bcd) is a Drosophila morphogenetic protein that instructs patterning of the anterior structures by activating specific target genes in the embryo (16–18). One such target is Hunchback (Hb), which is responsible for thoracic formation and is expressed in approximately the anterior half of the embryo. In wild-type (wt) embryos, the Bcd gradient fits an exponential function along the anterior-posterior (A-P) axis. In this article, we report a variant form of the Bcd gradient in mutant (nejire; nej) embryos lacking an interacting cofactor. We show, experimentally, that this new gradient provides less precise positional information—a defect that becomes more pronounced toward mid-embryo.
We develop a theoretical model to calculate the precision of domain boundaries for targets activated by Bcd, where, for the first time, to our knowledge, we dissect the fluctuations into all the relevant components, both external and internal. The results of our model calculations for the precision of these domain boundaries are in broad agreement with experimental values. Importantly, we find that both time and spatial averaging are essential in reducing the effect of internal fluctuations on the precision of Bcd target domain boundaries. Although internal fluctuations are the dominant source of noise in the Bcd input signal, due to time and spatial averaging, embryo-to-embryo variations become the main limiting factor on the precision of the Hb boundary readout.
The positional information provided by a gradient clearly depends on the density fluctuations and slope. Nevertheless, it is not obvious that the target boundary precision also depends sensitively on these parameters, inasmuch as the precision of target responses could, in principle, be achieved predominantly through other means, such as downstream cross-regulation. However, our results for the precision of the Hb boundary, along with an analysis of the precision of another Bcd target, Orthodenticle (Otd), support the hypothesis that the defect in Hb boundary positioning in nej embryos directly results from an increasing flatness in the Bcd gradient profile toward mid-embryo when compared with its wt counterpart. This represents a further experimental demonstration, in addition to staufen (6), of increased target boundary variations directly caused by altered Bcd gradient properties. Our results, particularly the reduced positional precision in nej embryos with a perturbed Bcd profile, provide evidence that highly precise positional information is supplied by the wt Bcd gradient to its downstream targets, as proposed by Gregor et al. (5).
Results
Experimental quantification of the wt Bcd profile
To experimentally probe the precision of the Bcd-Hb system, we stained wt and mutant (see below) embryos with antibodies against Bcd and measured raw fluorescent intensities along the A-P axis at early nuclear cycle 14. To further increase the accuracy of our measurements and facilitate our theoretical studies, we split these embryos into early and late subgroups, and analyzed their respective data separately (see Materials and Methods in the Supporting Material). Fig. 1, A and B, shows plots of the mean values of the Bcd fluorescent intensities (with the average background subtracted (6)) as a function of fractional embryo length x/L for the wt early and late subgroups, respectively. In the region of 0.19 < x/L < 0.49, the two fluorescent intensity profiles are very well fitted by exponentials of the form B = B1 exp(–[x/L – 0.19]/Λ) (7), where Λ = λ/L, with B1 = B(x/L = 0.19) = 20.0 ± 0.2, Λ = 0.180 ± 0.002 (early), and B1 = 15.1 ± 0.2, Λ = 0.182 ± 0.002 (late), as shown in Fig. 1, A and B (see the Supporting Material for further detail). In our analysis, we avoid fitting close to the anterior end (where the profiles deviate from an exponential) and past mid-embryo (where the densities become too low for reliable fitting). Consistent with live-imaging results (19), the fluorescent intensities in the late subgroup are systematically lower than in the early subgroup.
Figure 1.

Distinct Bcd gradient profiles in wt and nej embryos. (A) Experimentally measured Bcd fluorescent intensities B in the early subgroup of wt (red circles) and nej (blue squares) embryos as a function of fractional embryo length x/L. Intensity values (in arbitrary units) are background-subtracted without any further adjustments. Error bars show the standard deviation of the measured Bcd intensity distribution. Solid lines correspond to theoretical fits of the experimental data for 0.19 ≤ x/L ≤ 0.49 (see text and the Supporting Material for details). (Inset) Same plot but with panel B on a logarithmic scale. Data from 18 wt and 22 nej embryos. (B) Same as panel A, except for the late subgroup. Data from 10 wt and 18 nej embryos. (Inset) Same as for panel A.
Dissecting sources of fluctuations that contribute to wt Bcd gradient variations
Fig. 2, A and B, shows the standard deviation of the (background-subtracted) Bcd intensities δB as a function of relative A-P position x/L for the wt early and late subgroups, respectively. To calculate these intensity fluctuations, we developed a theoretical approach by considering the following potential sources of error: external embryo-to-embryo fluctuations in B1 and Λ, internal fluctuations due to the low copy number of Bcd molecules in the measuring volume, and fluctuations due to our experimental measurement process. Note that we do not attempt to subdivide the embryo-to-embryo fluctuations, into, for example, variations in the Bcd translation, degradation, or diffusion rates. At present the mechanism by which the Bcd gradient is established is not sufficiently well understood (to our knowledge) to permit this dissection (5,20–23); instead we simply treat the profile as a given, with the above types of fluctuations.
Figure 2.
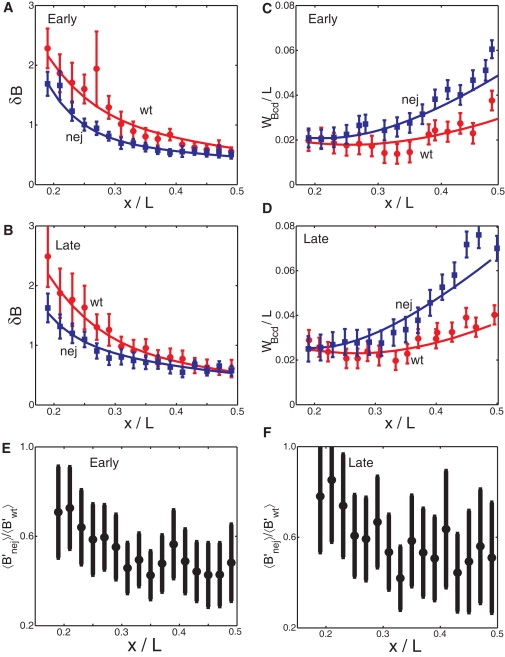
Increased positional errors of the Bcd gradient in nej embryos. (A) δB, standard deviation of measured Bcd fluorescent intensities in the early subgroup of wt (red circles) and nej (blue squares) embryos (note that the mean values of δB are equal to the size of the error bars shown in Fig. 1. Error bars are from bootstrapping (44)). Solid lines are corresponding fits from our theory, outlined in the text. (B) Same as panel A, except for the late subgroup. (C) Measured positional error WBcd/L (for the standard deviation of measured threshold positions, see text) for Bcd gradients in the early subgroup of wt (red circles) or nej (blue squares) embryos as a function of x/L. Error bars are from bootstrapping. Solid lines are corresponding theoretical fits. (D) Same as panel C, except for the late subgroup. (E) Ratio of slopes of the early Bcd profiles for nej and wt as function of position in the embryo. (F) As in panel E, but for late data sets.
Embryo-to-embryo variations
In our fitting to the experimental data, we find that B1 and Λ are not independent variables. This dependency is supported by experiment (see Manu et al. (24), and Fig. S1 B in our Supporting Material). From a theoretical perspective, this dependency is not unexpected: in a model where Bcd is produced at the anterior at rate J, diffuses with diffusion constant D, and is globally degraded at a rate μ, we have leading to B1 = Jλ/D. We emphasize that we are not endorsing such a model; we simply wish to point out that a dependency of B1 on λ is not unexpected. We assume that the variables are separable, thus B1 = B1indf(Λ), where B1ind is the contribution to the measured intensity at x/L = 0.19, which is independent of Λ. The relative intensity fluctuations due to external fluctuations in B1 and Λ are (to leading order)
| (1) |
where describes the B1 – Λ correlation (and is an additional fitting parameter within our analysis) and y = x/L – 0.19.
Internal fluctuations
The observed intensity profiles also contain fluctuations due to internal stochastic processes, δBint. Assuming first of all that the particle number fluctuations are described by Poisson statistics (13,25,26), then
The constant V encapsulates two contributions: the measuring volume used in the experiments and a conversion factor from Bcd number density to Bcd intensity. Furthermore, if we relax the Poisson assumption, and assume that the particle number variance is only proportional to (and not equal to) the particle number, then V also absorbs the constant of proportionality. The value of V is kept constant between early and late times and, furthermore, is also constant between wt and nej embryos. Substituting B = B1 exp(–y/Λ), we have (25)
Such stochastic processes contribute an independent source of error to the observed variance in intensity. Because the experiments took snapshots of the Bcd intensity distribution, there is no time (or spatial) averaging.
Measurement fluctuations
There are fluctuations in the observed intensities due to errors in the measurement process. Because we subtract the average background level from the raw intensities, there is error due to fluctuations in the background measurement. In addition, imaging and processing noise in the experiments result in additional fluctuations. These sources of error are discussed in detail elsewhere (6,26). We include these three sources of error (background, imaging, processing) within a measurement noise term, δBmeas, whose size (which we measure) is small in the region x/L < 0.5 (see Fig. S1 A). For our analysis, we use δBmeas/B = a + by, where a = 0.013 ± 0.006 and b = 0.058 ± 0.008 are fitted parameters from Fig. S1 A. We note that this form for δBmeas/B is found from considering all the above three contributions to the experimental error in the region x1 < x < x2, rather than just the correction due to background fluctuations (in which case, we would expect δBmeas/B ∝ B−1).
However, there are still measurement fluctuations unaccounted for in δBmeas, including, for example, fluctuations due to embryos having different permeability and consequently different observed intensities. Such fluctuations, in our analysis, are contained with . Hence, should not be viewed as solely due to external embryo-to-embryo fluctuations in the Bcd density. But we expect such additional sources of error to be small under our current experimental conditions (6), where Bcd intensity variation between neighboring nuclei in a single embryo (which is not affected by embryo-to-embryo variation in permeability) is comparable to embryo-to-embryo Bcd intensity variation (which does include such an additional source of noise).
Combining the sources of noise
Having taken into account the correlations between B1 and Λ (with an additional parameter α1), we have four independent contributions to the observed fluctuations. Hence, summing the variances of the independent contributions,
the relative Bcd intensity fluctuations for the wt embryos are
| (2) |
Here, (δB/B)wt is a function of position and is used to fit the experimentally observed δB fluctuations and the corresponding positional error using Eq. 3 (see below). The terms , α1, δΛ/Λ, and V are the four fitting parameters, where the same values are used to fit both the observed intensity fluctuations and relative positional errors. As shown in Fig. 2, A and B, when we compare our theoretical analysis to our experimental observations, we find an excellent quantitative fit of δB to the data for both early and late subgroups. We emphasize that, due to the specific functional forms of the different terms in Eq. 2, each fitting parameter in Eq. 2 is necessary for fitting the experimental data and therefore we are not overfitting the data. We discuss this parameter fitting procedure in detail in the Supporting Material together with a presentation of the parameter values. We note that our parameter values are consistent with previous experiments, particularly an observed ∼10% fluctuation in the Bcd gradient (19) and correlations between Λ and B1 (24).
We find that internal noise constitutes 68% (early) and 61% (late) of the overall variance (δB)2 near mid-embryo (x/L = 0.43). At this position, external fluctuations make up 28% (early), 36% (late), and measurement noise 4% (early), 3% (late). The importance of internal fluctuations is perhaps unexpected, because we are considering a relatively large measuring volume, of ∼200 μm3 (see the Materials and Methods in the Supporting Material) with a relatively high copy number of Bcd molecules. However, the overall high precision of the positional information encoded by the Bcd gradient, together with the absence of time/spatial averaging in the acquisition of the Bcd staining data, heightens the importance of the internal noise.
Positional precision of the Bcd gradient
We now examine the precision of positional information encoded in the Bcd gradient. Experimentally, this was performed as follows. For each subgroup, we used the mean Bcd gradient averaged over all the individual embryos to find the mean position where the profile passed through a particular concentration threshold. We then examined where each individual gradient from a single embryo passed through the same threshold to build up the relative error in positional information as a function of position. With this scheme, we did not have to make assumptions about the gradient profile when analyzing our experimental data. The results are shown for the wt early and late subgroups in Fig. 2, C and D, respectively. Theoretically, it is straightforward to convert the variations in fluorescent intensities δB (fitted above) into a positional error WBcd, using the formula
| (3) |
where B′(x) is the derivative of B with respect to absolute position x, δB denotes the standard deviation in the intensity at x, and 〈…〉 denotes ensemble averaging (henceforth omitted for clarity). As can be seen from Fig. 2, C and D, the agreement between WBcd/L and the above experimentally determined values of the relative positional error is good, with WBcd/L increasing gradually toward mid-embryo. This analysis demonstrates that, as expected, the above formula for converting from the intensity fluctuations δB to the positional error WBcd agrees well with our experimental data. Finally, we have repeated all of the above analysis using absolute scales, such as λ, rather than scaled parameters such as Λ. In the Supporting Material, we demonstrate that such an approach does not significantly alter our results.
An altered profile for the Bcd gradient in nej embryos
Experimental quantification of the Bcd gradient in nej embryos
Drosophila CREB-binding protein (dCBP), encoded by nejire (nej), is a transcription cofactor that interacts with other DNA-binding transcription factors including Bcd (27–31). To investigate the role of dCBP during development, we analyzed the Bcd gradient in embryos from females with nej1 germline clones (referred to as nej embryos). To ensure a direct comparison, nej embryos were stained side-by-side with wt embryos and high-resolution digital images captured in the same imaging cycle as wt embryos. As in wt embryos, we extracted raw Bcd intensities from these images and plotted the mean profiles (with the average background subtracted) as a function of x/L for the early and late subgroups (Fig. 1, A and B). Between 0.19 < x/L < 0.49, both profiles were well fitted by an algebraically decaying profile of the form (where y0 = x0/L + 0.19)
| (4) |
with a best fit value of n = 2.7 ± 1.2 (see the Supporting Material), and with an = 0.90 ± 0.03, x0/L = 0.201 ± 0.006 (early), and an = 0.78 ± 0.02, x0/L = 0.208 ± 0.006 (late). We note that other functional forms (e.g., an exponential plus a constant or the sum of two exponentials) can also give good fits. Therefore, we do not imply that the underlying gradient is truly algebraic, but merely show that the Bcd profile in nej embryos is altered from the wt exponential and that an algebraic profile is an excellent fit to our data. Examining fluctuations in the constituent parts of the algebraic profile is straightforward, so below we will use this algebraic fit to dissect the noise in the Bcd gradient from nej embryos. Important to note: using alternative fits to analyze the nej profiles does not alter our conclusions. For example, we have confirmed that using B = B2e–x/λ + b does not alter our results, in particular the relative importance of internal and external fluctuations (data not shown).
Fluctuations in the Bcd profile in nej embryos
The standard deviations of the measured (background-subtracted) Bcd intensities δB as a function of x/L for the early and late subgroups of nej embryos are shown in Fig. 2, A and B. To calculate the Bcd gradient variations in these embryos, we extended our theoretical studies using external embryo-to-embryo fluctuations in an and x0/L, internal fluctuations due to the finite Bcd copy number, and noise in the experimental measurement process. Our analysis revealed that an and x0 were not independent variables, but rather an = anindg(x0/L), similar to the dependency between B1 and λ/L in the wt case (see also Fig. S2 C). For conciseness, calculation details of the intensity variance in the nej embryos are given in the Supporting Material but the approach taken is similar to the wt case discussed above. The relative intensity fluctuations δB/B in nej embryos are given by (recall y = x/L – 0.19 and y0 = x0/L + 0.19)
| (5) |
where c = 0.16 ± 0.05 is a constant related to the measurement noise and α2 (representing the an – x0/L correlation), δy0/y0, δaindn/anind, and V are fitting parameters. Again, as in Eq. 2, the intensity variance is a function of position. Fig. 2, A and B, shows the fitting of Eq. 5 to the experimental data. In the Supporting Material, we discuss the measurement noise and outline our procedure for fitting the observed fluctuations in the nej data along with the parameter values; similar to the wt data fitting, we take care to ensure that we are not overfitting the data.
Internal noise is again very important for fitting the Bcd staining data in nej embryos, making up 76% (early), 52% (late) of the overall variance (δB)2 at x/L = 0.43, as compared to 19% (early), 45% (late) for external fluctuations, and 5% (early), 3% (late) for measurement noise. To analyze the positional precision of the Bcd profiles in nej embryos, we determined relative positional error both experimentally, using the same method as for wt embryos (Fig. 2, C and D) and theoretically, using Eq. 3 and Eq. 5. Our analysis reveals that the positional error WBcd/L in nej embryos becomes considerably higher near mid-embryo than in the wt embryos, even though their respective values are comparable near the anterior (Fig. 2, C and D). At x/L = 0.43, wt and nej embryos (compared separately for early and late subgroups) have similar standard deviations of Bcd intensities δB. However, the local mean Bcd intensity slopes in wt and nej embryos are different around this position by a factor of ∼2 (see Fig. 2, E and F). Our analysis, therefore, traces back the origin of the increased positional error to the decreased slope of the Bcd gradient in nej embryos. These results support the hypothesis that in nej embryos it is the new profile's increasing flatness that dictates the increased positional errors around mid-embryo.
Increased Hb variations in nej embryos
To evaluate the biological consequences of a gradient with increased positional errors, we conducted experiments to directly measure Hb intensities in wt and nej embryos (Fig. 3, A and B). In our experiments, we used anti-Bcd and anti-Hb antibodies for simultaneously detecting their respective intensities in individual embryos to facilitate the assessment of the relationship between Bcd and Hb. In our analysis of Hb intensity, we used the parameter xHb, which is the A-P position where Hb intensity is half-maximal, to describe the boundary of the Hb domain near mid-embryo (referred to as the Hb boundary for short) at early nuclear cycle 14. We find the mean Hb boundary is positioned at 0.43 embryo length (EL) for the early subgroup and at 0.45 EL for the late subgroup of wt embryos (also see (32) for a posterior movement of the Hb boundary position). In nej embryos, the mean Hb boundary is at 0.42 EL (early) and at 0.46 EL (late). Furthermore, our results show that, at early nuclear cycle 14, xHb exhibits a higher variability in nej embryos than in wt embryos: standard deviation WHb/L = 0.013 ± 0.003 and 0.016 ± 0.003 for the early subgroup of wt and nej embryos, respectively, and WHb/L = 0.011 ± 0.003 and 0.022 ± 0.005 for the late subgroup of wt and nej embryos respectively (see Fig. 3, insets, for measured positional errors of Hb profiles near the boundary position). At early times, WHb is slightly larger in nej embryos compared to wt. However, at late times we see clear and statistically significant differentiation in WHb between the wt and nej mutant. These results illustrate a deficiency of nej embryos in making precise developmental decisions near mid-embryo along the A-P axis.
Figure 3.
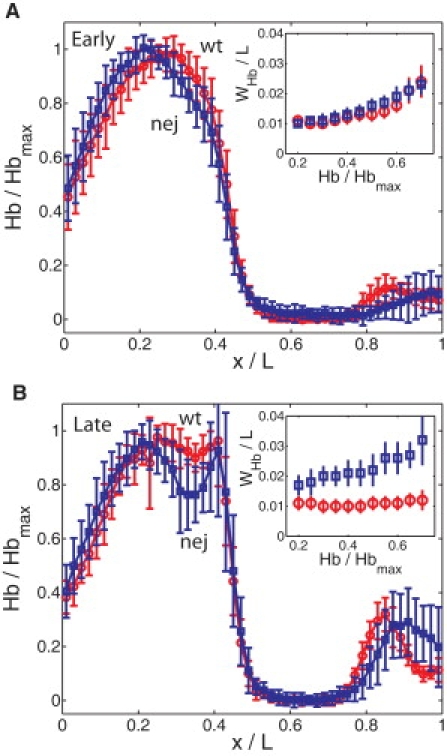
Increased Hb boundary variations in nej embryos. (A) Shown are average normalized Hb profiles measured in the early subgroup of wt (red circles) and nej (blue squares) embryos as a function of x/L. Error bars show standard deviations of Hb intensities. (Insets) Corresponding measured positional error WHb/L (the standard deviation of measured threshold positions) of the Hb profiles in the range 0.4 < x/L < 0.5. (B) Same as panel A, except for the late subgroup. The PS4 Hb expression stripe (seen as a second intensity peak near mid-embryo) just begins to be detectable at this stage of development (compare with panel A and see text for further details).
Theoretical modeling and parameter estimation for precision of Hb boundary
To further analyze the relationship between the Bcd gradient properties and its target activation, we conducted theoretical modeling of the Hb boundary precision, where we assumed that the sole input to hb gene expression is from Bcd. This assumption is, of course, an oversimplification of the system as hb expression is also subject to gap gene cross-regulation and Hb autoactivation (24,33,34) and, furthermore, our analysis does not model an experimentally observed correlation between λ and the Bcd intensity at the Hb boundary position in wt embryos (6). Hb expression in early embryos is a dynamic process driven by two hb enhancers that respond to distinct sets of inputs—a Bcd-dependent enhancer and a Bcd-independent enhancer that responds to Hb itself and other gap gene products (35,36). The Bcd-independent enhancer is responsible for the parasegment 4 (PS4) expression stripe (see Materials and Methods in the Supporting Material). Because the PS4 expression stripe only becomes detectable in the late subgroup of embryos in our study (see Fig. 3 B and compare with Fig. 3 A), the Hb boundary in the early subgroup should reflect primarily the expression domain driven by the Bcd-dependent hb enhancer. Although additional factors such as regulation by other gap genes and Hb self-regulation play a role later in cycle 14, the dominant source of error in Hb positioning in our study is likely to come from fluctuations in the Bcd gradient.
Calculating Hb boundary precision
In our theory, the Hb boundary positional error is dictated by three statistically independent contributions: the external fluctuations in B1ind and Λ (or anind and x0/L) as discussed above, and the Bcd internal fluctuations that we discuss further here. Due to the steepness of the Hb profile around mid-embryo, internal noise in the Hb profile itself and imaging/processing/background noise in measuring the Hb intensity have little effect on the observed Hb boundary precision (see the Supporting Material). In our model, Bcd is sampled at the Bcd-responsive hb enhancer region in order to drive hb gene expression. The instantaneous internal fluctuations generated by the random diffusive arrival statistics of Bcd will be Poissonian, and, as the Bcd binding sites are so small (on the length scale of nanometers), these fluctuations are expected to be very large. To reduce these fluctuations, our model allows the system to perform time and/or spatial averaging (5,25,37,38). Time averaging over a period τ is provided by the lifetimes of the downstream mRNA/protein products and is assumed to reduce the effect of internal noise by an amount proportional to (5,25). Similarly, spatial averaging over Nspat neighboring nuclei, for example by diffusion of Hb (37,38), is assumed to reduce the effect of internal noise by (19) where Nspat ∝ τ. These averaging processes are very different from our experimental and theoretical treatments directly on the Bcd intensity data: due to the instantaneous nature of data acquisition from fixed embryos, there was no time/spatial averaging but the Bcd fluorescent intensity was sampled in a much larger, nuclear volume. Combining these contributions, we find the positional error of the Hb boundary due to internal fluctuations in the Bcd morphogen profile is (13,25)
| (6) |
where Δx is the linear size of the DNA binding target, fconv is the conversion factor between measured intensity and concentration, D0 is the local diffusion constant in or around the nuclei, Nspat = CD0τ results from spatial averaging (37) with C a constant that depends on the particular spatial distribution of nuclei (19), and k3d is a constant associated with time averaging, determined numerically (13). fconv is deduced from Gregor et al. (19) by comparing our measured intensity for Bcd at the Hb boundary with the threshold concentration found in Gregor et al. (19). Parameter values are listed in the Table S5 in the Supporting Material.
In nej embryos, fluctuations in anind and x0/L contribute to the observed error in the Hb boundary along with internal fluctuations. The formula corresponding to Eq. 6 for nej embryos is (13)
| (7) |
We can now deduce the total error in determining the Hb boundary for the wt and nej embryos,
where Wext = δBext(x)/|B′(x)| is the positional error due to fluctuations in B1 and Λ (or an and x0/L).
Estimating the averaging time
The only parameter that we do not have a good estimate for is the averaging time, τ. To estimate its value, we consider three experiments where Bcd is known to be the primary or sole activator of gene expression.
First, the effects of gap gene cross-regulation had been experimentally removed in Kr;kni double mutants with a Hb boundary of 0.47 ± 0.022 EL (24). Next, we measured the expression boundary (0.48 ± 0.020 EL) of a hb-lacZ reporter driven by the Bcd-dependent hb enhancer that was suggested to be insensitive to gap gene cross-regulation (20). Finally, a synthetic reporter gene with only three Bcd binding sites (thus with the Bcd activator gradient being the sole input) had been previously shown to have an expression boundary of 0.29 ± 0.016 EL (39). By using our theoretical approach, including averaging in both space and time, an averaging period of 10 min ± 5 min was found to replicate the above experimental observations with our late subgroup data set, as appropriate for the experimental embryos (the computed positional error at 0.47, 0.48, and 0.29 EL was found to be WHb/L = 0.024 ± 0.013, 0.025 ± 0.013, and 0.018 ± 0.009). Importantly, the averaging period found theoretically is comparable to the timescale of nuclear divisions in early Drosophila embryos.
The demonstrated agreement between experimental and theoretical precision values suggests that our model is capable of recapitulating correctly the positional precision when Bcd is the only activator input. We note that significantly longer averaging periods could further increase precision but they are inconsistent with the known timescales of nuclear divisions in early Drosophila embryos. Our modeling analysis also supports a role for spatial averaging over neighboring nuclei: without this effect, WHb/L would be increased ∼3–4-fold in our model and the system would be unable to attain the required levels of precision within a timescale constrained by nuclear divisions in early embryos. We also find that, although the contribution of internal noise is significant, the external components of the fluctuations contribute more (74%, 74%, and 83%) to the variance (WHb/L)2 at the above respective positions of 0.47, 0.48, and 0.29 EL, with the remainder arising from internal noise. The relatively small contributions of internal noise to the calculated positional errors of the domain boundaries of Bcd targets demonstrate that time and spatial averaging are highly effective processes in reducing the impact of the internal noise. We discuss other possible sources of noise in the Supporting Material.
Comparison of theoretical and experimental data on Hb boundary precision in wt and nej embryos
Using the above experimental data, we have specified our model parameters, including the averaging period τ. We can now predict the positional error of the Hb boundary in wt and nej embryos and compare it with the experimental data for Hb boundary precision that was not used in our above-discussed fitting. For the early subgroup, our model predicts a positional error of WHb/L = 0.016 ± 0.008 (wt) and WHb/L = 0.023 ± 0.010 (nej), and for the late subgroup, WHb/L = 0.021 ± 0.011 (wt) and WHb/L = 0.039 ± 0.012 (nej). Comparing with the experimental values (see Increased Hb Variations in nej Embryos), several conclusions can be made:
-
1.
Our calculated widths are overestimates in all cases, consistent with the fact that our current model does not incorporate other effects that may also influence Hb boundary precision (6,24,34,36); see also below)).
-
2.
Although the measured values deviate from our theoretical values by ∼10–50%, the theoretically predicted widths are already very small, suggesting a high level of precision of the positional information encoded by the Bcd gradient alone.
-
3.
Our theory predicts that precision is higher in wt embryos than in nej embryos for both the early and late subgroups. According to our interpretation, this effect is due to the flatter Bcd profiles in nej embryos.
-
4.
Our theory predicts that positioning is less precise in the late-versus-early subgroups, as a result of all the profiles becoming flatter over time in both wt and nej embryos. This prediction, however, contradicts experimental data of wt embryos, where xHb in the late subgroup is actually more precise than in the early subgroup. Even for nej embryos where xHb in the late subgroup is less precise than in the early subgroup, the predicted width for the late subgroup is significantly higher than the experimental data. Because the Bcd-independent hb enhancer driving the PS4 stripe effectively integrates the inputs from gap gene cross-regulation and Hb autoactivation (35,36), we suggest that the timing of PS4 expression is critically important to the system. Specifically, as the positional errors of the Bcd gradient begin to rise (in late subgroups), the Hb boundary maintains and further refines its precision by relying on additional available inputs such as gap gene products through a distinct hb enhancer. The more pronounced Hb boundary variations in late nej embryos (than in early nej embryos) suggest that dCBP may also play a role in such maintenance/refinement mechanisms.
-
5.
Finally, we find that, in most cases, the dominant contribution to the target boundary variations is external noise, which in wt embryos comprises 66% (early), 74% (late), and in nej embryos 56% (early), 80% (late) of the variance (WHb/L)2. Internal noise makes up the remaining contribution.
Distinguishing the effects of an altered gradient profile from a transcriptional defect
dCBP is a Bcd coactivator that is important for transcription (30,31), so it is critical to determine whether the observed decrease in Hb boundary precision in nej embryos is a consequence of an altered Bcd gradient profile or a defective transcription process. To directly differentiate between these two possibilities, we investigated Otd, another target of Bcd (39,40) with an expression domain boundary at 0.26 EL (for both wt and nej embryos).
We first calculate the expected precision of the Otd boundary using a similar analysis as for Hb, where we assume that the only relevant difference between the wt and nej embryos is in the altered Bcd profile. To calculate the positional precision of the Otd domain boundary (referred to as Otd boundary for short) we make the following assumptions: the time-averaging period for Hb and Otd is similar; the effective sizes of the appropriate DNA binding regions for Bcd are roughly equal; and we include spatial averaging. With these assumptions, we find the following calculated relative positional errors: WOtd/L = 0.014 ± 0.007 (wt), WOtd/L = 0.016 ± 0.007 (nej) in the early subgroup, and WOtd/L = 0.019 ± 0.009 (wt), WOtd/L = 0.023 ± 0.010 (nej) in the late subgroup. Our results are robust to reasonable variations in averaging time (see the Supporting Material). These results show that, unlike the Hb boundary, the expected Otd boundary position has comparable precision in wt and nej embryos. This is because, unlike at the Hb boundary position, both wt and nej embryos have similarly steep Bcd intensity profiles (see Fig. 1) and comparable density fluctuations at 0.26 EL. These predictions can be contrasted to a competing hypothesis that nej embryos have a global defect in transcription—an effect that would increase positional errors at both the Hb and Otd boundary positions. To distinguish between these possibilities, we conducted costaining experiments side by side to simultaneously detect Hb and Otd in wt and nej embryos at early nuclear cycle 14 (see Fig. 4). Unlike xHb, which is more variable in nej embryos (WHb/L = 0.018 ± 0.003 (wt), 0.027 ± 0.004 (nej)), the precision of the Otd boundary position was similar in nej embryos as compared to the wt (WOtd/L = 0.016 ± 0.003 (wt), 0.015 ± 0.002 (nej); see Fig. 4, inset). These experimental values provide no evidence to support a global decrease in positional precision in nej embryos, as would be expected for a global transcriptional defect relevant to the boundary precisions that we measure. On the contrary, they support our conclusion that the loss of positional precision of Bcd targets in nej embryos is a position-dependent defect associated with an altered Bcd gradient profile.
Figure 4.
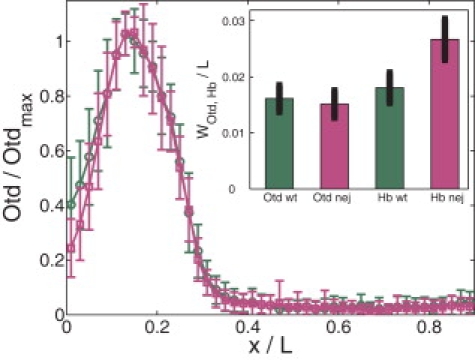
Otd boundary variations in wt and nej embryos. Shown are average normalized Otd profiles for wt (green) and nej (magenta) embryos at early nuclear cycle 14 as a function of x/L. Error bars show standard deviations of Otd intensities. (Inset) Measured positional error WOtd/L and WHb/L (the standard deviation of measured threshold positions) of the Otd and Hb boundaries for both wt and nej embryos.
Discussion
The morphogen concept, which arose initially from theoretical considerations (41), represents a fundamental framework that has guided thinking and experimental investigation of developmental processes. Up until now, only a limited number of morphogen gradients have been experimentally observed and quantitatively characterized. The experimental and theoretical studies presented in this report reveal important insights into how the profile of a morphogen gradient affects the precision of its positional information. Although it is clear that the positional information provided by the gradient depends on the density fluctuations and slope, it is not immediately obvious that the target boundary precision must depend sensitively on these parameters because the precision of target responses could, in theory, be achieved mainly through other means such as downstream cross-regulation (here via the gap genes). Data presented here and elsewhere shows that the readout machinery is actually very precise (37,38), such that the precision of the output (domain boundary position) depends sensitively on the Bcd input precision. Hence, the gradient density fluctuations and slope feed through directly into the precision of target domain boundaries.
Our results described in this report show that the Bcd gradient in nej embryos has a reduced ability, as compared to the wt gradient, in conferring precise positional information, particularly toward mid-embryo. Although the fluctuations in Bcd intensities δB are similar in both cases near mid-embryo, an increasing flatness of the Bcd profile in nej embryos leads to increasing positional errors. We note that, because dCBP is a cofactor important for Bcd and other transcription factors (27–29), we cannot formally rule out the possibility that Hb boundary variations in nej embryos are caused by other defects in addition to the increased positional errors of the Bcd gradient. The contrasting behaviors of Hb and Otd in nej embryos suggest that perturbations in the Bcd gradient profile in nej embryos are primarily responsible for the increased errors of the Hb boundary position, as opposed to a global defect in transcription relevant to the our current analysis.
How precise expression patterns of Bcd targets are achieved in embryos remains highly controversial. According to one hypothesis, advanced by Gregor et al (5), the positional information provided by the Bcd gradient is highly precise. Currently, the only available experimental evidence that a precise Bcd gradient is necessary for precise target expression comes from a study of stau embryos, in which increased Bcd profile variability directly leads to increased Hb expression variability (6). However, the positional information encoded by the Bcd gradient in wt embryos, although precise, may still not be precise enough—leading to the suggestion of the operation of additional mechanisms (6,24,42). In this article's theoretical model, the predicted values of target boundary variations are in good agreement with experimental data but remain generally larger than observed even with the proper consideration of space and time averaging. To further increase precision, we would need to include additional processes such as gap gene dynamics (42). However, theoretical work has found that the inclusion of (simplified) gap gene dynamics does not alter the qualitative conclusions from our model regarding the relative importance of sources of noise in limiting Hb precision (20,23). Hb autoactivation may also play an important role in Hb dynamics (43), but such a mechanism is likely to affect the steepness of the Hb boundary rather than the precision of its positioning (43). We note that the most important comparisons relevant to our conclusions are made between wt and nej embryos. Although additional factors, such as gap genes, will increase Hb boundary precision in both cases (6,24), they are unlikely to alter our conclusions regarding the relative advantages of the wt Bcd profile over that in nej embryos. Our comparative evaluations described in this report, both experimental and theoretical, provide a further demonstration that the precise positional information encoded by the wt Bcd gradient is necessary for the precise target expression patterns during development.
An important finding of this work is the identification of an altered Bcd gradient profile in nej embryos, allowing us to conduct comparative analyses with its counterpart in wt embryos. We currently do not know exactly how this new gradient profile is generated dynamically. Although dCBP can physically interact with Bcd (31), it is currently unclear whether such an interaction may influence the pathways or kinetics of Bcd degradation. We emphasize that our inability to describe the dynamic formation of the Bcd profile in nej embryos (in fact, a recent study (21) questions the commonly accepted view on the formation of the wt Bcd gradient) should not alter our conclusions because our theoretical analysis does not require assumptions about the dynamics of gradient formation. Indeed, repeating our analysis with an alternative functional form for fitting the nej data does not alter our conclusions. The key point is that our analysis and conclusions are derived directly from the shape of the Bcd profiles, not the processes that formed such profiles.
The analysis described in this report has also allowed us, for the first time, to our knowledge, to dissect the errors in positional information provided by morphogen gradients into their component parts, both internal and external. Somewhat surprisingly, for the Bcd staining data, we found that the internal noise was the most important contributor to its positional error close to mid-embryo. Conversely, for the Hb boundary position, we found that external fluctuations have a typically dominant effect on its precision, with only a lesser contribution from internal noise. The latter result highlights the vital importance of both time and spatial averaging in reducing the impact of internal fluctuations on target precision. Overall, it appears that the fluctuations in the Bcd gradient itself are dominated by internal fluctuations, but, due to effective averaging mechanisms downstream, the precision of the Hb boundary is limited predominantly by external variations. Our results underscore the importance of careful considerations of both embryo-to-embryo and internal biochemical variations in morphogen concentration as we aim to gain a full understanding of boundary specification and pattern formation in the early Drosophila embryo.
Acknowledgments
We thank Dr. Christiane Nusslein-Volhard's lab, Dr. Mattias Mannervik, and the Bloomington Stock Center for flies; Drs. Paul Macdonald, John Reinitz, and Tiffany Cook for anti-Bcd, anti-Hb, and anti-Otd antibodies; Bo Yang for technical assistance; and the members of our labs for discussions.
This work was supported in part by awards from the National Institutes of Health and National Science Foundation (J.M.), and from the Biotechnology and Biological Sciences Research Council, UK, and The Royal Society (M.H.). R.J. acknowledges support from the National Science Foundation of China (grant No. 30623005) and the 973 Program (grant No. 2009CB918702).
Footnotes
This is an Open Access article distributed under the terms of the Creative Commons-Attribution Noncommercial License (http://creativecommons.org/licenses/by-nc/2.0/), which permits unrestricted noncommercial use, distribution, and reproduction in any medium, provided the original work is properly cited.
Contributor Information
Martin Howard, Email: martin.howard@bbsrc.ac.uk.
Jun Ma, Email: jun.ma@cchmc.org.
Supporting Material
References
- 1.Kerszberg M., Wolpert L. Specifying positional information in the embryo: looking beyond morphogens. Cell. 2007;130:205–209. doi: 10.1016/j.cell.2007.06.038. [DOI] [PubMed] [Google Scholar]
- 2.Lander A.D. Morpheus unbound: reimagining the morphogen gradient. Cell. 2007;128:245–256. doi: 10.1016/j.cell.2007.01.004. [DOI] [PubMed] [Google Scholar]
- 3.Lewis J. From signals to patterns: space, time, and mathematics in developmental biology. Science. 2008;322:399–403. doi: 10.1126/science.1166154. [DOI] [PubMed] [Google Scholar]
- 4.Arias A.M., Hayward P. Filtering transcriptional noise during development: concepts and mechanisms. Nat. Rev. Genet. 2006;7:34–44. doi: 10.1038/nrg1750. [DOI] [PubMed] [Google Scholar]
- 5.Gregor T., Wieschaus E.F., Tank D.W. Stability and nuclear dynamics of the Bicoid morphogen gradient. Cell. 2007;130:141–152. doi: 10.1016/j.cell.2007.05.026. [DOI] [PMC free article] [PubMed] [Google Scholar]
- 6.He F., Wen Y., Ma J. Probing intrinsic properties of a robust morphogen gradient in Drosophila. Dev. Cell. 2008;15:558–567. doi: 10.1016/j.devcel.2008.09.004. [DOI] [PMC free article] [PubMed] [Google Scholar]
- 7.Houchmandzadeh B., Wieschaus E., Leibler S. Establishment of developmental precision and proportions in the early Drosophila embryo. Nature. 2002;415:798–802. doi: 10.1038/415798a. [DOI] [PubMed] [Google Scholar]
- 8.Kicheva A., Pantazis P., González-Gaitán M. Kinetics of morphogen gradient formation. Science. 2007;315:521–525. doi: 10.1126/science.1135774. [DOI] [PubMed] [Google Scholar]
- 9.Surkova S., Kosman D., Reinitz J. Characterization of the Drosophila segment determination morphome. Dev. Biol. 2008;313:844–862. doi: 10.1016/j.ydbio.2007.10.037. [DOI] [PMC free article] [PubMed] [Google Scholar]
- 10.Ben-Zvi D., Shilo B.-Z., Barkai N. Scaling of the BMP activation gradient in Xenopus embryos. Nature. 2008;453:1205–1211. doi: 10.1038/nature07059. [DOI] [PubMed] [Google Scholar]
- 11.Eldar A., Dorfman R., Barkai N. Robustness of the BMP morphogen gradient in Drosophila embryonic patterning. Nature. 2002;419:304–308. doi: 10.1038/nature01061. [DOI] [PubMed] [Google Scholar]
- 12.Eldar A., Rosin D., Barkai N. Self-enhanced ligand degradation underlies robustness of morphogen gradients. Dev. Cell. 2003;5:635–646. doi: 10.1016/s1534-5807(03)00292-2. [DOI] [PubMed] [Google Scholar]
- 13.Saunders T.E., Howard M. Morphogen profiles can be optimized to buffer against noise. Phys. Rev. E. 2009;80:041902. doi: 10.1103/PhysRevE.80.041902. [DOI] [PubMed] [Google Scholar]
- 14.Bollenbach T., Pantazis P., Jülicher F. Precision of the Dpp gradient. Development. 2008;135:1137–1146. doi: 10.1242/dev.012062. [DOI] [PubMed] [Google Scholar]
- 15.Morishita Y., Iwasa Y. Accuracy of positional information provided by multiple morphogen gradients with correlated noise. Phys. Rev. E. 2009;79:061905. doi: 10.1103/PhysRevE.79.061905. [DOI] [PubMed] [Google Scholar]
- 16.Driever W., Nüsslein-Volhard C. A gradient of Bicoid protein in Drosophila embryos. Cell. 1988;54:83–93. doi: 10.1016/0092-8674(88)90182-1. [DOI] [PubMed] [Google Scholar]
- 17.Ephrussi A., St. Johnston D. Seeing is believing: the Bicoid morphogen gradient matures. Cell. 2004;116:143–152. doi: 10.1016/s0092-8674(04)00037-6. [DOI] [PubMed] [Google Scholar]
- 18.Struhl G., Struhl K., Macdonald P.M. The gradient morphogen Bicoid is a concentration-dependent transcriptional activator. Cell. 1989;57:1259–1273. doi: 10.1016/0092-8674(89)90062-7. [DOI] [PubMed] [Google Scholar]
- 19.Gregor T., Tank D.W., Bialek W. Probing the limits to positional information. Cell. 2007;130:153–164. doi: 10.1016/j.cell.2007.05.025. [DOI] [PMC free article] [PubMed] [Google Scholar]
- 20.Bergmann S., Sandler O., Barkai N. Pre-steady-state decoding of the Bicoid morphogen gradient. PLoS Biol. 2007;5:e46. doi: 10.1371/journal.pbio.0050046. [DOI] [PMC free article] [PubMed] [Google Scholar]
- 21.Spirov A., Fahmy K., Baumgartner S. Formation of the Bicoid morphogen gradient: an mRNA gradient dictates the protein gradient. Development. 2009;136:605–614. doi: 10.1242/dev.031195. [DOI] [PMC free article] [PubMed] [Google Scholar]
- 22.Hecht I., Rappel W.-J., Levine H. Determining the scale of the Bicoid morphogen gradient. Proc. Natl. Acad. Sci. USA. 2009;106:1710–1715. doi: 10.1073/pnas.0807655106. [DOI] [PMC free article] [PubMed] [Google Scholar]
- 23.Saunders T.E., Howard M. When it pays to rush: interpreting morphogen gradients prior to steady-state. Phys. Biol. 2009;6:046020. doi: 10.1088/1478-3975/6/4/046020. [DOI] [PubMed] [Google Scholar]
- 24.Manu S., Surkova S., Reinitz J. Canalization of gene expression in the Drosophila blastoderm by gap gene cross regulation. PLoS Biol. 2009;7:e1000049. doi: 10.1371/journal.pbio.1000049. [DOI] [PMC free article] [PubMed] [Google Scholar]
- 25.Tostevin F., ten Wolde P.R., Howard M. Fundamental limits to position determination by concentration gradients. PLOS Comput. Biol. 2007;3:e78. doi: 10.1371/journal.pcbi.0030078. [DOI] [PMC free article] [PubMed] [Google Scholar]
- 26.Wu Y.F., Myasnikova E., Reinitz J. Master equation simulation analysis of immunostained Bicoid morphogen gradient. BMC Syst. Biol. 2007;1:52. doi: 10.1186/1752-0509-1-52. [DOI] [PMC free article] [PubMed] [Google Scholar]
- 27.Akimaru H., Chen Y., Ishii S. Drosophila CBP is a co-activator of cubitus interruptus in hedgehog signaling. Nature. 1997;386:735–738. doi: 10.1038/386735a0. [DOI] [PubMed] [Google Scholar]
- 28.Akimaru H., Hou D.X., Ishii S. Drosophila CBP is required for dorsal-dependent twist gene expression. Nat. Genet. 1997;17:211–214. doi: 10.1038/ng1097-211. [DOI] [PubMed] [Google Scholar]
- 29.Lilja T., Aihara H., Mannervik M. The acetyltransferase activity of Drosophila CBP is dispensable for regulation of the Dpp pathway in the early embryo. Dev. Biol. 2007;305:650–658. doi: 10.1016/j.ydbio.2007.01.036. [DOI] [PubMed] [Google Scholar]
- 30.Fu D., Ma J. Interplay between positive and negative activities that influence the role of Bicoid in transcription. Nucleic Acids Res. 2005;33:3985–3993. doi: 10.1093/nar/gki691. [DOI] [PMC free article] [PubMed] [Google Scholar]
- 31.Fu D., Wen Y., Ma J. The co-activator CREB-binding protein participates in enhancer-dependent activities of Bicoid. J. Biol. Chem. 2004;279:48725–48733. doi: 10.1074/jbc.M407066200. [DOI] [PubMed] [Google Scholar]
- 32.Keränen S.V., Fowlkes C.C., Biggin M.D. Three-dimensional morphology and gene expression in the Drosophila blastoderm at cellular resolution II: dynamics. Genome Biol. 2006;7:R124. doi: 10.1186/gb-2006-7-12-r124. [DOI] [PMC free article] [PubMed] [Google Scholar]
- 33.Ochoa-Espinosa A., Yu D., Small S. Anterior-posterior positional information in the absence of a strong Bicoid gradient. Proc. Natl. Acad. Sci. USA. 2009;106:3823–3828. doi: 10.1073/pnas.0807878105. [DOI] [PMC free article] [PubMed] [Google Scholar]
- 34.Simpson-Brose M., Treisman J., Desplan C. Synergy between the hunchback and Bicoid morphogens is required for anterior patterning in Drosophila. Cell. 1994;78:855–865. doi: 10.1016/s0092-8674(94)90622-x. [DOI] [PubMed] [Google Scholar]
- 35.Kosman D., Small S. Concentration-dependent patterning by an ectopic expression domain of the Drosophila gap gene knirps. Development. 1997;124:1343–1354. doi: 10.1242/dev.124.7.1343. [DOI] [PubMed] [Google Scholar]
- 36.Margolis J.S., Borowsky M.L., Posakony J.W. Posterior stripe expression of Hunchback is driven from two promoters by a common enhancer element. Development. 1995;121:3067–3077. doi: 10.1242/dev.121.9.3067. [DOI] [PubMed] [Google Scholar]
- 37.Erdmann T., Howard M., ten Wolde P.R. Role of spatial averaging in the precision of gene expression patterns. Phys. Rev. Lett. 2009;103:258101. doi: 10.1103/PhysRevLett.103.258101. [DOI] [PubMed] [Google Scholar]
- 38.Okabe-Oho Y., Murakami H., Sasai M. Stable, precise, and reproducible patterning of Bicoid and Hunchback molecules in the early Drosophila embryo. PLOS Comput. Biol. 2009;5:e1000486. doi: 10.1371/journal.pcbi.1000486. [DOI] [PMC free article] [PubMed] [Google Scholar]
- 39.Crauk O., Dostatni N. Bicoid determines sharp and precise target gene expression in the Drosophila embryo. Curr. Biol. 2005;15:1888–1898. doi: 10.1016/j.cub.2005.09.046. [DOI] [PubMed] [Google Scholar]
- 40.Gao Q., Finkelstein R. Targeting gene expression to the head: the Drosophila orthodenticle gene is a direct target of the Bicoid morphogen. Development. 1998;125:4185–4193. doi: 10.1242/dev.125.21.4185. [DOI] [PubMed] [Google Scholar]
- 41.Wolpert L. Positional information and the spatial pattern of cellular differentiation. J. Theor. Biol. 1969;25:1–47. doi: 10.1016/s0022-5193(69)80016-0. [DOI] [PubMed] [Google Scholar]
- 42.Jaeger J., Surkova S., Reinitz J. Dynamic control of positional information in the early Drosophila embryo. Nature. 2004;430:368–371. doi: 10.1038/nature02678. [DOI] [PubMed] [Google Scholar]
- 43.Lopes F.J.P., Vieira F.M.C., Spirov A.V. Spatial bistability generates hunchback expression sharpness in the Drosophila embryo. PLOS Comput. Biol. 2008;4:e1000184. doi: 10.1371/journal.pcbi.1000184. [DOI] [PMC free article] [PubMed] [Google Scholar]
- 44.Davison A.C., Hinkley D.V. Cambridge University Press; Cambridge, UK: 2006. Bootstrap Methods and Their Application. [Google Scholar]
Associated Data
This section collects any data citations, data availability statements, or supplementary materials included in this article.