

Abstract
Irregularly occurring early afterdepolarizations (EADs) in cardiac myocytes are traditionally hypothesized to be caused by random ion channel fluctuations. In this study, we combined 1), patch-clamp experiments in which action potentials were recorded at different pacing cycle lengths from isolated rabbit ventricular myocytes under several experimental conditions inducing EADs, including oxidative stress with hydrogen peroxide, calcium overload with BayK8644, and ionic stress with hypokalemia; 2), computer simulations using a physiologically detailed rabbit ventricular action potential model, in which repolarization reserve was reduced to generate EADs and random ion channel or path cycle length fluctuations were implemented; and 3), iterated maps with or without noise. By comparing experimental, modeling, and bifurcation analyses, we present evidence that noise-induced transitions between bistable states (i.e., between an action potential with and without an EAD) is not sufficient to account for the large variation in action potential duration fluctuations observed in experimental studies. We conclude that the irregular dynamics of EADs is intrinsically chaotic, with random fluctuations playing a nonessential, auxiliary role potentiating the complex dynamics.
Introduction
Early afterdepolarizations (EADs) are voltage oscillations that occur during the repolarizing phase of the cardiac action potential (AP) and are associated with lethal cardiac arrhythmias (1–7). EADs usually occur in the setting of reduced repolarization reserve, which can result from either a reduction in outward currents or an increase in inward currents, or both, such as in congenital long-QT syndromes (8–11) and heart failure (12,13), or in the presence of drugs (14–19).
A widely observed phenomenon is that EADs often occur irregularly (5,12,20,21). This irregularity has traditionally been attributed to random fluctuations, particularly stochastic behavior of ion channels. Supporting this view, Tanskanen et al. (22) simulated a Markovian model of the L-type calcium (Ca) channel to show that the irregular behavior of EADs could be attributed to random channel fluctuations triggering bistable transitions. On the other hand, modeling studies (23,24) using completely deterministic models have shown similar irregular EAD dynamics. In recent studies (5,25), we analyzed this irregular EAD dynamics using mathematical AP models and showed that the irregular EAD behavior in these models was dynamical chaos arising from a homoclinic bifurcation (25) and could be described by iterated maps (5). A characteristic feature of the mathematical models is that this chaotic behavior only occurs over an intermediate range of pacing rates, whereas at fast or slow heart rates, AP duration (APD) shows little variation, because either no APs exhibit EADs, or all APs exhibit EADs. Similar features were observed in our experimental recordings from isolated rabbit myocytes exposed to H2O2 to induce EADs (5). However, in real myocytes, random fluctuations are always present, which raises two questions: 1), are the large irregular fluctuations in APD at intermediate pacing rates observed in the experiments due to random transitions between bistable (or multistable) states triggered by channel noise, as suggested by Tanskanen et al. (22), or to dynamical chaos, as shown in our models (5,25)? 2), if irregular EADs that cause large random APD fluctuations are triggered by noise, are they stochastic or still chaotic?
In this study, we combined experiments in isolated patch-clamped rabbit ventricular myocytes, computer simulations in physiologically detailed AP models, and iterated map analysis to dissect the underlying mechanisms of irregularly occurring EADs. We show that purely noise-induced transitions between bistable states (i.e., between an AP with and without an EAD) is not sufficient to account for the large variation in APD fluctuations observed in the experimental and modeling studies. Therefore, our major conclusion is that irregular EAD behavior is intrinsically chaotic, with random ion channel or heart rate fluctuations playing an auxiliary role.
Methods
Experimental methods
Cell isolation
The use and care of the animals in these experiments were reviewed and approved by the Chancellor's Animal Research Committee at the University of California, Los Angeles, and the Institutional Animal Care and Use Committee at the University of Medicine and Dentistry of New Jersey, Newark, NJ. Ventricular myocytes were enzymatically isolated from adult rabbit hearts (19,26). Briefly, hearts were removed from adult New Zealand white rabbits (2–3 kg) anesthetized with intravenous pentobarbital, and perfused retrogradely in Langendorff fashion at 37°C with nominally Ca-free Tyrode's solution containing ∼1.4 mg/ml collagenase (Type II, Worthington, Freehold, NJ) and 0.1 mg/ml protease (type XIV, Sigma, St. Louis, MO) for 25–30 min. After washing out the enzyme solution, the hearts were removed from the perfusion apparatus and swirled in a culture dish. The Ca concentration was slowly increased to 1.8 mM and the cells were stored at room temperature and used within 8 h.
Patch-clamp methods
Myocytes were patch-clamped using the whole-cell configuration of the patch-clamp technique in the current clamp mode (19,26). Patch pipettes (resistance 2–4 MΩ) were filled with internal solution containing (in mM) 110 K-Aspartate, 30 KCl, 5 NaCl, 10 HEPES, 0.1 EGTA, 5 MgATP, 5 creatine phosphate, and 0.05 cAMP, pH 7.2 adjusted with KOH. Myocytes were superfused with standard Tyrode's solution containing (in mM) 136 NaCl, 5.4 KCl, 0.33 Na2PO4, 1.8 CaCl2, 1 MgCl2, 10 glucose, and 10 HEPES, pH 7.4 adjusted with NaOH. H2O2 (0.1–1 mM) or BayK8644 (50 nM, from a stock solution dissolved in dimethylsulfoxide) were added directly to the superfusate. APs were elicited with 2 ms, 2–4 nA square pulses at various pacing cycle lengths (PCLs). Voltage signals were measured with an Axopatch 200B patch-clamp amplifier controlled by a personal computer using a Digidata 1200 acquisition board driven by pCLAMP 8.0 software. All experiments were carried out at ∼35°C.
Simulation methods
Isolated cell
Voltage is described by the differential equation
| (1) |
where V is the membrane potential, Cm = 1 μF/cm2, Iion is the total membrane ionic current , Isti is the stimulus pulse (amplitude 40 μA/cm2 and duration 1 ms). To simulate EADs, we modified the AP model originally developed by our group (27) by altering the rate constants in the Markovian model of the L-type Ca current (ICa,L) to cause steeper activation and inactivation kinetics, increasing the maximum conductance of the L-type Ca current, and reducing the maximum conductance of IKs, as summarized in our previous study (5). The modifications to ICa were based on our own experimental data of rabbit ventricular myocytes under the conditions of isopretenenol (A. Mahajan, L.-H. Xie, and J. N. Weiss, unpublished data). Eq.1 was numerically solved using a Euler method with adaptive time steps varying from 0.01 ms to 0.1 ms. APD was defined as the time duration when V > −80 mV. The APD restitution curve was calculated using the S1S2 pacing protocol, in which the cell was paced with an S1S1 interval of 2 s to the steady state, followed by a variable S1S2 interval to determine the relationship between the diastolic interval (DI) and the APD.
One-dimensional cable
The partial differential equation that describes the membrane potential V in the 1D cable is
| (2) |
where D is the diffusion constant, which was set to 0.001 cm2/ms. With this diffusion constant, the conduction velocity is ∼55 cm/s. No-flux boundary conditions were used for Eq. 2. Eq. 2 was discretized with Δx = 0.15 mm (roughly the length of a myocyte). Isti is the stimulation current, with a duration of 1 ms and amplitude of 40 μA/cm2.
Stochastic ion channel fluctuations
To simulate stochastic channel fluctuations, we modified the ionic currents in the AP model by modeling the gating variables using a Langevin equation developed by Fox (28). For example, for the gating variable xs1 of IKs, the Langevin equation is
| (3) |
where η is the stochastic noise with the correlation relation
| (4) |
, , and N is the total number of IKs channels. Similar equations were used for the gating variables of INa, IKr, Ito,f, and Ito,s to simulate the random channel fluctuations. Since the calcium current ICa,L is described by a Markovian model, and therefore we cannot use Fox's approximation, we used an algorithm to simulate the random Markov transitions, similar to the one developed by Gillespie (29) for chemical reactions, which is computationally much more tedious than the Langevin representation. As indicated in Eq. 4, the noise strength is inversely proportional to , so that larger N corresponds to weaker noise strength. The number of ion channels in a myocyte may be different for different currents, and may vary from cell to cell, e.g., it was estimated that a ventricular myocyte might contain 40,000 to 200,000 Ca channels (22). In this study, we used N = 22,000 for most of the simulations. We also varied N (but maintained the maximum conductance of ion currents unchanged to maintain the same average APD) to investigate the effects of the noise strength on the APD dynamics. These results are shown in Fig. S6, Fig. S7, Fig. S8, and Fig. S9 in the Supporting Material.
Results
Irregular EAD dynamics in isolated ventricular myocytes
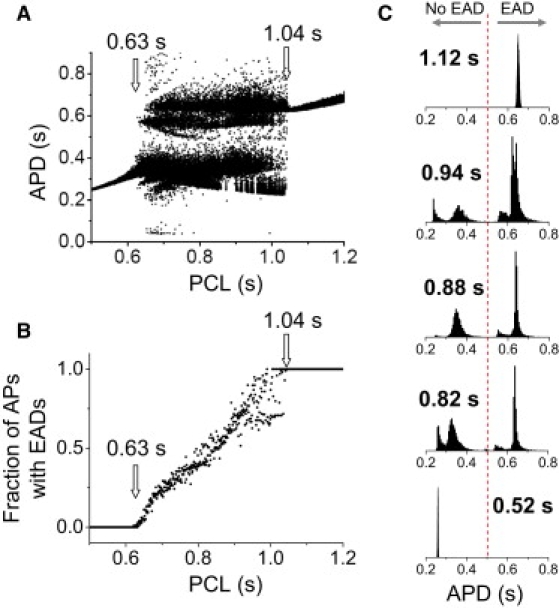
It has been shown that H2O2 promotes EADs in cardiac myocytes, a process that is dependent on oxidative activation of Ca-calmodulin kinase enhancing the late Na current and L-type Ca current (17,19,30). The typical pattern of H2O2-induced EAD dynamics has been shown in our previous study (5): at slow pacing (PCL = 6 s), the APD is regular from beat to beat, with EADs present on every AP; at fast pacing (PCL = 2 s and 1 s), the APD is also regular from beat to beat, but no EADs are present; however, in the intermediate range of pacing rates (PCL = 3 s and 4 s), the APD and the occurrence of EADs are irregular from beat to beat. Here, we plot the APD histograms (Fig. 1), which show that APD variation at either slow or fast pacing rates is much less than at the intermediate rates.
Figure 1.
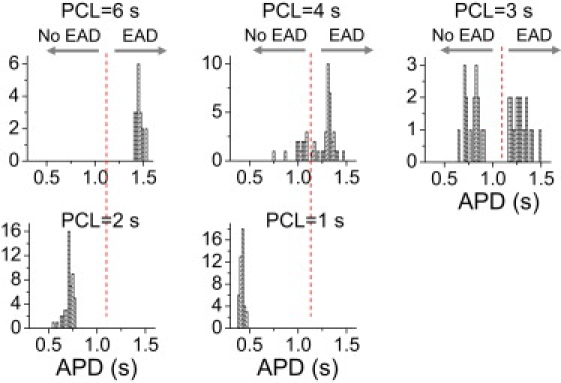
Irregular EAD behaviors observed in isolated rabbit ventricular myocytes exposed to H2O2. APD histograms for different PCLs from a patch-clamped rabbit ventricular myocyte exposed to 1 mM H2O2. The experimental data were taken from our previous study (5). The dashed vertical line marks the border of APs with or without EADs (also shown in APD histograms in subsequent figures).
We also induced EADs in rabbit ventricular myocytes by a different method, exposure to the L-type Ca channel agonist BayK8644 (14,15), and the resulting voltage traces at different PCLs can be seen in Fig. 2 A. The APD histograms (Fig. 2 B) for different PCLs show the same characteristics as in H2O2-induced EADs, i.e., small APD variation at both slow and fast pacing rates, but much larger variation with multiple peaks at the intermediate pacing rates. Note that the ranges of intermediate rates that produce irregular EADs vary depending on the method of EAD induction. This is also true in the computer models, in which the intermediate range of rates can vary depending on parameter changes or the model (5,25).
Figure 2.
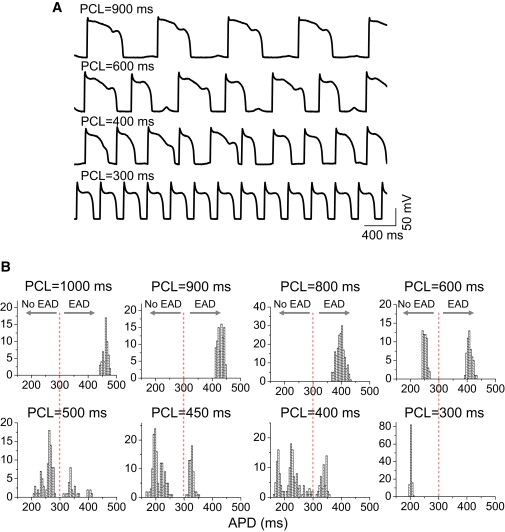
Irregular EAD behaviors observed in isolated rabbit ventricular myocytes exposed to BayK8644. Voltage traces (A) and APD histograms (B) for different PCLs from a rabbit ventricular myocyte exposed to 50 nM BayK8644.
Finally, we induced EADs in rabbit ventricular myocytes by a third method, exposure to hypokalemia (2.7 mM). Fig. 3 shows the recordings of APs (left) and APD histograms (right) at different PCLs. The AP behavior was similar to that shown in our previous study (5) and in Fig. 2 A, except that as the PCL decreased, instead of a single EAD on each AP (as typical for H2O2 and BayK8644), multiple EADs occurred on each AP, eventually culminating in repolarization failure. This is similar to EAD behavior in the modified Luo and Rudy model shown in Tran et al. (25). In that case, at long PCLs, the APD variation did not become smaller, but increased due to the increasing number of EADs. The PCL at which repolarization failure occurred varied from cell to cell, as illustrated in Fig. S1.
Figure 3.
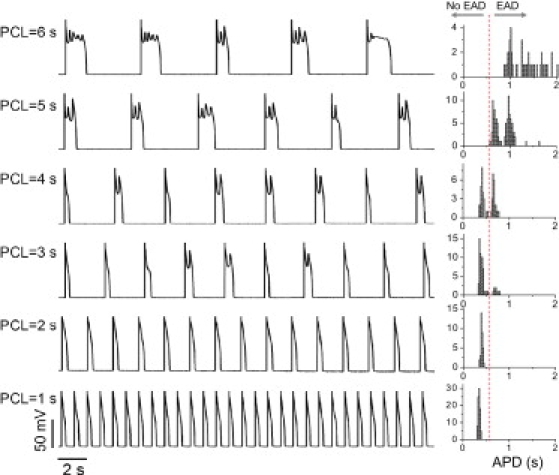
Irregular EAD behaviors observed in isolated rabbit ventricular myocytes exposed to hypokalemia. AP traces (left) and APD histograms (right) are shown for different PCLs from a rabbit ventricular myocyte exposed to hypokalemia ([K]o = 2.7 mM).
With all three methods, EADs occurred in the majority of myocytes studied (>50 in each case). In the H2O2 and BayK8644 cases, large APD variations due to irregular EADs (mostly single) always occurred in the intermediate range of pacing rates. At very slow rates, single EADs occurred after each beat, and APD variation decreased. In the case of hypokalemia, APD variation continuously increased as the pacing rate decreased, due to the occurrence of multiple EADs on each AP, until repolarization failure occurred.
Irregular EADs caused by dynamical chaos
In a completely deterministic rabbit ventricular AP model (27) tuned to generate EADs (5), we observed similar EAD rate dependence (although the range of intermediate PCLs producing irregular variation in APD was different). Fig. 4 A shows the bifurcation diagram, reproduced from Sato et al. (5): at the slow pacing rates, APD was constant from beat to beat, with an equal number of EADs on each AP; at fast pacing rates, APD was constant with no EADs present; at the intermediate pacing rates (0.67–1.04 s), the APD was mostly irregular, due to the variable appearance of EADs from beat to beat. However, periodic windows also existed in this range. For example, between PCL = 0.85 s and PCL = 0.9 s, APD exhibited only two values (called period 2) for each PCL, a type of APD alternans with an EAD occurring on every other beat. Other periodic behaviors also occurred (e.g., period 4 between PCL = 0.92 s and PCL = 0.95 s). Periodic windows, i.e., PCL ranges exhibiting periodic behaviors between two chaotic regions, are a characteristic feature of chaotic systems (31). The fraction of APs exhibiting EADs increased from 0 to 1 as the PCL increased over the intermediate pacing rates (Fig. 4 B). APD histograms from different PCLs (Fig. 4 C) show that the chaotic region resembles that in the experimental data in Fig. 1. The mechanism underlying EAD chaos has been described in our previous studies (5,25), and is related to a homoclinic bifurcation.
Figure 4.
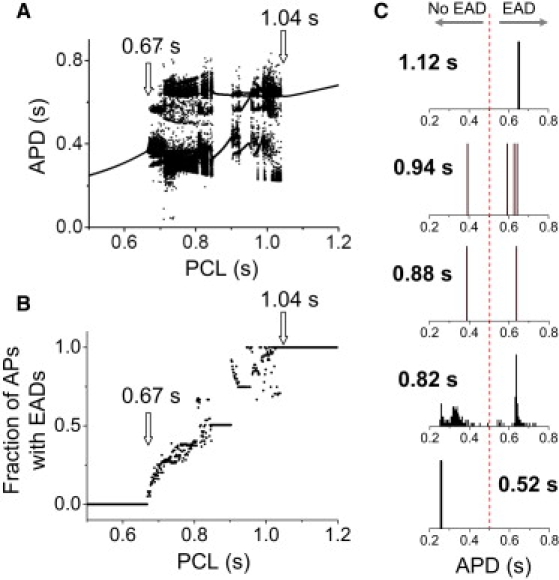
Irregular EAD behaviors in an AP model described by deterministic differential equations. (A) Bifurcation diagram showing APD versus PCL. For each PCL, 100 APDs were plotted. The data were reproduced from our previous study (5). (B) Fraction of APs with EADs versus PCL. (C) APD histograms for selected PCLs (as labeled), showing (upper to lower): period 1 with EADs; period 4; period 2 (EAD alternans); chaotic; and period 1 with no EADs.
To better understand the dynamical mechanisms of irregular EAD behavior, we also developed a minimum three-variable model (Supporting Material), which exhibited complex EAD dynamics (Fig. S2 and Fig. S3), such as chaos and period 2 behavior (EAD alternans), similar to those shown in the physiologically detailed rabbit ventricular AP model. Since there is almost no memory in the three-variable model, the S1S2 APD restitution curve (APD versus DI) is quantitatively similar to the plot of APDn+1 versus DIn from the chaotic EAD region, and the bifurcation diagram obtained from an iterated map using the S1S2 restitution curve is also quantitatively similar to that obtained from the three-variable model (Fig. S4). The analysis of the three-variable model establishes that complex EAD dynamics from the high-dimensional system can be replicated by a minimal three-variable system, in which chaos can be more rigorously analyzed.
Role of random fluctuations
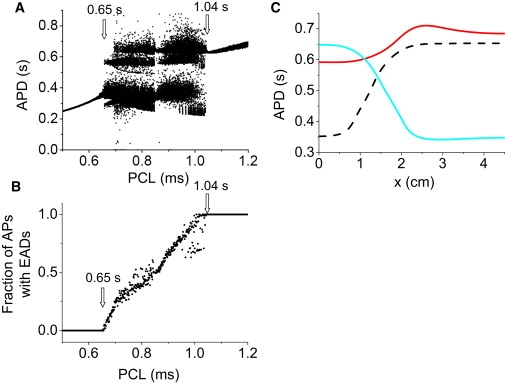
To study the role of random ion channel fluctuations, we added random fluctuations (noise) to one of the currents (IKs) in the AP model, as described in Methods. Fig. 5 A shows that after the addition of noise, the bifurcation diagram is similar to that in Fig. 4 A, except that the periodic windows have disappeared. The minimum PCL at which EADs occurred decreased from 0.67 s to 0.63 s, whereas the minimum PCL at which every AP exhibited EADs was almost unchanged, at 1.04 s. The fraction of APs exhibiting EADs increased almost linearly from zero (PCL ≤ 0.63 s) to 1 (PCL ≥ 1.04 s) as the PCL increased (Fig. 5 B). The APD histograms from different PCLs (Fig. 5 C) were similar to the experimental data.
Figure 5.
Irregular EAD behaviors in an AP model with stochastic ion channel fluctuations. (A) Bifurcation diagram showing APD versus PCL. For each PCL, 100 APDs were plotted. (B) Fraction of APs with EADs versus PCL. (C) APD histograms for selected PCLs (as labeled), which are the same as those in Fig. 4C. The stochastic ion channel fluctuations were added to IKs, as described by Eqs. 3 and 4, with N = 22,000.
The presence of noise caused onset of EAD irregularity to occur at a shorter PCL interval of 0.63 s, compared to 0.67 s in the absence of noise (Fig. 6 A). A question that arises is whether the irregular behavior in this region is random or chaotic. To answer this question, we first carried out two simulations in which the sequence of the random variation in IKs was exactly the same, but the initial conditions were slightly different. After several beats, the two AP patterns became completely different, indicating a sensitive dependence on initial conditions, which is the hallmark of chaos. If the irregular behavior had been due to randomness alone, the APs should have converged to the same values for the same sequence of IKs noise. To substantiate this point further, we carried out simulations in a 1D cable in which every myocyte was paced simultaneously, in the absence and presence of IKs fluctuations (Fig. 6 B). In the absence of IKs noise, APD remained spatially uniform throughout, but in the presence of IKs noise, APD heterogeneities developed in space and changed from beat to beat. This agrees with our previous studies (5,32), which showed that regional chaos synchronization causes dispersion of refractoriness in homogeneous tissue. Therefore, the noise-induced irregular EAD behavior is still chaotic, reflecting the phenomenon of noise-induced chaos widely studied in general nonlinear systems (33–36) and in a recent study in cardiac tissue (37).
Figure 6.
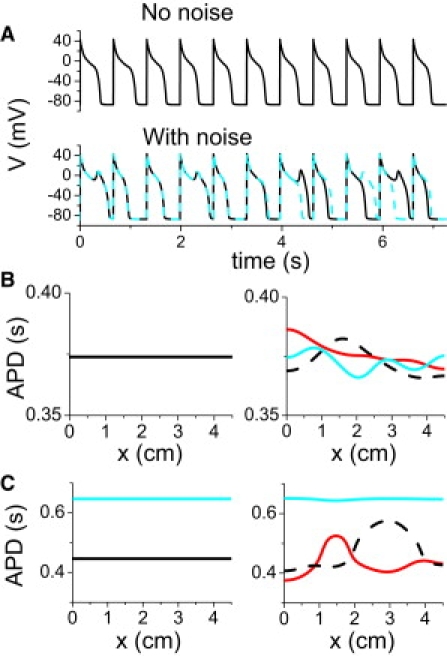
Chaotic EAD behavior induced by stochastic ion channel fluctuations. (A) Voltage versus time for PCL = 660 ms in the absence (upper trace) and presence (lower traces) of stochastic IKs fluctuations. In the lower traces, the same random sequence was used, but the two simulations were started with two slightly different initial values of voltage (1% difference). (B) APD distribution in a 1D cable in the absence (left) and presence (right) of IKs fluctuations. All myocytes in the 1D cable were simultaneously paced with PCL = 660 ms. In the case with noise present, APD distributions from three consecutive beats were plotted, showing large variations in both time and space. (C) Same as B, but for PCL = 900 ms.
The disappearance of the periodic windows in Fig. 4 A and their replacement by irregular behavior in Fig. 5 A was also due to noise-induced chaos, as shown by the simulation in Fig. 6 C. When this 1D cable was paced in a period 2 window, APD distribution was uniform before noise was added, but became nonuniform and changed from beat to beat after noise was added to IKs. However, noise in a periodic window does not always induce irregular EAD dynamics and chaos. In the three-variable model, the large period 2 window (EAD alternans) is still maintained in the presence of random channel fluctuations (see Fig. S5). Also note that although random fluctuations of ion channels can cause large APD fluctuations in isolated myocytes, large spatial APD gradients cannot occur in well-coupled tissue in the absence of chaotic or all-or-none behaviors of EADs (see Fig. S6).
The behaviors shown above did not depend on the specific source of the noise. When random fluctuations were added to other ion currents, the same behaviors were observed (see Fig. S7 and Fig. S8). In addition, if, instead of ion channel noise, we added a 10% random fluctuation in the PCL, we observed the same bifurcation diagram (Fig. 7, A and B). That is, the periodic windows disappeared and the minimum PCL for EADs decreased to 0.65 s, whereas the PCL transition from irregular to regular EAD behavior remained at 1.04 s. Simulations in the 1D cable show that the irregular behavior induced by the PCL fluctuations caused large dispersion in APD, which changed from beat to beat (Fig. 7 C).
Figure 7.
Irregular EAD behavior in an AP model with stochastic PCL fluctuations. (A) Bifurcation diagram showing APD versus PCL. For each PCL, 100 APDs were plotted. (B) Fraction of APs with EADs versus PCL. (C) APD distribution in a 1D cable for three consecutive beats. All myocytes in the 1D cable were simultaneously paced with PCL = 900 ms. Random PCL fluctuations were modeled as PCL′ = PCL + ξ, where ξ is a Gaussian random number with 〈ξ〉 = 0 and standard deviation σ = 20 ms.
Thus, regardless of its specific type or origin, noise changed only the PCL threshold for the transition from no EADs to irregular EADs, but almost did not alter the PCL threshold for the transition from irregular EADs to regular EADs, which remained fixed at PCL = 1.04 s. Even when the noise strength was increased almost threefold, this threshold only had a small change (Fig. S9).
Iterated map analysis
We showed in our previous studies (5,25) that chaos in EAD behavior can be understood by an iterated map derived from APD restitution properties. Here, we use the iterated map method to study the roles of chaos and random fluctuations in irregular EAD dynamics.
In the absence of memory, the current APD can be expressed as a function of the previous DI, i.e., APDn+1 = f(DIn). During periodic stimulation, DIn = PCL − APDn, and
| (5) |
To study the effects of random fluctuations, we added random variations to the APD, i.e.,
| (6) |
where ξn is a random number with a Gaussian distribution. For f(DIn), we used the APD restitution curve measured with an S1S2 protocol from the AP model (Fig. 8 A). The iterated map shows that at either long PCL or short PCL in the absence of noise, APDs are constant from beat to beat, but at intermediate PCLs, higher periodic states and chaos occur. In Fig. 8 B, the histograms of APD distributions for several PCLs show different APD behaviors. In the presence of Gaussian noise (Fig. 8 C), the APD distributions in the periodic windows exhibit similar Gaussian distributions, whereas in chaotic regions, the presence of noise does not markedly alter the histograms but makes them smoother, as in the ordinary differential equation simulations. Note that EAD alternans is still maintained in the presence of noise, similar to the case of the three-variable model shown in the Supporting Material.
Figure 8.

APD histograms in a chaotic iterated map model. (A) APD versus DI obtained using a S1S2 protocol (5). (B) APD histograms for different PCLs (as labeled) obtained using the map function in A and Eq. 5 in the absence of noise. (C) APD histograms for the same PCLs as in B in the presence of noise. The noise, ξn (Eq. 6), was a Gaussian random number, with 〈ξn〉 = 0 and standard deviation σ = 3 ms.
In contrast, if we constructed a map f(DIn) function with no elements capable of generating chaos, using a trivial step function (Fig. 9 A) to model an all-or-none transition to EADs, i.e.,
| (7) |
where θ is the step function, such that θ(DIn) = 0 if DIn < DIc, and θ(DIn) = 1 if DIn ≥ DIc. DIn = PCL − APDn. In the absence of noise, the APD is constant for either long PCL or short PCL, whereas APD alternans occurs at intermediate PCL (Fig. 9 B). No chaos can occur in this map. In the presence of noise, the APD distributions are still Gaussian distributions, with roughly the same deviation at all PCLs, changing from unimodal to bimodal and back to unimodal (Fig. 9 C). Note that we used a discontinuous map of a trivial step function in which the slopes of the two segments are zero. For a discontinuous map with two nonzero sloped segments, the additive noise does not get amplified into large variations as long as the slope is <1 to avoid chaos, and the histogram distributions remain similar to those in Fig. 9 C. This is different from either the chaotic map (Fig. 8) or the experimental observations (Figs. 1–3), in which the APD distributions are much broader for the intermediate PCLs (for the cases of H2O2 and BayK8644), or become progressively broader as PCL increases (for the case of hypokalemia). In other words, the large APD fluctuations and their sensitive dependence on PCL cannot be explained by noise. Rather, they agree better with the chaotic EAD dynamics shown in this study and our previous studies (5,25). This leads us to conclude cautiously that irregular EADs in rabbit ventricular myocytes are due to dynamical chaos, with random fluctuations playing a secondary role.
Figure 9.
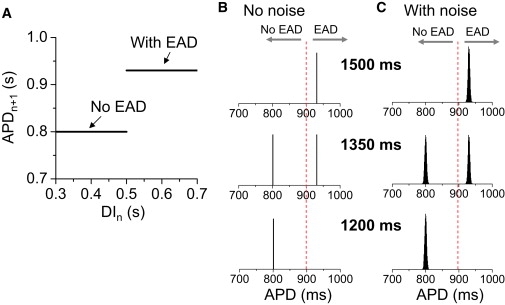
APD histograms in a nonchaotic map model. (A) APD as a step function of DI. (B) APD histograms for different PCLs (as labeled) obtained using the map function in A and Eq. 7 in the absence of noise. (C) APD histograms for the same PCLs as in B in the presence of noise. The noise ξn (Eq. 7) was a Gaussian random number with 〈ξn〉 = 0 and standard deviation σ = 3 ms.
Discussion
Ion channel and other intrinsic random fluctuations naturally exist in cardiac myocytes, and they cause irregular variations in AP morphology and duration. In this study, we present evidence that the irregular EAD behavior widely observed in cardiac myocytes is not simply due to random fluctuations, or noise-mediated bistable transitions, as proposed by Tanskanen et al. (22), but is caused by dynamical chaos. Although we can prove the existence of EAD chaos in a mathematical model, and show that the noise-induced irregular EADs are still chaotic, we cannot absolutely exclude that a nonchaotic behavior induced by random fluctuations could account for irregular EAD behavior in real cardiac myocytes, especially if the magnitude of the random fluctuations is very large. However, three completely different methods of inducing EADs gave similar findings consistent with the modeling and bifurcation analyses, suggesting that a common mechanism, consistent with the dynamical chaos explanation, is at play. The nonpharmacologic method of inducing EADs, hypokalemia, is also directly relevant to the clinical setting. These findings indicate that although other mechanisms may also be important, real myocytes have an intrinsic mechanism in place to explain irregular EAD behavior as a form of chaos, with random fluctuations playing an auxiliary role.
Dynamical chaos and other complex behaviors have been widely studied in real cardiac myocytes and AP models (32,38–44). Here, and in our previous studies (5,25), we have identified another type of chaotic behavior, EAD chaos. Since chaos arises from dynamical instabilities, understanding the dynamical mechanisms of chaos may lead to insights into novel therapeutic approaches based on suppressing dynamical instabilities (45), whereas randomness is very difficult to target therapeutically.
Acknowledgments
This work was supported by a grant from the National Institutes of Health/National Heart, Lung, and Blood Institute (P01 HL078931), a postdoctoral fellowship award from the American Heart Association, Western States Affiliate (to D.S.), and the Laubisch and Kawata Endowments.
Supporting Material
References
- 1.Bailie D.S., Inoue H., Zipes D.P. Magnesium suppression of early afterdepolarizations and ventricular tachyarrhythmias induced by cesium in dogs. Circulation. 1988;77:1395–1402. doi: 10.1161/01.cir.77.6.1395. [DOI] [PubMed] [Google Scholar]
- 2.Antzelevitch C., Sicouri S. Clinical relevance of cardiac arrhythmias generated by afterdepolarizations. Role of M cells in the generation of U waves, triggered activity and torsade de pointes. J. Am. Coll. Cardiol. 1994;23:259–277. doi: 10.1016/0735-1097(94)90529-0. [DOI] [PubMed] [Google Scholar]
- 3.Asano Y., Davidenko J.M., Jalife J. Optical mapping of drug-induced polymorphic arrhythmias and torsade de pointes in the isolated rabbit heart. J. Am. Coll. Cardiol. 1997;29:831–842. doi: 10.1016/s0735-1097(96)00588-8. [DOI] [PubMed] [Google Scholar]
- 4.Choi B.R., Burton F., Salama G. Cytosolic Ca2+ triggers early afterdepolarizations and Torsade de Pointes in rabbit hearts with type 2 long QT syndrome. J. Physiol. 2002;543:615–631. doi: 10.1113/jphysiol.2002.024570. [DOI] [PMC free article] [PubMed] [Google Scholar]
- 5.Sato D., Xie L.H., Qu Z. Synchronization of chaotic early afterdepolarizations in the genesis of cardiac arrhythmias. Proc. Natl. Acad. Sci. USA. 2009;106:2983–2988. doi: 10.1073/pnas.0809148106. [DOI] [PMC free article] [PubMed] [Google Scholar]
- 6.Huffaker R.B., Weiss J.N., Kogan B. Effects of early afterdepolarizations on reentry in cardiac tissue: a simulation study. Am. J. Physiol. Heart Circ. Physiol. 2007;292:H3089–H3102. doi: 10.1152/ajpheart.01309.2006. [DOI] [PubMed] [Google Scholar]
- 7.Yan G.-X., Wu Y., Kowey P.R. Phase 2 early afterdepolarization as a trigger of polymorphic ventricular tachycardia in acquired long-QT syndrome: direct evidence from intracellular recordings in the intact left ventricular wall. Circulation. 2001;103:2851–2856. doi: 10.1161/01.cir.103.23.2851. [DOI] [PubMed] [Google Scholar]
- 8.Sanguinetti M.C., Jiang C., Keating M.T. A mechanistic link between an inherited and an acquired cardiac arrhythmia: HERG encodes the IKr potassium channel. Cell. 1995;81:299–307. doi: 10.1016/0092-8674(95)90340-2. [DOI] [PubMed] [Google Scholar]
- 9.Sanguinetti M.C., Tristani-Firouzi M. hERG potassium channels and cardiac arrhythmia. Nature. 2006;440:463–469. doi: 10.1038/nature04710. [DOI] [PubMed] [Google Scholar]
- 10.Antzelevitch C., Nesterenko V.V., Yan G.X. Role of M cells in acquired long QT syndrome, U waves, and torsade de pointes. J. Electrocardiol. 1995;28(Suppl):131–138. doi: 10.1016/s0022-0736(95)80038-7. [DOI] [PubMed] [Google Scholar]
- 11.Clancy C.E., Tateyama M., Kass R.S. Insights into the molecular mechanisms of bradycardia-triggered arrhythmias in long QT-3 syndrome. J. Clin. Invest. 2002;110:1251–1262. doi: 10.1172/JCI15928. [DOI] [PMC free article] [PubMed] [Google Scholar]
- 12.Li G.R., Lau C.P., Nattel S. Transmural action potential and ionic current remodeling in ventricles of failing canine hearts. Am. J. Physiol. Heart Circ. Physiol. 2002;283:H1031–H1041. doi: 10.1152/ajpheart.00105.2002. [DOI] [PubMed] [Google Scholar]
- 13.Pogwizd S.M., Bers D.M. Cellular basis of triggered arrhythmias in heart failure. Trends Cardiovasc. Med. 2004;14:61–66. doi: 10.1016/j.tcm.2003.12.002. [DOI] [PubMed] [Google Scholar]
- 14.January C.T., Riddle J.M. Early afterdepolarizations: mechanism of induction and block. A role for L-type Ca2+ current. Circ. Res. 1989;64:977–990. doi: 10.1161/01.res.64.5.977. [DOI] [PubMed] [Google Scholar]
- 15.January C.T., Riddle J.M., Salata J.J. A model for early afterdepolarizations: induction with the Ca2+ channel agonist Bay K 8644. Circ. Res. 1988;62:563–571. doi: 10.1161/01.res.62.3.563. [DOI] [PubMed] [Google Scholar]
- 16.Huelsing D.J., Spitzer K.W., Pollard A.E. Electrotonic suppression of early afterdepolarizations in isolated rabbit Purkinje myocytes. Am. J. Physiol. Heart Circ. Physiol. 2000;279:H250–H259. doi: 10.1152/ajpheart.2000.279.1.H250. [DOI] [PubMed] [Google Scholar]
- 17.Song Y., Shryock J.C., Belardinelli L. Blocking late sodium current reduces hydrogen peroxide-induced arrhythmogenic activity and contractile dysfunction. J. Pharmacol. Exp. Ther. 2006;318:214–222. doi: 10.1124/jpet.106.101832. [DOI] [PubMed] [Google Scholar]
- 18.Song Y., Shryock J.C., Belardinelli L. An increase of late sodium current induces delayed afterdepolarizations and sustained triggered activity in atrial myocytes. Am. J. Physiol. Heart Circ. Physiol. 2008;294:H2031–H2039. doi: 10.1152/ajpheart.01357.2007. [DOI] [PubMed] [Google Scholar]
- 19.Xie L.-H., Chen F., Weiss J.N. Oxidative stress-induced afterdepolarizations and calmodulin kinase II signaling. Circ. Res. 2009;104:79–86. doi: 10.1161/CIRCRESAHA.108.183475. [DOI] [PMC free article] [PubMed] [Google Scholar]
- 20.Gilmour R.F., Jr., Moise N.S. Triggered activity as a mechanism for inherited ventricular arrhythmias in German shepherd dogs. J. Am. Coll. Cardiol. 1996;27:1526–1533. doi: 10.1016/0735-1097(95)00618-4. [DOI] [PubMed] [Google Scholar]
- 21.Song Y., Thedford S., Belardinelli L. Adenosine-sensitive afterdepolarizations and triggered activity in guinea pig ventricular myocytes. Circ. Res. 1992;70:743–753. doi: 10.1161/01.res.70.4.743. [DOI] [PubMed] [Google Scholar]
- 22.Tanskanen A.J., Greenstein J.L., Winslow R.L. The role of stochastic and modal gating of cardiac L-type Ca2+ channels on early after-depolarizations. Biophys. J. 2005;88:85–95. doi: 10.1529/biophysj.104.051508. [DOI] [PMC free article] [PubMed] [Google Scholar]
- 23.Saucerman J.J., Healy S.N., McCulloch A.D. Proarrhythmic consequences of a KCNQ1 AKAP-binding domain mutation: computational models of whole cells and heterogeneous tissue. Circ. Res. 2004;95:1216–1224. doi: 10.1161/01.RES.0000150055.06226.4e. [DOI] [PubMed] [Google Scholar]
- 24.Alonso-Atienza F., Requena-Carrion J., Jalife J. Action potential alternans in LQT3 syndrome: a simulation study. Conf. Proc. IEEE Eng. Med. Biol. Soc. 2007;2007:640–643. doi: 10.1109/IEMBS.2007.4352371. [DOI] [PubMed] [Google Scholar]
- 25.Tran D.X., Sato D., Qu Z. Bifurcation and chaos in a model of cardiac early afterdepolarizations. Phys. Rev. Lett. 2009;102:258103. doi: 10.1103/PhysRevLett.102.258103. [DOI] [PMC free article] [PubMed] [Google Scholar]
- 26.Goldhaber J.I., Xie L.H., Weiss J.N. Action potential duration restitution and alternans in rabbit ventricular myocytes: the key role of intracellular calcium cycling. Circ. Res. 2005;96:459–466. doi: 10.1161/01.RES.0000156891.66893.83. [DOI] [PubMed] [Google Scholar]
- 27.Mahajan A., Shiferaw Y., Weiss J.N. A rabbit ventricular action potential model replicating cardiac dynamics at rapid heart rates. Biophys. J. 2008;94:392–410. doi: 10.1529/biophysj.106.98160. [DOI] [PMC free article] [PubMed] [Google Scholar]
- 28.Fox R.F. Stochastic versions of the Hodgkin-Huxley equations. Biophys. J. 1997;72:2068–2074. doi: 10.1016/S0006-3495(97)78850-7. [DOI] [PMC free article] [PubMed] [Google Scholar]
- 29.Gillespie D.T. Exact stochastic simulation of coupled chemical reactions. J. Phys. Chem. 1977;81:2340–2361. [Google Scholar]
- 30.Ward C.A., Giles W.R. Ionic mechanism of the effects of hydrogen peroxide in rat ventricular myocytes. J. Physiol. 1997;500:631–642. doi: 10.1113/jphysiol.1997.sp022048. [DOI] [PMC free article] [PubMed] [Google Scholar]
- 31.Hilborn R.C. Oxford University Press; New York: 1994. Chaos and Nonlinear Dynamics. [Google Scholar]
- 32.Xie Y., Hu G., Qu Z. Dispersion of refractoriness and induction of reentry due to chaos synchronization in a model of cardiac tissue. Phys. Rev. Lett. 2007;99:118101. doi: 10.1103/PhysRevLett.99.118101. [DOI] [PubMed] [Google Scholar]
- 33.Crutchfield J.P., Farmer J.D., Huberman B.A. Fluctuations and simple chaotic dynamics. Phys. Rep. 1982;92:45–82. [Google Scholar]
- 34.Gao J.B., Hwang S.K., Liu J.M. When can noise induce chaos? Phys. Rev. Lett. 1999;82:1132–1135. [Google Scholar]
- 35.Lai Y.C., Liu Z., Schwartz I.B. Noise-induced unstable dimension variability and transition to chaos in random dynamical systems. Phys. Rev. E Stat. Nonlin. Soft Matter Phys. 2003;67:026210. doi: 10.1103/PhysRevE.67.026210. [DOI] [PubMed] [Google Scholar]
- 36.Billings L., Schwartz I.B. Exciting chaos with noise: unexpected dynamics in epidemic outbreaks. J. Math. Biol. 2002;44:31–48. doi: 10.1007/s002850100110. [DOI] [PubMed] [Google Scholar]
- 37.Kim M.-Y., Aguilar M., Glass L. Stochastic and spatial influences on drug-induced bifurcations in cardiac tissue culture. Phys. Rev. Lett. 2009;103:058101. doi: 10.1103/PhysRevLett.103.058101. [DOI] [PubMed] [Google Scholar]
- 38.Garfinkel A., Spano M.L., Weiss J.N. Controlling cardiac chaos. Science. 1992;257:1230–1235. doi: 10.1126/science.1519060. [DOI] [PubMed] [Google Scholar]
- 39.Chialvo D.R., Gilmour R.F., Jalife J. Low dimensional chaos in cardiac tissue. Nature. 1990;343:653–657. doi: 10.1038/343653a0. [DOI] [PubMed] [Google Scholar]
- 40.Watanabe M., Otani N.F., Gilmour R.F. Biphasic restitution of action potential duration and complex dynamics in ventricular myocardium. Circ. Res. 1995;76:915–921. doi: 10.1161/01.res.76.5.915. [DOI] [PubMed] [Google Scholar]
- 41.Qu Z., Shiferaw Y., Weiss J.N. Nonlinear dynamics of cardiac excitation-contraction coupling: an iterated map study. Phys. Rev. E Stat. Nonlin. Soft Matter Phys. 2007;75:011927. doi: 10.1103/PhysRevE.75.011927. [DOI] [PubMed] [Google Scholar]
- 42.Bien H., Yin L., Entcheva E. Calcium instabilities in mammalian cardiomyocyte networks. Biophys. J. 2006;90:2628–2640. doi: 10.1529/biophysj.105.063321. [DOI] [PMC free article] [PubMed] [Google Scholar]
- 43.Hopenfeld B. Mechanism for action potential alternans: the interplay between L-type calcium current and transient outward current. Heart Rhythm. 2006;3:345–352. doi: 10.1016/j.hrthm.2005.11.016. [DOI] [PubMed] [Google Scholar]
- 44.Maoz A., Krogh-Madsen T., Christini D.J. Instability in action potential morphology underlies phase 2 reentry: a mathematical modeling study. Heart Rhythm. 2009;6:813–822. doi: 10.1016/j.hrthm.2009.02.043. [DOI] [PubMed] [Google Scholar]
- 45.Weiss J.N., Garfinkel A., Chen P.S. Chaos and the transition to ventricular fibrillation: a new approach to antiarrhythmic drug evaluation. Circulation. 1999;99:2819–2826. doi: 10.1161/01.cir.99.21.2819. [DOI] [PubMed] [Google Scholar]
Associated Data
This section collects any data citations, data availability statements, or supplementary materials included in this article.