

Abstract
Progress in uncovering the reaction networks that underlie important cell functions is laying the groundwork for quantitative identification of protein-interaction pathways. Since direct measurement of rate constants is not always feasible, the parameters are often inferred from multiple pieces of data using kinetic analyses based on appropriate mathematical models. The success of this approach relies on the sufficiency of available experimental data for a unique parameterization of the network. The concept of a rate-limiting step is applied to the analysis of experimental data that are usually used to quantify a pathway of actin dendritic nucleation, the Arp2/3-mediated mechanism that enables rapid changes of cell shape in response to external cues. The method yields analytical descriptions of the dynamics of polymerized actin and provides insights into how the experimental curves should be analyzed. It is shown that dynamics measured by pyrene-labeled actin assays with varying Arp2/3 concentrations are equally well described by two different rate-limiting steps: 1), binding of a nucleating complex to the side of a preexisting filament; or 2), its subsequent activation. To distinguish between the alternatives, we propose experiments with varying concentrations of actin monomers, taking advantage of the fact that the number of branches in the two cases depends differently on the initial monomer concentration. The idea is tested by simulating the proposed experiments with the use of spatial stochastic modeling.
Introduction
A cell's ability to dynamically change its shape and migrate in response to chemical signals often relies on rapid remodeling of the actin cytoskeleton near the cell membrane (1–3). Similar mechanisms are initiated by some pathogens to rapidly polymerize the actin comet tails that propel them inside a host cell (4). The steep kinetics of the induced actin polymerization is indicative of the autocatalytic nature of the underlying processes. One such mechanism is actin dendritic nucleation mediated by actin-related protein 2/3 (Arp2/3) (5,6). Although several proteins are able to nucleate actin filaments, Arp2/3 is unique in that it anchors a new actin branch to the side of a preexisting filament (6–9). The rate of nucleation in this mechanism is an increasing function of the amount of the existing filamentous actin, resulting in a positive feedback that determines the autocatalytic character of the process.
Over the past decade, experimental studies have identified reactions involved in actin dendritic nucleation (5–7,10,11). A likely structure of the dendritic nucleation pathway (7,10) includes three major steps (Fig. 1). First, Arp2/3 is biochemically activated by forming a ternary complex with a nucleating promoting factor (NPF) and an actin monomer. NPFs, such as proteins of the WASp/Scar family, can bind both Arp2/3 and actin monomers, and therefore act as adaptors in bringing the partners together (2,7,12). Experiments with NPF immobilized on beads indicate that NPFs eventually recycle after nucleation. The second step in the pathway is binding of the ternary complex to a preexisting filament. This binding event could be viewed as a nucleation step, but a lack of correlation between the affinities of NPF mutants for actin and Arp2/3 and their ability to activate actin nucleation led researchers to believe that nucleation must involve a further activation step subsequent to binding (step 3). In a recent study (9), tomographic reconstruction of the branch junction revealed significant conformational changes in both the Arp2/3 complex and the mother filament. It is conceivable that these changes occur during the final activation step after the binding event.
Figure 1.
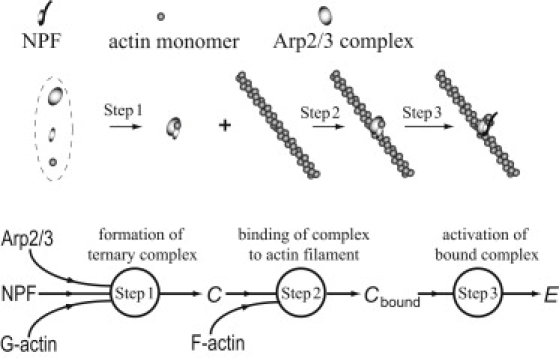
Reaction scheme of the actin dendritic nucleation pathway (notation: C, ternary complex; Cbound, complex bound to a filament; E, barbed end).
Direct biochemical measurements have been used to characterize reactions involved in the dendritic nucleation pathway. Both equilibrium and kinetic reaction constants were measured for the binding of NPF to actin and Arp2/3 (7,10). In a recent study (10), measurements using spectroscopic assays with pyrene-labeled Arp2/3 showed that the binding of Arp2/3 to actin filaments is extremely slow and only weakly affected by NPF bound to Arp2/3. However, even with pyrene-labeled Arp2/3, it has proved challenging to measure rate constants for the reaction between the actin filament and the ternary complex consisting of Arp2/3, NPF, and actin monomer because of possible indirect effects of other reactions in the system. Given these challenges, it is not uncommon to employ modeling analyses of F-actin dynamics to constrain the rate constants of the reactions involved in the network (5,10,11,13–15). A critical issue for the success of this approach is whether the available data are sufficient to enable unambiguous determination of the reaction parameters, and if not, what additional information is needed for conclusive parameterization of the pathway.
In this study, we analyze experimental data obtained with pyrene-labeled actin assays (5,10,11). The idea is to determine whether the data are consistent with the presence of a rate-limiting step in the network. This step is much slower than other reactions in the pathway and thus determines its overall timescale. The approach allows for analytical description of the actin polymerization kinetics under various conditions and provides insights into the characteristics of fluorescence curves that would manifest the presence of a particular rate-limiting step. Note that the pathway involves binary reactions, and therefore the experimental conditions, such as the initial concentrations of the components, may determine which reaction will be rate-limiting (this can be used to measure the rate constants of an individual reaction step by arranging the conditions in which the reaction becomes rate-limiting). It is also important to bear in mind that in such pathways, different reactions can be rate-limiting at different stages of the process.
We found that the data obtained in the experiments with the pyrene-labeled actin assays are described equally well by two possible rate-limiting steps: the binding of the ternary complex to an actin filament (step 2) or the subsequent activation (step 3). Therefore, constraining parameters of the dendritic nucleation pathway by these data is inconclusive. To distinguish between the possibilities, we propose experiments with varying initial concentrations of actin monomers. The experiments need to be performed under conditions that can accommodate the spontaneous formation of aster-like actin structures, which were recently observed (16,17) and analyzed (17,18). For these conditions, the two limiting steps will result in qualitatively different dependences of F-actin density on the initial concentration of actin monomers.
A comparative analysis of the data obtained with and without NPFs allowed us to quantify the effect of NPF on the kinetic parameters of the pathway. We also show that the results of Pantaloni et al. (11), which were previously interpreted as evidence of the barbed-end nucleation, can be explained equally well within the paradigm of the side-branching mechanism.
Materials and Methods
Experimental data
We analyzed three published data sets for polymerized actin as a function of time (5,10,11). All three studies used similar pyrene-labeled actin assays; however, there were important differences in the experimental conditions, as summarized in Table 1.
Table 1.
Experimental conditions in previous studies (5,10,11)
Note that the initial monomer concentration used by Pantaloni et al. (11) is significantly lower than those used by Mullins et al. (5) and Beltzner and Pollard (10). As a result, the rates of spontaneous filament nucleation from monomers vary significantly, as is evident from the dynamics in the absence of Arp2/3 (see Fig. 5 A in Beltzner and Pollard (10), Fig. 1 A in Pantaloni et al. (11), and Fig. 2 A in Mullins et al. (5)). Also, the data in the original study by Mullins et al. (5) were obtained in the absence of nucleation-promoting factors (but using preformed gelsolin-actin dimers and elevated Arp2/3 concentrations), in contrast to the later studies by Pantaloni et al. (11) and Beltzner and Pollard (10).
The data sets subjected to analysis are shown in Table 2. They were obtained by scanning the published plots for times corresponding to selected levels of the polymerized actin. The autocatalytic processes in these experiments turn on relatively early because of the sufficiently high levels of Arp2/3, allowing for a simplified description of spontaneous nucleation of filaments from monomers (see next section for details).
Table 2.
Experimental data sets: polymerization time (in seconds) of particular amounts of actin in the presence of specified concentrations of Arp2/3
|
A. Beltzner and Pollard (10) | |||||||||
|---|---|---|---|---|---|---|---|---|---|
| [Arp2/3], μM | F-actin levels, μM |
||||||||
| 0 | 0.5 | 1.0 | 2.0 | 3.0 | 3.5 | 3.8 | 3.81 | ||
| 0.01 | Time in seconds | 0 | 193 | 257 | 386 | 514 | 629 | 871 | 1000 |
| 0.02 | 0 | 179 | 229 | 321 | 400 | 471 | 586 | 1000 | |
| 0.05 | 0 | 171 | 207 | 264 | 321 | 357 | 414 | 500 | |
| 0.1 | 0 | 143 | 171 | 214 | 250 | 275 | 328 | 500 | |
|
B. Mullins et al. (5) | ||||||||
|---|---|---|---|---|---|---|---|---|
| [Arp2/3], μM | F-actin levels, μM |
|||||||
| 0 | 1.0 | 2.0 | 3.0 | 4.0 | 5.0 | 5.2 | ||
| 0.15 | Time in seconds | 0 | 194 | 306 | 435 | 620 | 1101 | 2500 |
| 0.58 | 0 | 156 | 241 | 333 | 444 | 769 | 2500 | |
| 2.3 | 0 | 133 | 185 | 231 | 296 | 417 | 2500 | |
|
C. Pantaloni et al. (11) | ||||||||||
|---|---|---|---|---|---|---|---|---|---|---|
| [Arp2/3], μM | F-actin levels, μM |
|||||||||
| 0 | 0.2 | 0.51 | 1.01 | 1.51 | 2.0 | 2.2 | 2.3 | 2.37 | ||
| 0.0071 | Time in seconds | 0 | 328 | 409 | 489 | 569 | 696 | 803 | 910 | 1300 |
| 0.0143 | 0 | 269 | 319 | 370 | 420 | 504 | 555 | 613 | 1000 | |
| 0.0285 | 0 | 193 | 227 | 260 | 298 | 344 | 370 | 395 | 1000 | |
Model
The experimental data were analyzed using a well-mixed model formulated in terms of time-dependent concentrations of Arp2/3, A; actin monomers, G; polymerized actin, F; free ternary monomer complex, C; ternary complex bound to the filament, Cbound; and growing (barbed) ends, E. The pathway of Fig. 1 then translates into the following set of rate equations:
| (1) |
These are supplemented by the mass conservation relationships and , where G0, A0, and F0 are the initial concentrations of actin monomers, Arp2/3, and F-actin, respectively, and , where is the concentration of seed filaments and L0 is their average length in units of a monomer length δ ≈ 2.5 nm. The reaction rates on the right-hand side of Eq. 1 are modeled as described below.
In the absence of NPF, the rate of formation of the Arp2/3-actin monomer complex, Jcomplex_on, is governed by mass-action kinetics, . Because the nucleation-promoting factors facilitate interactions between Arp2/3 and actin monomers, one can use the same kinetic law, but with an effective kon, to approximate the formation of a ternary complex in the presence of NPF. In this description, the NPF concentration does not enter Eq. 1 explicitly. The approximation is satisfactory for sufficiently large concentrations of NPF, such as those used in the experiments (see Supporting Material for quantitative justification).
If binding of the ternary complex to actin filaments is slow, formation of the complex is counterbalanced by its decay, . Other reaction steps in the pathway can be modeled as irreversible because the reverse reactions, which are likely to be slow (7), can be ignored for relatively short times during which the pool of actin monomers is exhausted (the effects of actin hydrolysis, depolymerization, and debranching can also be neglected on this timescale). Again, the kinetic law of mass action yields , , and . Note that according to a side-branching mechanism, Jbinding is assumed to be proportional to the number of free binding sites on the filaments.
Spontaneous nucleation of filaments from monomers is taken into account through a nonzero initial concentration of growing ends, . In this interpretation, includes an equivalent number of seeds that are spontaneously nucleated from monomers. The approximation is reasonably accurate when applied to experiments with sufficiently large amounts of Arp2/3. In such experiments, the number of spontaneously nucleated seeds stabilizes quickly, as free monomers are rapidly consumed by a large number of growing ends nucleated by Arp2/3. Results obtained with this approximation compare well with values yielded by a more detailed description of the spontaneous nucleation of seeds from monomers.
Methods
The results shown in Figs. 2–5 were obtained by solving Eq. 1 numerically. The model was implemented in VCell (22,23) and solved with IDA solver (variable order, variable time step), with a minimum integration time step of 10−4 s and the relative error tolerance set at 1e-9. The VCell model and simulation results can be accessed by logging into VCell (www.vcell.org) and going to the shared (public) math models: the models Actin_Polymerization and NPF_ARP2/3_Actin are in the pavelkr folder. In the model, the initial concentrations of actin monomers and Arp2/3, G0 and A0, were the same as in the experiments, whereas the initial values of C and Cbound were set to zero. The results in Figs. 2–4 were obtained with (in units of monomer length). Simulations were performed with end times of ∼103 s, with the outputs stored at 10-s intervals. Optimal fits were found by executing multiple runs with varying rate constants of a rate-limiting step and E0. By assumption, the parameters of other reactions were sufficiently large and therefore had little effect on the simulation output.
Figure 2.
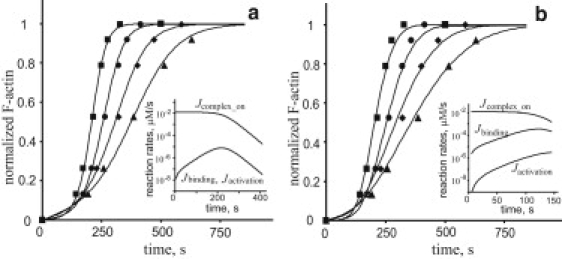
Experimental data of Beltzner and Pollard (10) are fitted well assuming different limiting steps. Experimental results (symbols) and numerical solutions of Eq. 1 (curves) are shown for the following Arp2/3 concentrations (Table 2A): A0 = 100 nM (squares); 50 nM (circles); 20 nM (diamonds); 10 nM (triangles). (a) Simulations of nucleation kinetics limited by step 2: kbind = 4.5 × 10⁻⁴μM−1s−1, kon = 0.25 μM−1s−1, koff = kact = 1 s−1; E0 is a decreasing function of A0: E0 = 12, 18, 40, and 48 pM for A0=100, 50, 20, and 10 nM, respectively; (b) simulations of nucleation kinetics limited by step 3, kact = 1.45 × 10⁻⁴μM−1s−1, kon = kbind = 0.25 μM−1s−1, koff = 1 s−1, and E0 = 5.6, 6, 28, and 40 pM for A0 = 100, 50, 20, and 10 nM, respectively. In all simulations, kp = 10 μM−1s−1. Insets: Log-scale plots of Jcomplex_on, Jbinding, and Jactivation illustrate the presence of a rate-limiting step in the simulated kinetics.
Figure 3.

Fitting of the data reported by Mullins et al. (5) (Table 2B). Experimental data (symbols) are fitted by numerical solutions (curves) obtained with the following parameter sets: (a) for the nucleation limited by step 2, kbind = 4.5 × 10⁻⁴μM−1s−1, kon = 4.15 × 10⁻⁵μM−1s−1, koff = 0.05 s−1, and kact = 1 s−1; and (b) for the nucleation limited by step 3, kact =1.45 × 10⁻⁴ s−1, kon = 1.3 × 10⁻⁵μM−1s−1, koff = 0, and kbind = 0.25 μM−1s−1. In both cases, E0 = 0.16 nM and kp = 10 μM−1s−1.
Figure 4.
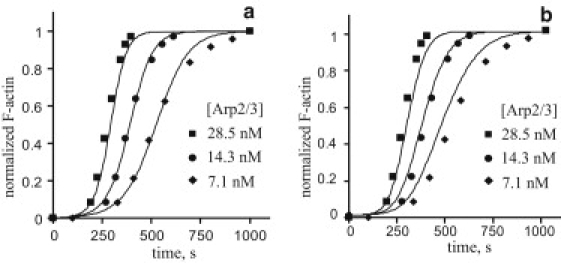
Fitting of the data reported by Pantaloni et al. (11) (Table 2C). Experimental data (symbols) are fitted by numerical solutions (curves) obtained with the following parameter sets: (a) for nucleation limited by step 2, kbind = 2 × 10⁻³μM−1s−1, kon = 0.25 μM−1s−1 and koff = kact =1 s−1, E0 = 5 pM, (b) for nucleation limited by step 3, kact = 3.5 × 10⁻⁴ s−1, kon = kbind = 0.25 μM−1s−1, koff = 1 s−1, E0 = 2.5 pM. In both cases, kp = 10 μM−1s−1.
Figure 5.
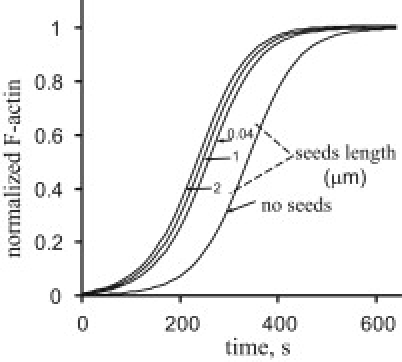
Simulation of side branching nucleation in the presence of preformed seeds yields F-actin dynamics that are largely independent of seed lengths. As in the experiments by Pantaloni et al. (11), 25 pM of preformed seeds with the specified lengths were added to 5 pM of 25-nm seeds spontaneously nucleated from monomers. The model (Eq. 1) assumed the side branching nucleation limited by binding of the nucleating complex to a filament (step 2). The following parameters were used in the simulations: G0 = 2.5 μM, A0 = 17 nM, kp = 10 μM−1s−1, kbind = 2 × 10⁻³μM−1s−1, kon = 0.25 μM−1s−1, and kact = koff = 1 s−1. Parameters E0 and L0 (in units of the monomer length) were E0 = 5 pM and L0 = 10, for no preformed seeds; E0 = 30 pM and L0 = 15, for preformed seeds of length L = 0.04 μm; E0 = 30 pM and L0 = 335, for L = 1 μm; and E0 = 30 pM and L0 = 668, for L = 2 μm.
Distributions of polymerized actin in a two-dimensional (2D) aster (Fig. 6) were simulated stochastically. The spatial stochastic simulations were performed as described previously (18), using transition probability rates for the following events: polymerization step (binding of a monomer to a barbed end of the filament), formation of a ternary complex, binding of the ternary complex to an actin filament, and subsequent activation of the ternary complex. These probability rates directly relate to the deterministic reaction rates in Eq. 1.
Figure 6.
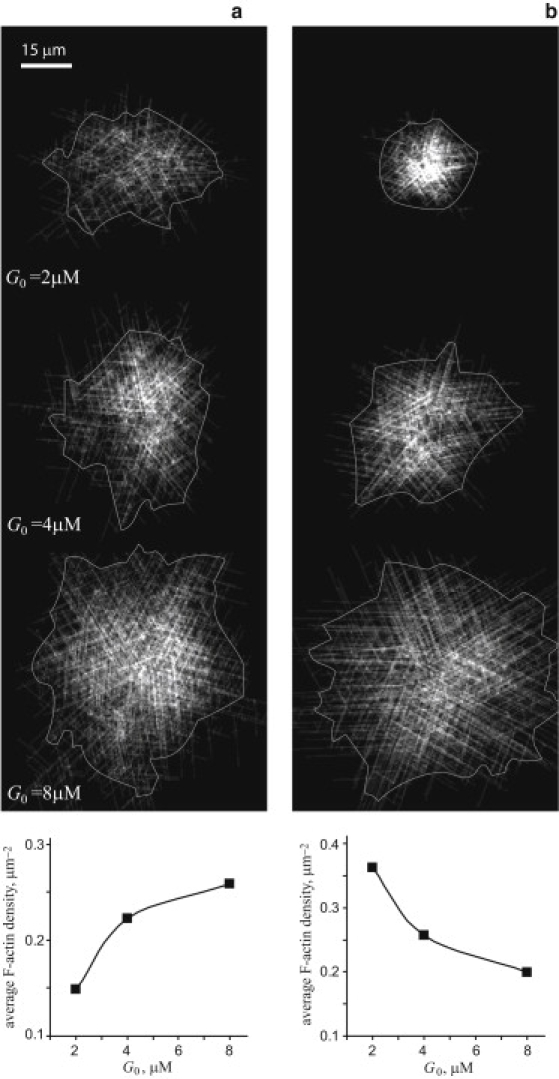
Spatial stochastic simulations of actin asters yield qualitatively different dependences of F-actin density on the initial G-actin concentration for two rate-limiting steps: (a) binding of the nucleation complex to a filament, kbind = 4.5 × 10⁻⁴μM−1s−1, kon = 0.25 μM−1s−1, koff = kact = 1 s−1, E0 = 12 pM; and (b) activation of the bound complex, kact = 1.7 × 10⁻⁴ s−1, kbind = kon = 0.25 μM−1s−1, koff = 1 s−1, E0 = 5.6 pM. In both cases, A0 = 0.1 μM, kp = 10 μM−1s−1 and L0 = 25 nm. The snapshots demonstrate simulated distributions of F-actin in the aster obtained upon depletion of monomers. The corresponding average densities measured for the delineated areas (see Materials and Methods for details) are plotted as functions of the initial monomer concentration.
Actin filaments were modeled as 2D vectors with origins fixed at the positions of the activated ternary complexes. Bound complexes were simulated as point-like particles. In a realization of the binding event, the site of binding of the ternary complex was determined by 1), randomly choosing a preexisting filament in proportion to its length; and 2), randomly selecting on that filament a location unoccupied by other complexes. A new filament, generated upon activation of the bound complex, formed a 70° angle with the mother filament. Because free molecules diffuse rapidly, we monitored only the total numbers of free monomers, Arp2/3, and unbound ternary complexes, without tracking their spatial locations.
All simulations were run with a fixed time step (.5 μs). In advancing the system in time, no more than one event per time step was realized. Random number generation was used to determine which of the four events would occur during the time step, or whether the system would remain unchanged. More details about the method and its validation can be found in the Appendix to Kraikivski et al. (18) at http://www.aip.org/pubservs/epaps.html, document No. E-PRLTAO-101-024839.
A final distribution of F-actin, obtained upon depletion of monomers, was visualized in the following way: The simulated area was partitioned into 2.5 × 10⁷ square subvolumes with a linear size of 10 monomer lengths. Each subvolume was assigned a value equal to the number of filaments that crossed it (our tests showed that this is a sufficiently accurate method to measure local amounts of F-actin). As a result, the F-actin distribution was mapped to a 5000 × 5000 matrix with matrix indexes corresponding to an x-y grid. Standard MATLAB (The MathWorks, Natick, MA) image functions were then used to convert the matrix into a grayscale image.
As in the analysis of real experiments, F-actin densities in the aster were characterized by the fluorescence intensities (pixel values) of the image. The latter, measured in arbitrary units (a.u.) using ImageJ software, were proportional to simulated amounts of F-actin, with one unit representing 2.4 × 10⁴ monomers. After all the data were normalized by a maximum pixel value 255 a.u., the average F-actin densities (in μm−2) were obtained for areas shown in the snapshots of Fig. 6 and plotted as functions of the initial concentration of monomers. The areas were delineated with the use of Photoshop, first by applying the Gaussian filter with a 3.5-pixel radius to blur the image, and then by thresholding it with a cutoff set at 10 a.u.
Results
Pyrene-labeled actin data can be interpreted in terms of two different rate-limiting steps
To determine whether the experimental results (Table 2) are sufficient for unambiguous parameterization of the nucleation pathway, we attempt to approximate the data on the assumption that the pathway includes a rate-limiting step.
We first analyze the results of Beltzner and Pollard (10), which were obtained in the presence of NPF and with a relatively large initial concentration of monomers (Table 1). For these conditions, according to the biochemical studies (7,10), the formation of the ternary complex (step 1 of the dendritic nucleation pathway; Fig. 1) is unlikely to be rate-limiting. Our analysis of the actin polymerization data (Table 2 A) supports this assertion. Indeed, let us assume that step 1 is rate-limiting. Equation 1, simplified on this assumption, can be solved analytically (see Supporting Material for derivation). Because binding of the complex to a filament (step 2) is assumed to be fast, the time dependence of F-actin is not very sensitive to E0 (so long as E0 is nonzero) and can be approximated by a one-parameter function: , with the characteristic time defined as . An important corollary is that for any given F, the corresponding times should scale with the amount of Arp2/3 as. However, the actual times t(F) (Table 2 A) required for polymerizing a certain amount of actin F are described by a power law with a varying scaling exponent α(F), which for intermediate F is between 0.24 and 0.35 (Fig. S1 in the Supporting Material). This discrepancy indicates that no accurate fits can be found, assuming that the pathway is limited by step 1.
We then test whether the nucleation can be limited by binding of the complex to the side of a preexisting filament (step 2 in Fig. 1). Assuming that all other steps in the nucleation pathway are fast, the system of Eq. 1 can again be solved analytically, yielding a two-parameter function: . Parameter τ determines the steepness of a rising segment of the curve and is predicted to scale with the amount of Arp2/3 as : . Parameter t1/2 is the time at which the polymerized actin reaches half maximum, and it includes a waiting time that depends on the number of seed filaments that are nucleating spontaneously from monomers: (see Supporting Material for derivation). Note that a similarly defined polymerization half-time was used by Dueber et al. (19) as a metric for quantifying NPF activity in N-WASP switching assays.
Fitting the experimental data with the two-parameter function indeed produces accurate results and yields. Numerical simulations with the full model (Eq. 1), using parameter sets such that step 2 is by far the slowest reaction in the pathway, yield a good fit with kbind = 4.5 × 10⁻⁴ μM−1s−1 (Fig. 2 a), which is similar to the 1.5 × 10⁻⁴ μM−1s−1 value used by Beltzner and Pollard (10). The concentration of spontaneously formed seeds, , is found to be a decreasing function of . This is expected, since the nucleation of seeds from monomers in experiments with larger concentrations of Arp2/3 will stop at earlier times. In these simulations and throughout the study, the polymerization rate constant is kp = 10 μM−1s−1 (20,21). The remaining parameters are set to sufficiently large values, kon = 1/ (4 μM s) = 0.25 μM−1s−1 and koff = kact =1 s−1, so that the overall nucleation rate is limited by step 2 (inset in Fig. 2 a). However, these parameters are not tightly constrained in this case, since their variations on such scales do not affect the results in any significant way.
Thus, the data are fitted well when they are assumed to be limited by step 2 and the corresponding binding constant is close to the one measured with the Arp2/3 binding assays (10). This may suggest that the ternary complex and the unbound Arp2/3 interact with actin filaments similarly, an assumption adopted by Beltzner and Pollard (10). However, it is also possible that the binding of the ternary complex to the filament is much faster but is followed by a slow activation step. We test this possibility by solving Eq. 1 with varying kact and E0, while assigning sufficiently large values to the parameters of other reactions: kon = kbind =1/(4 μM s) = 0.25 μM−1s−1 and koff = 1 s−1. A reasonable fit is found for kact = 1.45 × 10⁻⁴ s−1, and E0 again is a decreasing function of A0 with values in a 10-pM range (Fig. 2 b). The reaction rates shown in the inset of Fig. 2 b demonstrate that step 3 is indeed rate-limiting under these conditions. We therefore conclude that the data can be interpreted in terms of two different limiting steps and fitted equally well by different parameter sets.
Analyses of the other two data sets lead to the same conclusion (see Figs. 3 and 4 below). Overall, the data of Table 2 are insufficient for a unique parameterization of the dendritic nucleation pathway. In the concluding part of the Results, we propose experiments that can distinguish between the two alternatives.
Quantifying the effect of NPF
The data of Mullins et al. (5) (Table 2 B) were obtained in the absence of nucleation-promoting factors. This should slow down formation of the complex, and as a result there may be two slow steps in the pathway. We first explore a scenario in which these steps are the formation of the Arp2/3-actin monomer complex (step 1) and its binding to the actin filament (step 2). For sufficiently large Arp2/3 concentrations, an approximate analytical solution yields with (see Supporting Material for derivation). The times corresponding to intermediate levels of F-actin in Table 2 B indeed scale with A0 as , with α(F) in the tight interval (0.18, 0.27) covering the predicted value 0.25 (Fig. S2). It is easy to verify that fitting the data with the analytically derived formula (which, as expected, is more accurate for larger concentrations of Arp2/3 (2.3 and 0.58 μM)) yields.
Fitting with the full model of Eq. 1 is achieved by using the binding-limited parameter set described in the previous section with the appropriately modified rate constants of step 1 and E0. The results in Fig. 3 a were obtained with kon = 4.15 × 10⁻⁵ μM−1s−1 and koff = 0.05 s−1, and the value kbind = 4.5 × 10⁻⁴ μM−1s−1 is the same as before. All curves are computed with E0 = 0.16 nM, which in this case is relatively large, likely due to the amount of seeds polymerized from preformed actin dimers that were present in the assays (5). It is tempting to estimate the effect of NPFs on the binding of Arp2/3 and actin monomers by comparing the kon values used in the fitting of the experiments with and without NPF. However, the value kon = 0.25 μM−1s−1 (Fig. 2 a) is not constrained by the data obtained in the presence of NPF. In fact, it had to be reduced to <0.0025 μM−1s−1 or by more than two orders of magnitude to produce noticeable changes in the simulation output. Also, NPF may impact not only kon but also kbind. Indeed, numerical experiments indicate that the data constrain the product, kon × kbind, and not the individual rate constants. Taking this into account, a comparative analysis of the data in Table 2, A and B, yields roughly a 50-fold combined effect of NPF on the product of the forward rate constants of the slow steps, kon × kbind.
Next we examine the possibility that the pathway is limited by steps 1 and 3, whereas the binding of the complex to a filament is fast. Accordingly, changes in the rate constants of step 1 and E0 are now made in the activation-limited parameter set described in the previous section. Because the irreversible binding in step 2 is fast, the decay of the complex in step 1 is likely to have little effect, so we set koff to zero. Multiple solutions are then found, as the data again constrain the product kon × kact rather than individual kon and kact. The solution shown in Fig. 3 b is obtained with kon = 1.3 × 10⁻⁵ μM−1s−1, and E0 = 0.16 nM, whereas kact has the same value 1.45 × 10⁻⁴ s−1 as in the previous section.
The results of Pantaloni et al. are consistent with a side-branching mechanism
In the experiments of Pantaloni et al. (11), the assays included NPFs but the concentration of actin monomers was low (Table 1). The authors interpreted their results in favor of the barbed-end branching mechanism, whereby the ternary complex presumably binds to the tips of the filaments rather than to their sides. Their main argument was that the results of experiments with preformed filaments are essentially independent of seed lengths (see Fig. 2 f in Pantaloni et al. (11)). In this section, we show that these experimental results can also be explained on the basis of a side-branching mechanism.
Like the previous data sets, the results of Table 2 C can be interpreted as being limited by either step 2 or step 3. The fit in Fig. 4 a is obtained using a binding-limited parameter set with kbind = 2 × 10⁻³ μM−1s−1 and E0 = 5 pM. The relatively small value of E0 is not surprising given the low concentration of actin monomers in the assays. This also scales down the dependence of E0 on A0, which is probably why the data in this case could be fitted with a single value of E0. The parameters of fast reactions are the same as in Fig. 2 a. Alternatively, the data can be fitted with an activation-limited parameter set. Fig. 4 b illustrates results obtained with kact = 3.5 × 10⁻⁴ s−1 and E0 = 2.5 pM; the fast parameters are the same as in the legend of Fig. 2 b.
The estimates of reaction rate constants, as described here and in preceding sections regarding the assumption of various rate-limiting steps, are summarized in Table 3.
Table 3.
Constraints for reaction rate constants obtained from fitting experimental data on assumption of various rate-limiting steps
| Data source Rate-limiting steps | Beltzner and Pollard (10) | Mullins et al. (5) | Pantaloni et al. (11) |
|---|---|---|---|
| Step 2 | kbind = 4.5 × 10⁻⁴μM−1s−1 | kbind = 2 × 10⁻³μM−1s−1 | |
| Steps 1 and 2 (no NPF) | kon × kbind = 2.0 × 10⁻⁸ (μM s)−2 | ||
| Step 3 | kact = 1.45 × 10⁻⁴ s−1 | kact = 3.5 × 10⁻⁴ s−1 | |
| Steps 1 and 3 (no NPF) | kact × kon = 2.0 × 10⁻⁹μM−1s−2 |
We now analyze the experiments with preformed seeds that were done with the same seed number density (25 pM) but different seed lengths (0.04, 1, and 2 μm; see Fig. 2 f of Pantaloni et al. (11)). The fact that the dynamics of the polymerized actin in the experiments were essentially independent of the seed length was interpreted as evidence in favor of the barbed-end nucleation. However, the side-branching mechanism limited by activation (step 3) is also insensitive to the seed length and therefore would yield similar results. Of interest, even if the side nucleation were limited by step 2, the results would not be sensitive to the seed length either, given the conditions of the experiment. Indeed, the expected length dependence is obscured by the high density of the seed filaments used in the experiments. The initial dynamics of F-actin under these conditions are dominated by polymerization at the barbed ends and therefore differ only slightly for varying seed lengths. Consequently, there are similar amounts of F-actin when the Arp2/3-mediated nucleation comes into effect, resulting in similar dynamics overall. We illustrate this effect by simulating the experiment of Pantaloni et al. (11) with the binding-limited parameter set as above, except for E0, which is set at 30 pM to account for the presence of seed filaments. The results in Fig. 5 are qualitatively similar to those in their Fig. 2 f. Thus, the findings of Pantaloni et al. are consistent with the side-branching mechanism.
How to distinguish between the two possible rate-limiting steps
We have shown that all three data sets (Table 2) can be interpreted assuming that the Arp2/3-mediated nucleation is limited either by binding of the ternary complex to a filament (step 2) or by subsequent activation (step 3). The question then arises as to how the two possible rate-limiting steps can be distinguished experimentally.
Recently, spontaneous formation of diffuse aster-like structures was observed in the experiments with bulk polymerization of actin in the presence of Arp2/3 and NPF (16,17). Simple analytical estimates indicate that the average density of F-actin in asters, measured as fluorescence intensity per unit area (volume), depends differently on the initial monomer concentration for the two rate-limiting steps. Indeed, when this density is measured soon after the pool of monomers is exhausted, it is proportional to G0 and inversely proportional to the aster area (volume): , where R∞ is the final linear size of the aster and d is the aster dimension (d = 2, for a quasi-2D aster, and d = 3 for a 3D aster). The final aster size can be estimated as . The integral in this equation is , where τ is the characteristic time of the process. For the nucleation limited by step 2, (see Supporting Material), and therefore R∞ is independent of G0. The average density of F-actin in the aster is then an increasing function of the initial monomer concentration. For the activation-limited case with A0 < G0, the number of branches do not strongly depend on G0 and the linear size of the aster grows roughly in proportion to G0. Therefore, the aster density in this case, , is a decreasing function of the initial concentration of monomers.
To test these analytical predictions, we performed spatial stochastic simulations of aster formation as described in Materials and Methods. The results presented in Fig. 6 were obtained for A0 = 0.1 μM and three different initial concentrations of monomers (G0 = 2, 4, and 8 μM) with the parameters used in fitting the data by Beltzner and Pollard (10). The snapshots in Fig. 6 represent simulated distributions of actin filaments in the aster obtained upon depletion of the monomers. The average F-actin densities in the delineated areas are plotted as functions of the initial concentration of monomers. Consistent with the predictions, the aster size in the case of the binding-limited nucleation depends weakly on G0, yielding an increasing F-actin density in the aster (Fig. 6 a). In contrast, if the nucleation is limited by the activation step, the aster size grows rapidly with G0, resulting in a decreasing average F-actin density (Fig. 6 b).
These results indicate that the rate-limiting step in the dendritic nucleation pathway can be identified by a series of experiments as described previously (16,17), performed with varying initial concentrations of monomers and a fixed concentration of Arp2/3. The readout is the average F-actin density in the aster soon after the monomer pool is exhausted, measured as a function of G0. The rate-limiting step can then be determined depending on whether this function is increasing or decreasing.
Discussion
Recent advances in experimental techniques are enabling researchers to decipher the topologies of the protein interaction networks that underlie various cell functions, and laying the groundwork for achieving a quantitative description of reaction pathways. However, direct experimental determination of rate constants is not always feasible, particularly in vivo. Reaction parameters are often inferred from multiple pieces of information about the dynamics of the system as a whole, using kinetic analyses based on appropriate mathematical models. A key issue with this approach is whether the available experimental data are sufficient for a unique parameterization of the network, and if not, what additional experimental measurements are required.
In this study, we address these questions in the context of actin dendritic nucleation, a mechanism that enables cells to change their shape and migrate. In extensive experimental studies of the Arp2/3-mediated nucleation pathway (5,7,10,11), individual reaction rates and overall polymerization kinetics of pyrene-labeled actin were measured. However, as we have shown here, even this information may not be sufficient to achieve a unique parameterization of the pathway. Specifically, we found that the data can be interpreted in terms of different rate-limiting steps, i.e., binding of the Arp2/3-NPF-monomer complex to a preexisting filament or subsequent activation. As a result, different parameter sets can describe the data equally well.
To distinguish between the two possibilities, we propose to take advantage of the fact that the rate of nucleation limited by the activation step is largely independent of the initial concentration of monomers G0, whereas the nucleation limited by binding of the nucleating complex to a filament occurs faster for larger G0. This yields qualitatively different dependences of the average F-actin density on the initial monomer concentration: an increasing one for the binding-limited nucleation, and a decreasing one if the nucleation is limited by the activation. One can measure the F-actin density using a previously described experimental setup in which aster-like structures of actin meshwork were observed (16).
The results of actin polymerization without NPF (5) are consistent with the presence of two slow steps in the nucleation pathway, one of which is the formation of the Arp2/3-actin monomer complex. In this case, the data constrain the product of the on-rate constants for the slow steps, rather than the individual parameters. A comparison of the results obtained with and without NPF yields a 50-fold combined effect of NPF on the product of the limiting rate constants. Another byproduct of this study is the finding that the side-branching mechanism results in polymerization dynamics that are largely insensitive to the lengths of the preformed seeds if the seed number density is sufficiently large (tens of picomolars). Therefore, the results of Pantaloni et al. (11), which were previously interpreted as evidence of barbed-end nucleation, are also consistent with the side-branching mechanism.
Finally, our study demonstrates that quantitative identification of a protein-interaction network, even for a simply connected pathway characterized by a wealth of experimental data, may not be an easy task. Parameter optimization can produce misleading results unless it is accompanied by a rigorous analysis of the sufficiency of the available data for a unique parameterization of the network. The latter is a nontrivial problem that can be tackled by applying the concept of a rate-limiting step, as was done in this work.
Acknowledgments
We thank Leslie Loew and Igor Novak for helpful discussions, and Frank Morgan for assistance with the image processing.
This work was supported by the National Institutes of Health through grants P41-RR13186, 1U54-RR022232, and 1U54-GM64346.
Contributor Information
Pavel Kraikivski, Email: kraikivski@gmail.com.
Boris M. Slepchenko, Email: boris@neuron.uchc.edu.
Supporting Material
References
- 1.Alberts B., Jonson A., Walter P. Garland Science; New York: 2002. Molecular Biology of the Cell. [Google Scholar]
- 2.Insall R.H., Machesky L.M. Actin dynamics at the leading edge: from simple machinery to complex networks. Dev. Cell. 2009;17:310–322. doi: 10.1016/j.devcel.2009.08.012. [DOI] [PubMed] [Google Scholar]
- 3.Svitkina T.M., Borisy G.G. Arp2/3 complex and actin depolymerizing factor/cofilin in dendritic organization and treadmilling of actin filament array in lamellipodia. J. Cell Biol. 1999;145:1009–1026. doi: 10.1083/jcb.145.5.1009. [DOI] [PMC free article] [PubMed] [Google Scholar]
- 4.Goley E.D., Welch M.D. The ARP2/3 complex: an actin nucleator comes of age. Nat. Rev. Mol. Cell Biol. 2006;7:713–726. doi: 10.1038/nrm2026. [DOI] [PubMed] [Google Scholar]
- 5.Mullins R.D., Heuser J.A., Pollard T.D. The interaction of Arp2/3 complex with actin: nucleation, high affinity pointed end capping, and formation of branching networks of filaments. Proc. Natl. Acad. Sci. USA. 1998;95:6181–6186. doi: 10.1073/pnas.95.11.6181. [DOI] [PMC free article] [PubMed] [Google Scholar]
- 6.Pollard T.D. Regulation of actin filament assembly by Arp2/3 complex and formins. Annu. Rev. Biophys. Biomol. Struct. 2007;36:451–477. doi: 10.1146/annurev.biophys.35.040405.101936. [DOI] [PubMed] [Google Scholar]
- 7.Marchand J.B., Kaiser D.A., Pollard T.D., Higgs H.N. Interaction of WASP/Scar proteins with actin and vertebrate Arp2/3 complex. Nat. Cell Biol. 2001;3:76–82. doi: 10.1038/35050590. [DOI] [PubMed] [Google Scholar]
- 8.Cai L., Bear J.E. Peering deeply inside the branch. J. Cell Biol. 2008;180:853–855. doi: 10.1083/jcb.200802062. [DOI] [PMC free article] [PubMed] [Google Scholar]
- 9.Rouiller I., Xu X.P., Hanein D. The structural basis of actin filament branching by the Arp2/3 complex. J. Cell Biol. 2008;180:887–895. doi: 10.1083/jcb.200709092. [DOI] [PMC free article] [PubMed] [Google Scholar]
- 10.Beltzner C.C., Pollard T.D. Pathway of actin filament branch formation by Arp2/3 complex. J. Biol. Chem. 2008;283:7135–7144. doi: 10.1074/jbc.M705894200. [DOI] [PubMed] [Google Scholar]
- 11.Pantaloni D., Boujemaa R., Carlier M.F. The Arp2/3 complex branches filament barbed ends: functional antagonism with capping proteins. Nat. Cell Biol. 2000;2:385–391. doi: 10.1038/35017011. [DOI] [PubMed] [Google Scholar]
- 12.Machesky L.M., Insall R.H. Scar1 and the related Wiskott-Aldrich syndrome protein, WASP, regulate the actin cytoskeleton through the Arp2/3 complex. Curr. Biol. 1998;8:1347–1356. doi: 10.1016/s0960-9822(98)00015-3. [DOI] [PubMed] [Google Scholar]
- 13.Carlsson A.E., Wear M.A., Cooper J.A. End versus side branching by Arp2/3 complex. Biophys. J. 2004;86:1074–1081. doi: 10.1016/S0006-3495(04)74182-X. [DOI] [PMC free article] [PubMed] [Google Scholar]
- 14.Ditlev J.A., Vacanti N.M., Novak I.L., Loew L.M. An open model of actin dendritic nucleation. Biophys. J. 2009;96:3529–3542. doi: 10.1016/j.bpj.2009.01.037. [DOI] [PMC free article] [PubMed] [Google Scholar]
- 15.Mogilner A. Mathematics of cell motility: have we got its number? J. Math. Biol. 2009;58:105–134. doi: 10.1007/s00285-008-0182-2. [DOI] [PMC free article] [PubMed] [Google Scholar]
- 16.Haviv L., Brill-Karniely Y., Bernheim-Groswasser A. Reconstitution of the transition from lamellipodium to filopodium in a membrane-free system. Proc. Natl. Acad. Sci. USA. 2006;103:4906–4911. doi: 10.1073/pnas.0508269103. [DOI] [PMC free article] [PubMed] [Google Scholar]
- 17.Ideses Y., Brill-Karniely Y., Bernheim-Groswasser A. Arp2/3 branched actin network mediates filopodia-like bundles formation in vitro. PLoS One. 2008;3:e3297. doi: 10.1371/journal.pone.0003297. [DOI] [PMC free article] [PubMed] [Google Scholar]
- 18.Kraikivski P., Slepchenko B.M., Novak I.L. Actin bundling: initiation mechanisms and kinetics. Phys. Rev. Lett. 2008;101:128102. doi: 10.1103/PhysRevLett.101.128102. [DOI] [PMC free article] [PubMed] [Google Scholar]
- 19.Dueber J.E., Mirsky E.A., Lim W.A. Engineering synthetic signaling proteins with ultrasensitive input/output control. Nat. Biotechnol. 2007;25:660–662. doi: 10.1038/nbt1308. [DOI] [PubMed] [Google Scholar]
- 20.Pollard T.D. Rate constants for the reactions of ATP- and ADP-actin with the ends of actin filaments. J. Cell Biol. 1986;103:2747–2754. doi: 10.1083/jcb.103.6.2747. [DOI] [PMC free article] [PubMed] [Google Scholar]
- 21.Pollard T.D., Cooper J.A. Actin and actin-binding proteins. A critical evaluation of mechanisms and functions. Annu. Rev. Biochem. 1986;55:987–1035. doi: 10.1146/annurev.bi.55.070186.005011. [DOI] [PubMed] [Google Scholar]
- 22.Moraru I.I., Schaff J.C., Loew L.M. Virtual cell modelling and simulation software environment. IET Syst. Biol. 2008;2:352–362. doi: 10.1049/iet-syb:20080102. [DOI] [PMC free article] [PubMed] [Google Scholar]
- 23.Slepchenko B.M., Schaff J.C., Macara I., Loew L.M. Quantitative cell biology with the virtual cell. Trends Cell Biol. 2003;13:570–576. doi: 10.1016/j.tcb.2003.09.002. [DOI] [PubMed] [Google Scholar]
Associated Data
This section collects any data citations, data availability statements, or supplementary materials included in this article.