

Abstract
Experimental data (e.g., genetic lineage and cell population studies) on intestinal crypts reveal that regulatory features of crypt behavior, such as control via morphogen gradients, are remarkably well conserved among numerous organisms (e.g., from mouse and rat to human) and throughout the different regions of the small and large intestines. In this article, we construct a partial differential equation model of a single colonic crypt that describes the spatial distribution of Wnt pathway proteins along the crypt axis. The novelty of our continuum model is that it is based upon assumptions that can be directly related to processes at the cellular and subcellular scales. We use the model to predict how the distributions of Wnt pathway proteins are affected by mutations. The model is then extended to investigate how mutant cell populations can invade neighboring crypts. The model simulations suggest that cell crowding caused by increased proliferation and decreased cell loss may be sufficient for a mutant cell population to colonize a neighboring healthy crypt.
Introduction
The luminal surface of a healthy colonic tract is characterized by regularly spaced invaginations known as crypts (see Fig. 1 A) and is lined by a monolayer of epithelial cells attached to a basal lamina. Stem cells are believed to reside near the bottom of each crypt (1), where they divide to produce transit cells that divide four or five times before becoming terminally differentiated. The differentiated cells perform a variety of functions (including absorption and mucous secretion) to ensure that the intestinal lining functions properly. Upon reaching the top of the crypt, terminally differentiated cells either undergo apoptosis or are shed into the lumen and transported away (2,3). A clear consensus has not yet emerged on the causal relationship between apoptosis and cell shedding. However, Wu et al. (4) have shown that bacteria in the intestinal lumen can influence cell removal at the top of the crypt.
Figure 1.
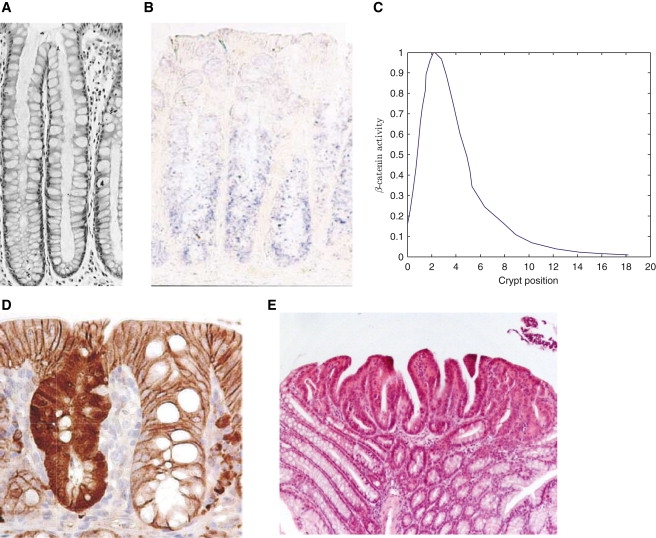
Experimental data on the crypt. (A) Section through a normal healthy crypt (12). (B) Wnt-6 stained murine colonic crypt (38). (C) Plot of normalized β-catenin activity along the crypt axis from a cross section through a mouse small intestinal crypt immunohistochemically stained for β-catenin expression. Data reproduced from Marshman et al. (39). Note that the presence of Paneth cells at the bottom of small intestinal crypts introduces features in the β-catenin profile that one may not expect to observe in colonic crypts. (D) A comparison of β-catenin distributions (stained) between an APC-mutated (left) and a normal (right) colonic crypt (taken from Barker et al. (40)). (E) Repopulation of neighboring crypts as a result of genetic mutations (13).
It is thought that a spatial gradient of extracellular Wnt factors along the crypt axis (see Fig. 1 B) determines the position-dependent rates of cell proliferation, differentiation, and death in intestinal crypts (5). One of the key events resulting from the binding of Wnt molecules to the cell membrane is the nuclear localization of β-catenin, a transcription factor that upregulates the transcription of over a hundred genes, many of which are involved in cell proliferation. Wnt-regulated β-catenin activity (see plot in Fig. 1 C) is modified by the APC protein, which acts as part of the cytoplasmic protein complex that labels cytoplasmic β-catenin for destruction. We note that other signaling pathways (e.g., BMP, EGF, TGF) are also known to be involved in the regulation of β-catenin activity (6).
If the balance between cell proliferation, death, and differentiation within an individual crypt is shifted by, for example, mutations that promote proliferation or inhibit apoptosis, then neoplasia results (7–9). In colorectal cancer, which is second only to lung cancer in the number of victims it claims per year (National Cancer Institute report, 2009), it is generally accepted that a mutation in the Wnt cascade is one of the earliest genetic events that leads to such an imbalance (10). In fact, ∼85% of sporadic and hereditary colorectal cancers have APC mutations that result in high levels of β-catenin (Fig. 1 D, left and right) and stimulate a transcriptional response that is thought to be critical in the development of colorectal cancer (11).
The manner in which crypt dysregulation occurs can vary. For example, small intestinal crypts, which are separated by villi that protrude into the intestinal lumen, tend to undergo transformations in the basal layers, resulting in invaginations in the crypt wall that extend into the villi to form microadenomas. In contrast, the absence of villi and presence of tight packing in colonic crypts is thought to enable mutant cell populations to colonize neighboring crypts (12,13) (Fig. 1 E). However, it is not clear what properties enable mutant cells to migrate down into neighboring crypts (given that in a normal crypt there is a steady flux of cells moving from the base to the top).
Although most cancer research is experimental, it is increasingly being recognized that this should be complemented by theoretical approaches (14,15). A number of mathematical modeling approaches have been used to study cell population dynamics in intestinal crypts. For example, Boman et al. (16) and Johnston et al. (17) have developed ordinary differential equation (ODE) models to study the interactions between subpopulations of cells in the crypt (e.g., stem, transit, and differentiated cells). Although these models capture particular aspects of cell population dynamics, such as how the number of stem cells can modify crypt behavior, since they neglect spatial effects, it can be difficult to relate the proposed mechanisms and results to data of the type presented in Fig. 1.
Most spatial models of the crypt are discrete in nature, with each cell treated as an individual (e.g., (18,19)). Cell motion is determined by neglecting inertial effects and balancing the forces exerted upon a given cell by its neighbors with a drag force. When cell division occurs, a new daughter cell is introduced adjacent to the mother cell. For example, Meineke et al. (18) developed a crypt model in a cylindrical geometry in which the forces between cells were modeled via linear springs. Stem cells, positioned at the base of the crypt, were assumed to produce transit cells whose progeny further differentiate as they migrate up the crypt. The cell proliferation rates were estimated using data from murine intestinal crypts (e.g., stem cells divide at half the rate of transit cells).
A more detailed description of intracellular dynamics allows molecular regulation of cell behavior to be incorporated into the discrete simulations. For example, van Leeuwen et al. (19) have extended the Meineke et al. (18) framework to account for spatial variation in cell proliferation and adhesion due to variation in Wnt along the crypt axis. The dynamics of a number of key proteins in the Wnt pathway, which are modeled within each cell using a system of ODEs (20), determine local cell proliferation rates and cell-cell adhesion properties.
One of the strengths of the discrete model structure is that it allows the simulation of observed crypt behaviors, such as cell heterogeneity (e.g., the introduction of individual mutated cells) and niche succession (when a particular cell lineage takes over the crypt). However, two problems with this methodology are: 1), it can be difficult to gain insight from complex stochastic models, as many simulations are needed to determine average behavior; and 2), detailed cellular and subcellular models generate a large parameter space whose exploration requires many simulations to identify the qualitative behavior of the model. As the number of molecular components incorporated in the biological networks increases, these problems become more limiting.
One way to circumvent such problems is to consider model reduction techniques. For example, Mirams et al. (21) have performed a multiple-timescale analysis on a high-dimensional ODE model of canonical Wnt pathway dynamics (22). They show that, on the timescale of epithelial cell proliferation in intestinal crypts, the Lee et al. (22) model can be reduced from 15 equations to a single ODE that describes the evolution of cytoplasmic β-catenin. We note that the approach considered by Mirams et al. (21) is applicable to extensions of the Lee et al. (22) model, in which further feedback regulation and APC truncation mutations are considered (e.g., (23–25)). In the context of multiscale models, the use of such simplified models can reduce the computational load and the dimensions of the parameter space.
A complementary reductive approach is to consider a coarse-grained description of cell motion. This can be achieved by making phenomenological assumptions about the mechanical properties of cells. For example, Walter (26) has developed a continuum model in which the epithelial cells that line the crypt have the material properties of a fluid flowing in a porous medium. As such, their velocity field can be described using Darcy's law. In some cases the need for purely phenomenological assumptions is removed by formally coarse-graining underlying discrete dynamical models (27–30). Murray et al. (31) have shown that the spatial dynamics of cells connected via overdamped linear springs, as in Meineke et al. (18), can be well represented by a nonlinear diffusion equation for cell number density. Hence, instead of simulating the motion of each cell individually, the number density of cells along the crypt axis is computed.
In this study, we develop a modeling framework that enables us to examine two features of crypt behavior that have important biomedical applications: morphogen regulation of cell proliferation and intercrypt cell migration. By combining the approaches of Mirams et al. (21) and Murray et al. (P. J. Murray, A. Walter, C. M. Edwards, M. J. Tindall, and P. K. Maini, unpublished), we construct a continuum model of the crypt that accounts for cell motion and β-catenin-dependent cell proliferation along the crypt axis. The β-catenin distribution along the crypt axis is predicted and the effects of mutations in the Wnt signaling pathway are investigated. We extend the continuum model to account for a chain of interlinked crypts and demonstrate how crypt invasion can occur as a result of altered rates of cell proliferation and shedding. We conclude by summarizing the key results and their biological implications and discussing the validity of our modeling approach.
Models
Single colonic crypt
Model development
Spatial gradients in morphogens, such as Wnt, encode positional information along the crypt axis by acting as external inputs into complex subcellular pathways that control cell behavior. In this section, we consider the canonical Wnt pathway and assume that the net effect of Wnt is to control subcellular β-catenin levels, which in turn regulate a cell's proliferation rate.
We define a cell number density, p(y, s, τ), where y represents distance from the bottom of the crypt (unit length is chosen to be a cell diameter of ∼10 μm), s the subcellular β-catenin concentration (nM), and τ time (h). Applying conservation of cell number to p(y, s, τ), we obtain the partial differential equation (PDE)
| (1) |
where Jy(y, s, τ) represents the (physical) flux of cells along the crypt axis, Js(y, s, τ) represents the flux due to subcellular β-catenin dynamics, and r is the net rate of cell proliferation. The structure of Eq. 1 is similar to that of other PDE models of cell populations; the difference here is that we consider a cell population structured according to intracellular β-catenin concentration, instead of, for example, age (as in, e.g., Dyson et al. (32)) or size (as in, e.g., Webb (33)).
When defining Jy we follow Meineke et al. (18) and van Leeuwen et al. (19) and assume that the cells are connected via overdamped linear springs. When specifying Js we follow Mirams et al. (21) and assume that the subcellular concentration of β-catenin is governed by the long-time dynamics of the Lee et al. model of the Wnt pathway (22). The cell proliferation rate, r, is assumed to be regulated by a β-catenin switch and the local cell density. Under these assumptions, it is possible to develop analytical expressions for Jy, Js, and r (see the Supporting Material), which upon substitution in Eq. 1 yield the nonlinear integrodifferential equation
| (2) |
where the spatial cell number density, q(y, τ), is defined as
| (3) |
and the flux term represents the flux of cells along the y axis. The nonlinear diffusion coefficient D(q) is given by , where α is the ratio of the spring constant to the cell viscosity.
The second term on the righthand side of Eq. 2. comprises a convective and a diffusive component: the convective component models the β-catenin dynamics in response to Wnt signaling (as derived in Mirams et al. (21) and applied to this spatial context in the Supporting Material). W(y) represents the external concentration of Wnt, which, without loss of generality, takes dimensionless values in the range 0 < W(y) < 1; a and f are positive rate constants representing the rate of production and degradation of β-catenin, respectively (in a natural-turnover, destruction-complex-independent manner). The remaining terms denote destruction-complex-dependent degradation: b is a dimensionless parameter, representing the activity of the destruction complex in the absence of Wnt; c and d are timescales dictating how the rate of β-catenin degradation increases and saturates in the absence of Wnt. The parameter values are presented in Table 1. The diffusive term represents population scale noise originating from intracellular variability in Wnt signaling: Ds is a parameter representing the noise strength. This variability could originate, for example, from different-sized cells, or cells differentiating into separate lineages (each of which would have slightly altered expression of signaling pathway components). The third term on the righthand side of Eq. 2 represents β-catenin-regulated cell proliferation: cells proliferate with rate when their β-catenin concentration exceeds the threshold s∗. The carrying capacity, K, represents a threshold cell density at which contact inhibition completely inhibits cell proliferation. We neglect cell apoptosis along the crypt axis and assume that cell removal is dominated by cell shedding at the top of the crypt.
Table 1.
Wnt signaling model parameters and their dimensions
| Parameter | Estimate | Units |
|---|---|---|
| a | 25.38 | nM h−1 |
| b | 0.100 | Dimensionless |
| c | 6.386 | h |
| d | 9.818 × 10⁻² | h |
| e | 1.200 × 10³ | nM |
| f | 1.540 × 10⁻² | h−1 |
Values shown are derived from experimental methods and measurements found in Lee et al. (22) and are applied to these parameters as discussed in the Supporting Material. See Models section for parameter definitions. The values of parameters c and d differ under APC mutations (see Table 2).
Unlike model systems such as the developing Drosophila wing, where Kicheva et al. (34) have shown that the Wingless (Wnt) gradient decays exponentially, to the best of our knowledge, the Wnt gradient in intestinal crypts has not been quantitatively measured. Guided by the available qualitative data, such as those presented in Fig. 1 B, we assume that the concentration of Wnt along the crypt axis decays exponentially so that
| (4) |
where λ is the characteristic lengthscale and y denotes distance from the base of the crypt. We note that in practice the situation is complicated by the coexistence of numerous distinct Wnt proteins. In the absence of a detailed understanding of their different functions, we group them together as a single generic Wnt factor, W(y). We fix λ at ∼30 μm so that there is qualitative agreement with the Wnt profile presented in Fig. 1 B.
We close Eq. 2 by imposing the following boundary and initial conditions:
| (5) |
| (6) |
| (7) |
| (8) |
The no-flux condition (5) ensures that the (physical) cell velocity at the bottom of the crypt is zero, whereas Eq. 6 fixes the cell number density, q(y, τ), at the top of the crypt such that cells are separated by a distance corresponding to their natural spring length, l, i.e., the constituent springs are at equilibrium. Implicit in the boundary condition in Eq. 6 is the assumption that the cell shedding rate at the top of the crypt self-regulates so that the equilibrium cell density is maintained. We remark that the boundary conditions of Eqs. 5 and 6 are equivalent to those in previous discrete models (18,19) and refer the interested reader to Murray et al. (30) for a more detailed discussion of how they can be derived directly by coarse-graining a discrete spring-based model. The no-flux conditions (Eq. 7) are derived based upon the assumption that cell number is conserved with respect to flux along the s axis, i.e., cell production occurs only via the third term in Eq. 2 and the initial conditions are prescribed.
Numerical results
The parameter α (the ratio of spring constant to cell viscosity) has been chosen to be consistent with existing discrete models (18,19), and the Wnt pathway parameters are taken from Lee et al. (22) (see Table 1). The parameter s∗, which determines the critical β-catenin threshold required for cell division to proceed, has been chosen such that the simulated proliferative crypt fraction is consistent with data from Potten and Loeffler (35). In the absence of suitable experimental data, we must estimate Ds, which measures stochasticity at the population scale in the β-catenin dynamics. The parameter K is the carrying capacity of the proliferative cell population (with units of cell number density) and can be estimated by considering the maximum observed cell densities in crypts. For example, Cortina et al. (13) have shown that there is an effective doubling of cell number in crypts that have dysregulated proliferative and adhesive cells. Hence, we set K = 2, although we expect this parameter to be cell- and crypt-specific. The production rate, ρ, is chosen such that the average cell doubling time in the proliferative region of a homeostatic crypt is that obtained by averaging over the stem- and transit-cell periods obtained from Potten and Loeffler (35).
In Fig. 2 A, a typical equilibrium solution of Eqs. 2–8 is plotted. Cell proliferation occurs at the bottom of the crypt (i.e., at y = 0, where p ≠ 0 when s ∼ 160), inducing a negative gradient in q(y). As , cell velocity increases along the crypt axis (see Fig. 2 B). In Fig. 2 C, the solid line denotes the mean value of β-catenin along the crypt axis, , which we can calculate as
| (9) |
Figure 2.
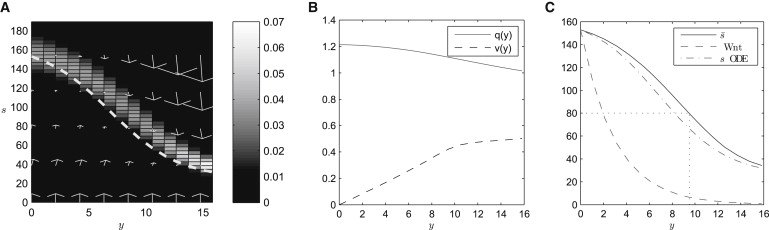
Numerical results from the single-crypt continuum model (Eqs. 2–8) at dynamic equilibrium. (A) The steady-state cell number density, p(y, s), is plotted in (y, s) space. The zero of the convective velocity (dashed line; see Eq. 2) is plotted against y. Arrows denote the cell velocity field. The model equations were solved numerically until a dynamic steady state was reached (τ = 40 h); parameters are as in Table 1. (B) The equilibrium cell number density, q(y), and velocity, v(y), are plotted against y. (C) The average β-catenin, (solid line), and Wnt (dashed line) concentrations are plotted against y. The dotted lines denote the threshold β-catenin concentration above which cell proliferation occurs. Note that the Wnt concentration has been rescaled in this figure for illustrative purposes. The zero of the convective velocity (see Eq. 2) is plotted against y (dot-dashed line). See Table S1 for a further comparison of macroscale results with experimental data. Ns = 50, Ny = 15, λ = 3, Ds = 25, s∗ = 80, ρ = 0.1, α = 35, K = 2. See Supporting Material for further numerical solutions.
is a decreasing function of crypt height, which is a direct result of the monotonically decreasing Wnt concentration along the crypt axis. We note that there is qualitative agreement with the experimentally observed β-catenin distributions (see Fig. 1 C), but that the quantitative form for this gradient is strongly dependent on the underlying Wnt gradient. The dot-dashed line in Fig. 2 C denotes the steady state of the subcellular β-catenin dynamics at each point along the crypt axis (see Eq. S6 in the Supporting Material). Therefore, cell movement along the crypt axis has the effect that internal β-catenin dynamics do not reach steady state, as the cells are continuously moving into regions of lower Wnt concentration. As a result (see Fig. 2 C), cells proliferate higher up the crypt in this dynamic model than the steady-state β-catenin level and Wnt concentration at that level would suggest.
Mutations in the Wnt pathway
APC mutations play an important role in the development of colorectal cancer (11). Because it contains detailed β-catenin dynamics, our model can be used to examine the effects of perturbations to the Wnt pathway on the distribution of β-catenin and hence cell dynamics along the crypt axis. For example, in the absence of a Wnt signal, APC forms a destruction complex with several proteins that binds with β-catenin, labeling it for ubiquitination and degradation. Truncation mutations in APC that impair its ability to bind to other destruction complex components or β-catenin lead to a build up of β-catenin in the cell. We model these truncation mutations by decreasing destruction-complex activity via an increase in parameters c and d, as shown in Table 2 (for further details, see the Supporting Material). Using numerical solutions of Eqs. 2–8 with the mutated values for parameters c and d, we can then simulate steady behavior in monoclonal crypts that have acquired an APC mutation.
Table 2.
Summary of how increasingly truncated APC mutants are captured in the continuum model via changes in parameters c and d
| Type | c (h) | d (h) |
|---|---|---|
| Wild-type | 6.386 | 0.098 |
| Mutation m7 | 31.87 | 0.490 |
| Mutation m8 | 47.62 | 0.732 |
| Mutation m9 | 71.21 | 1.095 |
Changes in parameters c and d are computed according to Eq. 2.
Simulation results (see the Supporting Material) reveal that the APC mutations defined in Table 2 lead to increased β-catenin levels along the entire crypt axis. In our model, cell division occurs when the intracellular concentration of β-catenin exceeds a threshold value, s∗. The APC mutations increase intracellular β-catenin concentrations so that the threshold is exceeded at all points along the crypt axis and the Wnt gradient no longer regulates cell proliferation; hence, all of the cells along the crypt axis proliferate. These results are in qualitative agreement with Fig. 1 D, which shows β-catenin staining in an APC-mutated (left) and a normal (right) crypt.
Mutant cell invasion of intestinal crypts
Model development
The results in the previous section illustrate how a continuum model can account for processes (e.g., Wnt-dependent cell proliferation) that act at the molecular scale within an individual crypt. However, treating crypts as isolated entities that are independent of their environment has limitations. For example, as illustrated in Fig. 1 E, populations of mutated cells are observed in numerous connected crypts, and it is not well understood what features of crypt behavior regulate such intercrypt cell migration. In this section, we extend the model of a single population of cells in a single crypt to account for multiple populations of cells in connected crypts.
As illustrated in Fig. 3, we now consider a periodic spatial domain y ∈ [−NL, NL] with the crypt bottoms and tops positioned at {…, −2L, 0, 2L, …} and {…, −L, L, …}, respectively. The independent variable y represents arc length along the chain of connected crypts, cell proliferation and shedding are localized to the bottoms and tops, respectively, of each crypt, and we consider populations of normal and mutated cells with number densities q1(y, τ) and q2(y, τ), respectively, whose behavior is governed by the assumptions that (see the Supporting Material for further details) 1), the β-catenin threshold that controlled cell proliferation in the previous section can be approximated using spatial thresholds yC1 and yC2, defined as the crypt heights below which the normal and mutant cells, respectively, can proliferate; and 2), cell shedding in each crypt occurs above crypt height yD, with shedding rates δ1 and δ2 for normal and mutant cells, respectively. The total cell density is defined to be q(y, τ) = q1(y, τ) + q2(y, τ), and applying the principle of conservation of cell number to each cell population, we obtain
| (10) |
where ρ is the linear proliferation rate; f(y, yCi) and g(y, yD) are periodic functions (as illustrated in Fig. 3) that capture the spatial restriction of proliferation and shedding to the bottoms and tops of crypts, respectively; and the cell fluxes, Jyi, are given by
| (11) |
Figure 3.
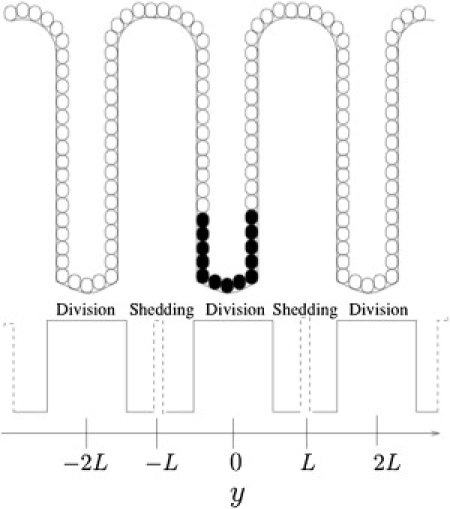
Schematic illustration of the multiple-crypt continuum model. L denotes the crypt height. Cell proliferation (solid line) occurs in regions centered around the points {…, −2L, 0, 2L, …}. Cell shedding (dashed line) occurs in regions centered around the points {…, −L, L, …}. Mutant cells (shaded) are introduced at the bottom of the central crypt.
This choice for the cell flux is consistent with neighboring cells being connected via linear springs. To examine the possibility of intercrypt cell migration, we consider the introduction of a small patch (characteristic width σ centered at y0) of mutant cells into a homeostatic population of normal cells (as illustrated in Fig. 3). The respective initial densities are denoted by q1(y, 0) and q2(y, 0), and the model is closed by prescribing the periodic boundary conditions
| (12) |
See the Supporting Material for further details regarding the derivation of Eq. 10 and the initial and boundary conditions.
Numerical results
In this section, we consider three separate cases that correspond to three different types of mutations. In case 1, the mutant cells are identical to their normal counterparts (the mutation is neutral); in case 2, the proliferation rate of the mutant cells is not regulated by Wnt, so that they proliferate throughout the crypt; and in case 3, the shedding rate of the mutant cells is lower than that of the normal cells, and their proliferation is not spatially regulated. In each case, a patch of mutant cells is introduced into a homeostatic crypt at τ = 300 h (see Fig. 4 A). In Fig. 4, B–D, snapshots of the total, q(y, τ), normal, q1(y, τ), and mutant, q2(y, τ), cell densities are presented, with schematic illustrations of the cell population dynamics depicted in Fig. S3.
Figure 4.
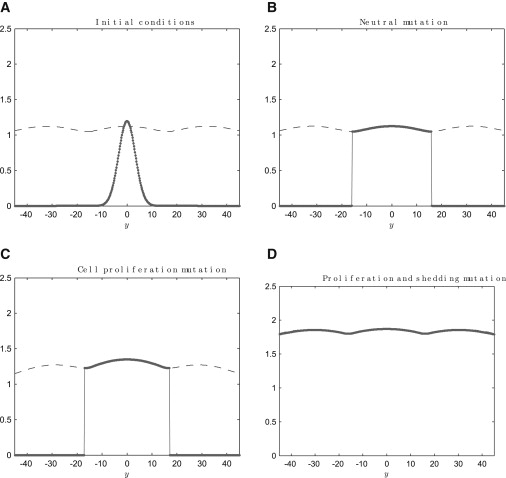
Snapshots of the cell density distributions (numerical solutions of Eqs. 10–12). Total q(y, τ) (dashed lines) and mutated (solid lines) (q2(y, τ)) cell number densities are plotted against y. For clarity, we have omitted the host population density, but note that q1(y, τ) = q(y, τ) − q2(y, τ)). (A) Initial conditions (τ = 300 h) for B–D (τ = 1000 h); a small patch of mutant cells is introduced into the homeostatic central crypt. (B) A neutral mutation overtakes the crypt with no change in the total cell density profile; (yC2, δ2) = (0.6L, 0.09). (C) A mutation allowing cell proliferation to occur throughout the crypt results in an increased mutated crypt density; (yC2, δ2) = (L, 0.09). (D) A mutated cell population that has a reduced shedding rate and can proliferate throughout the crypt invades neighboring crypts; (yC2, δ2) = (L, 0.001). Other parameter values: σ = 3.3, y0 = 0, α = 35, yC1 = 0.6L, yD = 0.15L, ρ = 0.1, δ1 = 0.09, N = 5, L = 16, K = 2, and Ny = 281.
In Fig. 4 B, the mutationally neutral population has been introduced at the bottom of the central crypt, and it pushes the neighboring normal cells up the crypt where they are shed into the intestinal lumen. Note that as the mutated cell population has the same properties as the normal cells in neighboring crypts, it remains confined to the central crypt (i.e., as a result of symmetry, the cell velocity field is zero at the top of each crypt).
We remove spatial regulation of cell proliferation by setting yC2 = L and recall that this situation corresponds to a mutation in APC that increases subcellular β-catenin concentrations along the crypt axis, allowing cell proliferation to occur throughout the crypt. In Fig. 4 C, the introduction of a population of cells with such a mutation is simulated. When proliferation occurs throughout a particular crypt, the cell density in that and neighboring crypts also increases (compare with Fig. 4 B). In our model, the influence of increased proliferation on a neighboring crypt is due to the dependence of the cell velocity field on the cell density gradient. As the cell density is greater at the top of the mutated crypt (more net proliferation arising from increased yC2), the velocity field in adjacent crypts falls , and the cell density increases. However, for the parameters chosen in our model, a mutation that allows proliferation throughout the crypt is sufficient for the mutated population to colonize a single crypt but not to invade neighboring crypts. Invasion does not occur, as the net effect of cell proliferation and shedding in the mutated crypt is insufficient to generate a sufficiently large velocity to drive the mutant cells into neighboring crypts.
In Fig. 4 D, the mutant cell population is characterized by a reduced rate of cell shedding and a proliferation rate that is not spatially regulated. For the model parameters chosen, this combination enables the cell density in the mutant patch to increase sufficiently to force the mutant cells into the neighboring crypts. Fig. 5 is a summary of the results from a range of simulations in which parameters δ2 and yC2 were varied. The fraction of mutant cells that occupy the neighboring crypt after τ = 1000 h varies with parameters δ2 and yC2. A normal crypt cell population has δ2 ∼ 0.1 and yC2 ∼ 10 (depicted by the marker). Our simulation results demonstrate that for the parameters taken from Potten and Loeffler (35), a mutation that disables spatial regulation of cell proliferation is not sufficient to make that population invade neighboring crypts: a reduction in the cell shedding rate is required for invasion to occur. However, the cell proliferation mutation does significantly reduce the magnitude of the change in shedding rate that is required for invasion to occur.
Figure 5.
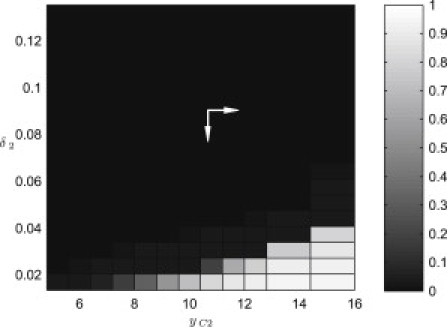
Bifurcation diagram showing the fraction of mutant cells in the neighboring crypt (centered at y = 2L) at τ = 1000 h changes as the shedding rate, δ2, and division threshold, yC2 are varied. The point (yC2, δ2) = (10, 0.09) corresponds to the position in parameter space of a wild-type cell.
Discussion
An increasing amount of qualitative data illustrating the importance of morphogen gradients in cell population regulation is being generated from studies of intestinal crypts (see, e.g., Fig. 1). As this data accumulation continues, the development of theoretical models that can provide a framework to evaluate hypotheses, describe current knowledge, and make novel predictions becomes increasingly important. Previous models of spatially regulated crypt dynamics have been discrete in nature. Although such frameworks are important, often many computationally intensive simulations are required to qualitatively describe model behavior.
In this article we consider what we believe is a novel continuum model of cell proliferation in multiple colonic crypts. First, we combine a simplified description of the Wnt signaling pathway in individual cells (21) with a spatial continuum model in which cells are assumed to be connected via linear springs (30). One of the benefits of this approach is that it allows us to make quantitative predictions regarding the molecular gradients that determine cell behavior. For example, given a Wnt profile along the crypt axis, our model predicts the corresponding β-catenin distribution. Moreover, we can predict how the β-catenin dynamics change as a result of mutations in the Wnt pathway.
In the derivation of the continuum model, we neglect the three-dimensional geometry of the crypt and assume that the cell population dynamics can be modeled in a continuum framework. We address both these issues in detail in the Supporting Material but summarize here: experimental studies in which the mitochondrial DNA of individual cells at the bottom of the crypt and their progeny are stained relative to other cells in the crypt (36,37) reveal ribbands of stained cells along the crypt axis, indicating that the velocity field within the crypt is predominantly parallel to the crypt axis. These experimental results are consistent with simulations of a two-dimensional crypt, where we observe ribbands of cells with common ancestors. The relatively small number of cells in a crypt raises the question of suitability of a continuum modeling approach. In the intestinal crypt, available experimental data are not yet of sufficient resolution to make possible a distinction between potential sources of noise (e.g., translation, transcription, or proliferation). Thus, we have approximated the effects of noise via a diffusion-like term in the β-catenin dynamics. It is important to note that the noise in our model depends on one parameter, the noise strength, Ds, which could be measured given a sufficient number of images of β-catenin staining experiments along the crypt axis. To validate our model, in the Supporting Material we show qualitative agreement between stochastic simulations of the continuum model and an underlying discrete stochastic model. The simulation results suggest that fluctuations resulting from cell proliferation are not so strong as to invalidate the mean-field approximation.
Motivated by numerical results from the detailed molecular model, we developed a simpler model to investigate interaction between cells in neighboring crypts. We considered the introduction of a mutated cell population by altering two key parameters: the height up the crypt below which cell proliferation occurs and the cell shedding rate. Extensive numerical simulations of the multiple-crypt model suggest that a change in spatial regulation of cell proliferation in colonic crypts is insufficient to drive the process of crypt invasion: a mutation that regulates the process of cell shedding is also required. Invasion requires the formation of an intercrypt cell density gradient arising from increased proliferation and/or decreased cell shedding. We note that in situations where symmetry about the crypt axis is broken, such as when mutant cells enter the top of a neighboring crypt, an assumption of motion in one spatial dimension is unlikely to quantitatively capture invasion dynamics between neighboring crypts. However, the one-dimensional model does demonstrate a mechanism by which cell invasion into neighboring crypts can occur.
The generation of a quantitative description of Wnt (and associated pathway component) profiles along the colonic crypt axis would allow our model to be experimentally tested. Ideally, such data would be accompanied by macroscale data on the crypt, such as the total cell number, proliferating cell fraction, crypt height and estimated cell cycle periods. Such data would allow us to refine aspects of the model, such as the form of the underlying Wnt gradient, and to make further quantitative predictions regarding molecular gradients and cell population behavior.
Our model suggests that cell crowding resulting from increased proliferation and decreased shedding within an individual crypt may be sufficient to enable the mutated cells to invade neighboring crypts. This mechanism could be tested by estimating the density gradients (counting the number of cells in spatial segments along the crypt axis). If passive migration is responsible for crypt invasion, then our model predicts that invasion can occur only if the density gradient is in a particular direction. Analysis of cell densities close to the boundary of an invading cell population could be sufficient to determine whether passive cell motion of the form hypothesized in this article can induce crypt invasion or whether active mechanisms (e.g., chemotaxis) are required to explain the data.
Acknowledgments
This work was supported by National Research Foundation of Korea (NRF) grants funded by the Korean government Ministry of Education, Science and Technology (MEST) (2009-0086964 and 2010-0017662). G.R.M. and P.J.M. are grateful for funding from the Engineering and Physical Science Research Council as part of the integrative biology programme (GR/572023/01). H.M.B., P.K.M., and K.H.C. were partially supported by Prime Minister's Initiative 2 (British Council). P.K.M. was partially supported by a Royal Society Wolfson Research Merit Award.
Contributor Information
Philip J. Murray, Email: murrayp@maths.ox.ac.uk.
Kwang-Hyun Cho, Email: ckh@kaist.ac.kr.
Supporting Material
References
- 1.Preston S.L., Wong W.M., Wright N.A. Bottom-up histogenesis of colorectal adenomas: origin in the monocryptal adenoma and initial expansion by crypt fission. Cancer Res. 2003;63:3819–3825. [PubMed] [Google Scholar]
- 2.Nowak M.A., Komarova N.L., Lengauer C. The role of chromosomal instability in tumor initiation. Proc. Natl. Acad. Sci. USA. 2002;99:16226–16231. doi: 10.1073/pnas.202617399. [DOI] [PMC free article] [PubMed] [Google Scholar]
- 3.Giles R.H., van Es J.H., Clevers H. Caught up in a Wnt storm: Wnt signaling in cancer. Biochim. Biophys. Acta. 2003;1653:1–24. doi: 10.1016/s0304-419x(03)00005-2. [DOI] [PubMed] [Google Scholar]
- 4.Wu S., Shin J., Sears C.L. The Bacteroides fragilis toxin binds to a specific intestinal epithelial cell receptor. Infect. Immun. 2006;74:5382–5390. doi: 10.1128/IAI.00060-06. [DOI] [PMC free article] [PubMed] [Google Scholar]
- 5.Gaspar C., Fodde R. APC dosage effects in tumorigenesis and stem cell differentiation. Int. J. Dev. Biol. 2004;48:377–386. doi: 10.1387/ijdb.041807cg. [DOI] [PubMed] [Google Scholar]
- 6.van den Brink G.R., Offerhaus G.J. The morphogenetic code and colon cancer development. Cancer Cell. 2007;11:109–117. doi: 10.1016/j.ccr.2007.01.003. [DOI] [PubMed] [Google Scholar]
- 7.Michor F., Iwasa Y., Nowak M.A. Linear model of colon cancer initiation. Cell Cycle. 2004;3:358–362. [PubMed] [Google Scholar]
- 8.Hanahan D., Weinberg R.A. The hallmarks of cancer. Cell. 2000;100:57–70. doi: 10.1016/s0092-8674(00)81683-9. [DOI] [PubMed] [Google Scholar]
- 9.Sieber O.M., Heinimann K., Tomlinson I.P. Genomic instability—the engine of tumorigenesis? Nat. Rev. Cancer. 2003;3:701–708. doi: 10.1038/nrc1170. [DOI] [PubMed] [Google Scholar]
- 10.Reya T., Clevers H. Wnt signalling in stem cells and cancer. Nature. 2005;434:843–850. doi: 10.1038/nature03319. [DOI] [PubMed] [Google Scholar]
- 11.Bienz M., Clevers H. Linking colorectal cancer to Wnt signaling. Cell. 2000;103:311–320. doi: 10.1016/s0092-8674(00)00122-7. [DOI] [PubMed] [Google Scholar]
- 12.Shih I.M., Wang T.L., Vogelstein B. Top-down morphogenesis of colorectal tumors. Proc. Natl. Acad. Sci. USA. 2001;98:2640–2645. doi: 10.1073/pnas.051629398. [DOI] [PMC free article] [PubMed] [Google Scholar]
- 13.Cortina C., Palomo-Ponce S., Batlle E. EphB-ephrin-B interactions suppress colorectal cancer progression by compartmentalizing tumor cells. Nat. Genet. 2007;39:1376–1383. doi: 10.1038/ng.2007.11. [DOI] [PubMed] [Google Scholar]
- 14.Gatenby R.A., Maini P.K. Mathematical oncology: cancer summed up. Nature. 2003;421:321. doi: 10.1038/421321a. [DOI] [PubMed] [Google Scholar]
- 15.Byrne H.M. Dissecting cancer through mathematics: from the cell to the animal model. Nat. Rev. Cancer. 2010;10:221–230. doi: 10.1038/nrc2808. [DOI] [PubMed] [Google Scholar]
- 16.Boman B.M., Fields J.Z., Runquist O.A. Computer modeling implicates stem cell overproduction in colon cancer initiation. Cancer Res. 2001;61:8408–8411. [PubMed] [Google Scholar]
- 17.Johnston M.D., Edwards C.M., Chapman S.J. Mathematical modeling of cell population dynamics in the colonic crypt and in colorectal cancer. Proc. Natl. Acad. Sci. USA. 2007;104:4008–4013. doi: 10.1073/pnas.0611179104. [DOI] [PMC free article] [PubMed] [Google Scholar]
- 18.Meineke F.A., Potten C.S., Loeffler M. Cell migration and organization in the intestinal crypt using a lattice-free model. Cell Prolif. 2001;34:253–266. doi: 10.1046/j.0960-7722.2001.00216.x. [DOI] [PMC free article] [PubMed] [Google Scholar]
- 19.van Leeuwen I.M., Mirams G.R., Byrne H.M. An integrative computational model for intestinal tissue renewal. Cell Prolif. 2009;42:617–636. doi: 10.1111/j.1365-2184.2009.00627.x. [DOI] [PMC free article] [PubMed] [Google Scholar]
- 20.van Leeuwen I.M., Byrne H.M., King J.R. Elucidating the interactions between the adhesive and transcriptional functions of β-catenin in normal and cancerous cells. J. Theor. Biol. 2007;247:77–102. doi: 10.1016/j.jtbi.2007.01.019. [DOI] [PubMed] [Google Scholar]
- 21.Mirams G.R., Byrne H.M., King J.R. A multiple timescale analysis of a mathematical model of the Wnt/β-catenin signalling pathway. J. Math. Biol. 2010;60:131–160. doi: 10.1007/s00285-009-0262-y. [DOI] [PubMed] [Google Scholar]
- 22.Lee E., Salic A., Kirschner M.W. The roles of APC and Axin derived from experimental and theoretical analysis of the Wnt pathway. PLoS Biol. 2003;1:E10. doi: 10.1371/journal.pbio.0000010. [DOI] [PMC free article] [PubMed] [Google Scholar]
- 23.Cho K.H., Baek S., Sung M.H. Wnt pathway mutations selected by optimal β-catenin signaling for tumorigenesis. FEBS Lett. 2006;580:3665–3670. doi: 10.1016/j.febslet.2006.05.053. [DOI] [PubMed] [Google Scholar]
- 24.Kim D., Rath O., Cho K.H. A hidden oncogenic positive feedback loop caused by crosstalk between Wnt and ERK pathways. Oncogene. 2007;26:4571–4579. doi: 10.1038/sj.onc.1210230. [DOI] [PubMed] [Google Scholar]
- 25.Wawra C., Kühl M., Kestler H.A. Extended analyses of the Wnt/β-catenin pathway: robustness and oscillatory behaviour. FEBS Lett. 2007;581:4043–4048. doi: 10.1016/j.febslet.2007.07.043. [DOI] [PubMed] [Google Scholar]
- 26.Walter, A. 2009. A comparison of continuum and cell-based models of colorectal cancer. Ph.D. thesis, Nottingham University, Nottingham, United Kingdom.
- 27.Newman T.J. Modeling multicellular systems using subcellular elements. Math. Biosci. Eng. 2005;2:613–624. doi: 10.3934/mbe.2005.2.613. [DOI] [PubMed] [Google Scholar]
- 28.Lushnikov P.M., Chen N., Alber M. Macroscopic dynamics of biological cells interacting via chemotaxis and direct contact. Phys. Rev. E. 2008;78:061904. doi: 10.1103/PhysRevE.78.061904. [DOI] [PubMed] [Google Scholar]
- 29.Fozard J.A., Byrne H.M., King J.R. Continuum approximations of individual-based models for epithelial monolayers. Math Med Biol. 2009;27:39–74. doi: 10.1093/imammb/dqp015. [DOI] [PubMed] [Google Scholar]
- 30.Murray P.J., Edwards C.M., Maini P.K. From a discrete to a continuum model of cell dynamics in one dimension. Phys. Rev. E. 2009;80:031912. doi: 10.1103/PhysRevE.80.031912. [DOI] [PubMed] [Google Scholar]
- 31.Reference deleted in proof.
- 32.Dyson J., Sanchez E., Webb G. An age and spatially structured model of tumor invasion with haptotaxis. Discr, Cont. Dyn. Syst. 2007;8:45–60. [Google Scholar]
- 33.Webb G. Population models structured by age, size, and spatial position. In: Magal P., Ruan S., editors. Structured Population Models in Biology and Epidemiology. Springer; Berlin: 2008. pp. 1–50. [Google Scholar]
- 34.Kicheva A., Pantazis P., González-Gaitán M. Kinetics of morphogen gradient formation. Science. 2007;315:521–525. doi: 10.1126/science.1135774. [DOI] [PubMed] [Google Scholar]
- 35.Potten C.S., Loeffler M. Stem cells: attributes, cycles, spirals, pitfalls and uncertainties. Lessons for and from the crypt. Development. 1990;110:1001–1020. doi: 10.1242/dev.110.4.1001. [DOI] [PubMed] [Google Scholar]
- 36.Taylor R.W., Barron M.J., Turnbull D.M. Mitochondrial DNA mutations in human colonic crypt stem cells. J. Clin. Invest. 2003;112:1351–1360. doi: 10.1172/JCI19435. [DOI] [PMC free article] [PubMed] [Google Scholar]
- 37.McDonald S.A., Preston S.L., Wright N.A. Clonal expansion in the human gut: mitochondrial DNA mutations show us the way. Cell Cycle. 2006;5:808–811. doi: 10.4161/cc.5.8.2641. [DOI] [PubMed] [Google Scholar]
- 38.Gregorieff A., Pinto D., Clevers H. Expression pattern of Wnt signaling components in the adult intestine. Gastroenterology. 2005;129:626–638. doi: 10.1016/j.gastro.2005.06.007. [DOI] [PubMed] [Google Scholar]
- 39.Marshman E., Booth C., Potten C.S. The intestinal epithelial stem cell. Bioessays. 2002;24:91–98. doi: 10.1002/bies.10028. [DOI] [PubMed] [Google Scholar]
- 40.Barker N., Ridgway R.A., Clevers H. Crypt stem cells as the cells-of-origin of intestinal cancer. Nature. 2009;457:608–611. doi: 10.1038/nature07602. [DOI] [PubMed] [Google Scholar]
Associated Data
This section collects any data citations, data availability statements, or supplementary materials included in this article.