

Abstract
Human red blood cells (RBCs) lack the actin-myosin-microtubule cytoskeleton that is responsible for shape changes in other cells. Nevertheless, they can display highly dynamic local deformations in response to external perturbations, such as those that occur during the process of apical alignment preceding merozoite invasion in malaria. Moreover, after lysis in divalent cation-free media, the isolated membranes of ruptured ghosts show spontaneous inside-out curling motions at the free edges of the lytic hole, leading to inside-out vesiculation. The molecular mechanisms that drive these rapid shape changes are unknown. Here, we propose a molecular model in which the spectrin filaments of the RBC cortical cytoskeleton control the sign and dynamics of membrane curvature depending on whether the ends of the filaments are free or anchored to the bilayer. Computer simulations of the model reveal that curling, as experimentally observed, can be obtained either by an overall excess of weakly-bound filaments throughout the cell, or by the flux of such filaments toward the curling edges. Divalent cations have been shown to arrest the curling process, and Ca2+ ions have also been implicated in local membrane deformations during merozoite invasion. These effects can be replicated in our model by attributing the divalent cation effects to increased filament-membrane binding. This process converts the curl-inducing loose filaments into fully bound filaments that arrest curling. The same basic mechanism can be shown to account for Ca2+-induced local and dynamic membrane deformations in intact RBCs. The implications of these results in terms of RBC membrane dynamics under physiological, pathological, and experimental conditions is discussed.
Introduction
The cortical cytoskeleton of red blood cells (RBCs) is a two-dimensional network of spectrin filaments attached to the internal domain of integral membrane proteins through a variety of intermediate protein links (1). Under physiological conditions, the spectrin network plays a crucial role in maintaining the normal biconcave shape of the RBC, which allows RBCs to deform and pass through narrow capillaries in the microcirculation. Under pathological and experimental conditions, however, RBCs can undergo dramatic changes in shape, e.g., from a discocyte to an echinocyte (2,3), or changes of a more local and highly dynamic nature, as when a malaria merozoite approaches an RBC targeted for invasion (4–7). If the initial contact is away from the apical pole of the merozoite, which is required for penetration, the RBC responds with rapid merozoite-engulfing motions, and the merozoite reorients to achieve apical contact. As soon as this is attained, the RBC returns to its normal biconcave shape and remains quiescent while it is penetrated by the parasite. Immediately after the parasite is internalized, a second and more prolonged wave of dynamic deformations takes place. Ca2+ ions have been implicated in both early and late dynamic responses during merozoite invasion (8).
An even more dramatic example of cytoskeleton-driven local dynamic membrane shape changes is that documented during the process of spontaneous inside-out membrane curling and eventual vesiculation following cell lysis (9,10). The unique feature of this process, which makes it an ideal system for studying the molecular mechanism that drives the local shape dynamics of the RBC membrane, is that it operates in a total absence of cytosolic components and external sources of energy, in distilled water media with no divalent cations, and only a trace of a proton buffer. After lysis is completed, the membrane at the free edge of the lytic hole is observed to curl outward in a process that takes several seconds at 37°C (9).
Our basic assumption in this study is that the spontaneous curvature of the cell membrane is determined by the anchoring of the spectrin filaments, and therefore connects the molecular (tens of nanometers) and the cellular (several micrometers) length scales. Our model explains how the cortical cytoskeleton can control membrane conformations locally or globally. We apply the model to investigate the curling of isolated RBC membranes and the potential role of Ca2+ in arresting curling and mediating localized dynamic membrane deformations in intact RBCs.
Materials and Methods
Cytoskeleton-induced membrane curvature
Curling and subsequent vesiculation of the membrane at the lytic hole have been suggested to correlate with the presence of the spectrin cytoskeleton at the inner membrane surface (9). After vesiculation is complete, the spectrin-actin cytoskeleton detaches and all spontaneous membrane motion ceases (11,12). The curling phenomenon is not unique to RBCs; images of curled open membranes have been observed in membrane preparations from yeast and other mammalian cells under different experimental conditions (13), suggesting that cortical cytoskeleton components of eukaryotic cells can generate and sustain similar open membrane configurations. Under most experimental conditions, however, a lytic hole in any cell or in a protein-free synthetic lipid bilayer rapidly reseals (9,12,14,15). In the case of RBCs, the free edge eventually fuses to form cylindrical and spherical multilayered vesicles (9).
Any source of spontaneous curvature in the membranes (16) will induce the observed curling, as we demonstrate in our simulations below. The experimental evidence in favor of this curvature being induced by the spectrin cytoskeleton is based on the following points: As long as the spontaneous curling of the free edges proceeds, there will be no release of spectrin-actin to the medium. Spectrin-actin is suddenly released only after vesiculation is completed and the vesicles display retention of sealing markers (12). In addition, the spectrin filaments are adsorbed only on the inner side of the membrane, and this asymmetry is maintained throughout the curling process (see Fig. 2 B).
Figure 2.
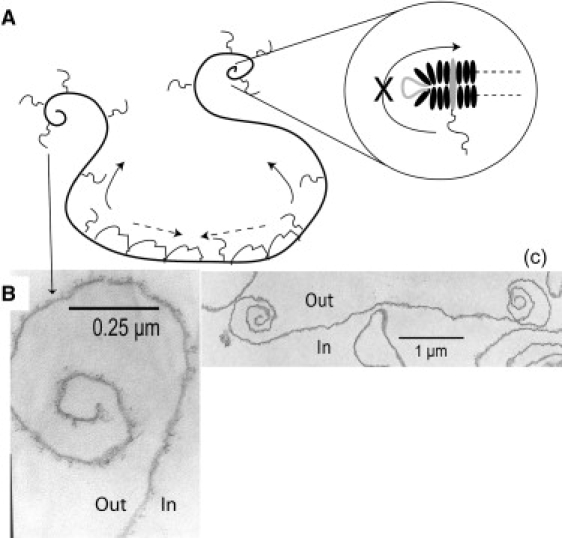
Schematic picture of our model. The connected network of filaments of convex spontaneous curvature (type II) is slowly shrinking and releasing its tension (dashed arrows), slowly squeezing out the type I filaments that have concave spontaneous curvature and migrate (solid arrows) to the curling lip at the open hole. Another mechanism is that rupture of the membrane during hole formation and the consequent curling process convert type II filaments to type I filaments, thereby increasing the overall excess density of type I filaments at the tips and throughout the ghost membrane. These mechanisms are proposed to explain the observed patterns (B) (9). In the circled inset is a representation of a type I filament at the hole rim, with lipids as black ovals and transmembrane anchor in gray. The pore edge can be stabilized by curved proteins that are denoted by an open gray shape. The asymmetry between the inner and outer faces of the membrane is maintained because filaments cannot diffuse through the rim to the outer side, and indeed filaments are seen only on the inner side of the membrane throughout the curling process (B). The time period of the curling process is within seconds of membrane rupture (9).
Divalent cations arrest the curling process at any intermediate stage of the vesiculation process and also block spectrin-actin release (12). Lysing of red cells in media with higher ionic strength and osmolality than used for spontaneous vesiculation (1–2 mM Na-HEPES pH 7.5 + 0.1 mM EDTA) allows for slow spectrin-actin dissociation with minimal or no spontaneous vesiculation (1,11,17,18). Under these conditions, the membrane has the appearance of a giant liposome with invisible opening, devoid of any spontaneous motion, and vesiculation of such spectrin-free liposomes can only be induced by the application of vigorous shearing forces (18). Collectively, this evidence documents a strong association of spectrin-actin with curls and motion. Although it does not directly demonstrate that spectrin filaments drive the curling, it shows that the physical properties of the spectrin-actin-free membrane are not compatible with the detectable spontaneous curling motion.
The spectrin filaments of the cytoskeleton are mostly in the form of tetramers that form a triangular network, with the ends of the tetramers connected to the membrane through actin-band 4 complexes (the vertices of the network). Additionally, the tetramers are randomly anchored to the membrane at their midpoints by ankyrin-band 3 complexes. For simplicity, we neglect the ankyrin anchor complexes and treat the spectrin tetramers as single filaments that can be anchored with only one end attached (type I) or with both ends attached (type II; Fig. 1). Dynamic dissociation and rebinding have been proposed to explain membrane fluctuations and remodeling of the membrane after the solid-to-fluid transition of a cytoskeletal network (19,20). Types I and II may be considered symbolic representations for alternative configurations of cytoskeletal components whose interplay can control dynamic changes in membrane curvature. This is the essential mechanistic content of our model.
Figure 1.

Schematic picture of the spontaneous curvature of the two types of spectrin filaments on the RBC membrane: (A) type I spectrin filaments that are grafted at one end (left), or at both ends but not connected to the stretched network, induce a concave spontaneous curvature of radius R1 (Rg is the radius of gyration of the filament). (B) Type II spectrin filaments that are grafted at both ends and are part of the connected stretched network that spans the RBC membrane's inner surface (L is the separation between anchoring complexes) induce a local convex spontaneous curvature of radius R2. An illustration of type I (C) and type II (D) filaments as part of a triangular network in which each edge represents a spectrin tetramer that can be connected to the membrane through actin band 4 complexes (black circles) and can be further connected to the membrane through band 3 complexes (open circles) is shown. In c the spectrin tetramers are anchored to membrane complexes only at one end (type I), whereas in D the spectrin tetramers are anchored at both ends and are part of the stretched network (type II). (E) Schematic illustration of the curling RBC ghost, which has a cylindrical symmetry, and the thin-strip approximation (F) that we use in our calculation. The strip has width w and a contour defined by the coordinate s, and the forces act everywhere along the local normal .
It has been shown both experimentally (21–24) and theoretically (25–27) that a polymer anchored with one end to a lipid bilayer, corresponding to type I spectrin filaments, exerts an entropic pressure such that the membrane curves away from the filament (defined here as a concave local shape with the normal pointing outward from the cell). The thermal fluctuations of the filaments are the source of this pressure, and their configuration space is confined by the bounding membrane. This configuration space, and therefore the entropy, increases if the membrane bends away from the type I spectrin filament, thereby allowing more degrees of freedom for the filaments to explore different. The filament pulls the membrane at its anchor and pushes everywhere else. For a membrane patch of size πRg2, where the radius of gyration of the spectrin tetramer is Rg = 13 nm (28), and a membrane bending rigidity κ = 10 kBT, we estimate the induced curvature radius (25) to be R1∼0.1–1 μm for type I filaments (depending on the spectrin density and anchoring topology; see Fig. 1 A). Type II filaments within the intact cytoskeleton network act as stretched entropic springs that locally curve the membrane toward the filament (defined here as a convex shape), as shown in Fig. 1. The finite distance between the spectrin cytoskeleton and the lipid bilayer (30), and the stretched spectrin bonds (31), determines the curvature imposed by the entropic pressure of type II filaments. Since in a disrupted network the anchor distance is unknown, we estimate the entropic effect of the filaments on the membrane curvature to be similar for both types of filaments, but with opposite sign, i.e., R2 = −R1∼0.1 μm (Fig. 1 B). The curvature induced by the spectrin network has been calculated on the length scale of spectrin mesh size (28), as well as on larger scales (32), and several experiments have demonstrated that anchored polymers can indeed produce a spontaneous curvature of such magnitude (23,24).
Based on these results, we developed a model to explain the membrane dynamics observed in the processes of curling and apical alignment. The basic assumption is that the variation in the concentrations of both types of membrane filaments controls the local membrane curvature in space and time (Fig. 2). Although we explicitly describe membrane dynamics in terms of type I and type II spectrin filaments in our model, the model will also apply when curvature is induced by membrane proteins other than spectrin.
Divalent ions, such as Ca2+, have been shown experimentally (12,33–35) to induce a stronger binding of the spectrin filaments to the membrane through their anchoring complexes. Therefore, we could translate the effect of divalent cations in the model as inducing a larger equilibrium fraction of type II filaments over type I filaments.
Model
In our model, the densities of both types of spectrin filaments control the membrane curvature (Figs. 1 and 2). We use a continuum model to compute the shape deformation of the membrane and the density distribution of the two types of filaments. The filament densities are treated as continuum variables, which are the averaged (coarse-grained) values of the discrete distribution of the real filaments. Although we explicitly use type I and type II spectrin filaments as the origin of the curvature, the model also applies when the curvature is induced by membrane proteins other than spectrin, such as curved integral proteins (16,36).
The bending effect of the filaments is treated here with a coarse-grained approach, ignoring the fine-scale wavy nature of the membrane shape due to the anchored filaments (25–28). The average spontaneous curvature of the membrane is thus induced by the field of filaments. In a dilute regime, where excluded-volume interactions among the filaments are weak, this approach allows us to treat the induced curvature of the two types of filaments in a simple additive manner (37) in the equation for the membrane bending energy (Eq. 1 below).
There are two possible ways to simplify the calculation: 1), assume that the membrane deformation and filament distribution are cylindrically symmetric; or 2), consider a thin strip of membrane (of width w) that is curved only along its length (while flat along the direction of the strip width (translational symmetry)). We followed the second strategy.
The Hamiltonian describing the free energy, E, is given by the standard Helfrich-type form (38):
| (1) |
where s is the coordinate along the contour, n1 and n2 are the relative densities of the two types of filaments, normalized by the saturating (maximal) packing density of the filaments nsat, κ is the bending rigidity modulus, and H1 = 1/R1 and H2 = 1/R2 are the two spontaneous curvatures associated with type I and type II filaments, respectively, so that the overall spontaneous curvature induced by the spectrin filaments is n1H1 + n2H2. This force arises from the mismatch between the local membrane curvature and the local value of the spontaneous curvature (due to the filaments), which drives the membrane to bend so as to reduce the mismatch. Using this free energy, we can now derive the equations of motion for the membrane shape and filament distribution.
Using the calculus of variation (see Supporting Material, Part S1), we derive the following force acting on the membrane in the normal direction, due to the instantaneous distributions of type I and type II filaments:
| (2) |
where the membrane curvature is (see Supporting Material for the derivation). This force arises from the mismatch between the local membrane curvature and the local value of the spontaneous curvature, which drives the membrane to bend so as to reduce the mismatch. The variation leading to Eq. 2 is a one-dimensional version of the more-general expressions derived previously (39,40). These expressions recover the familiar form for small undulations of a flat membrane in the Monge gauge. Note that whereas most previous works dealt with the stationary shapes of membranes (39–41), here we are solving the dynamics of the membrane shape deformations. Below, we show that the dynamics is nontrivial; for example, a membrane with a uniform spontaneous curvature is shown to curl from its free edges inward.
Details of the simulation techniques are given in the Supporting Material, and here we mention just the main properties. In addition to the curvature-driven forces given by Eq. 2, there are two more forces that act on the membrane in our simulations: 1), the stiff harmonic-spring interaction between the nodes along the membrane maintain a constant overall length of membrane strip; and 2), an artificial short-range repulsion prevents the membrane from overlapping on itself. The sum of these forces acting on the membrane is then used in the equation of motion of the membrane, which is written in the limit of local hydrodynamic interactions (42):
| (3) |
where Vn is the normal velocity of the membrane and ξ is the effective friction coefficient that takes into account the viscous drag exerted by the fluid that surrounds the membrane locally (this is a simplified form of the Oseen tensor in the limit of only short-range hydrodynamic interactions). The full solution of this system, including the hydrodynamic flows around the curling membrane, awaits a future study.
Finally, since we work in translational symmetry, the free edges of the membrane strip (the end-points of our one-dimensional contour) correspond to the membrane edge along the hole in the real ghost. The hole radius and edge length are thus meaningless, and their energy contribution (line tension) is therefore constant. In the real situation, the hole starts from some minimal radius size, which has a large distribution. Nevertheless, the curling process is observed experimentally (9) to proceed without any correlation to the radius of the hole; it is observed to be identical along the edges of both small holes of radius R∼0.5 μm and large holes of R∼10 μm (Fig. 2 c). We therefore decided to investigate the curling process independently of the issue of hole edge length, as is inherent to our choice of translational symmetry (Supporting Material, Part S2.4). The weak effective line tension observed in the RBC ghosts (9) may arise due to the stabilization of the pore edge by curved membrane proteins (Fig. 2 A, inset). The simulations presented here using translational symmetry are reasonably accurate as long as the hole radius is much larger than the radius of curvature induced by the filaments, i.e., μm. The boundary conditions at the two free end-points of the membrane (on both sides of the hole) were set so that the membrane at the edges would have the curvature imposed by the local filament density (Supporting Material, Part S2.3).
The filaments diffuse in the membrane, with conservation of the total number of filaments for each type. For simplicity, we do not allow spontaneous filament type interconversion, although this can easily be added. The membrane conformation acts as a potential landscape in which the two different types of filaments flow. The resulting fluxes of filaments are given in the Supporting Material.
The model as described up to now proved sufficient to describe the curling and malaria preinvasion processes. In the case of the merozoite attachment, only a small patch of the RBC membrane close to the parasite has to be simulated, so we used periodic boundary conditions with increased spatial resolution compared to the simulations for curling. To simulate the effects attributed to Ca2+ in the malaria preinvasion events, we incorporated a simplified version of the known pump-leak Ca2+ balance across the RBC membrane (see details in the Supporting Material).
Most of the biophysical parameters used in this work were taken from the literature. The diffusion coefficient of proteins within the membrane was previously estimated to be 0.01–0.005 μm2/s (43), whereas the diffusion coefficient of spectrin filaments was smaller, at 0.001 μm2/s (43). The bending rigidity is on the order of 10 kBT. The only parameter that was fitted to give a good agreement with the experiment was the effective membrane friction in Eq. 3. The efflux of Ca2+ was taken as 35 s−1 (44) and the diffusion coefficient of Ca2+ was estimated at 1 μm2/s (45). The saturating (maximal packing) density of the filaments, nsat, can be estimated from previous measurements (35) and taken to be on the order 1000 μm−2.
Results
Effects of filament type and density on membrane curling pattern
To isolate the effect of filament types and densities on the membrane dynamics, we ran simulations with only one type of filament (i.e., type I or type II). The filaments in this set of simulations had negligible filament mobility (nsat = 1000 μm−2; Λ/nsat = 10−5 gr s−1, where Λ is the filament mobility in the membrane). Fig. 3, A and B, shows snapshots of simulations with type II filaments at low and high relative densities. Curling at the free edges is inward, with an outside-in topology (a pattern that has been observed in a synthetic vesicle system (46) but never observed experimentally in RBCs), and the radius of the curled membrane is ∼0.25 μm and ∼0.1 μm for the initial relative filament densities of 0.4 and 1, respectively.
Figure 3.
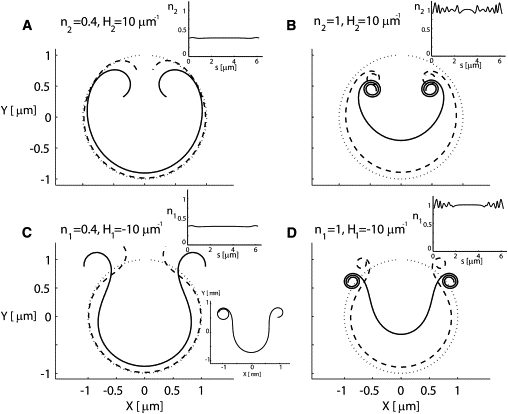
Effects of filament types and densities on the membrane dynamics. The two top panels (A and B) describe cases of type II filaments at low and high densities, within 30 s. The curvature sign is positive (H2 = 10), and as a result the curling is inward. The two bottom panels (C and D) describe cases of type I filaments at low and high densities. The curvature sign is negative (H1 = −10), and as a result the observed curling is outward. In all cases, the mobility of the filaments was quite low (nsat = 1000 μm−2; Λ/nsat = 10−5 gr s−1). The insets at the top of each panel describe the final distribution of the filaments. Since the mobility is low, the final distribution has small fluctuations around the initial uniform spatial distribution. In both the bottom and top rows, the different densities yield radii of curvature of 0.25 μm and 0.1 μm, respectively, as expected: 1/(n1,2∗H1,2). If the simulation in C is allowed to run for a longer time (90 min), curling with more than one turn of the membrane is observed (bottom inset).. In each panel, the dotted line describes the initial membrane shape of a circle with a hole, the solid line describes the final shape within a time period of 30 s, and the dashed line describes an intermediate time.
Note that the curling process starts at the ends of the strip in our simulations, as observed experimentally (9). This is because the curvature forces are mostly balanced within the bulk of the membrane, leaving the free edge as the only location of unbalanced forces. Mathematically, this can be seen from Eq. 2: for a uniform distribution of one type of filament, the force due to the filaments comes only from the fourth term on the right-hand side. This term is proportional to the membrane curvature, which is initially low everywhere (radius of the ghost membrane) except at the free ends, where the local curvature is defined by the spontaneous curvature of the filaments there (Part S2.3, Eq. S22 of the Supporting Material). The forces at the free ends are therefore dominant and drive the curling from the edges inward.
In Fig. 3, C and D, we show the analogous results for type I filaments. Here we find the same curvature radii of 0.25 μm and 0.1 μm, but curling is outward, with an inside-out topology. This agrees with the curling observed in the RBC, and was also observed in the curling synthetic vesicle system (46). After ∼30 s, the membrane has curled three turns for simulations with high filament density, whereas not even a single turn was completed in the simulations at low density. If the simulation in Fig. 3 C is allowed to run over a much longer time (90 min), we get curling with more than one turn of the membrane and an even greater radius of curvature (∼0.2 μm). This greater radius of curvature is due to the flux of filaments toward the edges (results not shown). The high-density case matches the experimentally observed radius of the innermost curl (∼0.1 μm; Fig. 3 D). Note that excluded volume repulsive forces generate the spiral pattern such that only the innermost part of the membrane achieves the desired curvature, and the rest of the membrane spirals around it with an ever larger radius of curvature.
These results show that only the simulations with a high density of type I filaments in the ruptured ghost render the experimentally observed curling pattern of the membrane (Fig. 3 D). For a good experimental fit, >90% of the filaments should be of type I. This suggests that lytic rupture in the unique conditions that trigger spontaneous inside-out vesiculation explosively redistribute the filament distribution from a prelytic state with comparable proportions of type I and type II filaments to a >90% type I filament excess. Excesses of smaller magnitude would lengthen the curling process and reduce the curvature, and this may also account for some of the experimentally observed variability.
Note that the membranes in the experiments evolved further beyond the curling process, by means of a series of cutting-splicing events, so that the curled part of the ghost is finally dashed up into small vesicles (9,10). These vesicles satisfy the minimum curvature energy requirement as dictated by the density of type I filaments adsorbed on the external surface of the membrane. This step cannot be captured by our simplified calculation using only a thin strip of membrane.
Effects of the initial filament distribution on the membrane curling pattern
During rupture of the RBC, a higher proportion of type I filaments might be produced close to the lytic hole due to mechanical disruption of the spectrin network. To evaluate the effect of an inhomogeneous initial distribution of the filaments on the membrane dynamics, we ran simulations with asymmetric distributions for both types of filaments. In addition, the diffusion of spectrin filaments with high mobility (nsat = 100 μm−2; Λ/nsat = 10−4 gr s−1)) was included. The initial distributions had an excess of type I filaments at the free edges, with the excess decaying as a Gaussian from the edges to the middle. We varied the gradient of the filament density by changing the width of the Gaussian distribution. Far from the edges, we assumed that the two types of filaments have equal concentration, as in an intact RBC. The distribution of type I at the edge was set to a density of 0.7 or 0.83 (i.e., an excess amplitude of δ = 0.2 or δ = 0.33, respectively), decaying to a base level of 0.5 with a variance of either σ = 1 μm2 or σ = 6 μm2. The excess of type I filaments results from the detachment of type II filaments, so that an excess of one type occurs at the expense of the other type (conservation of total number of filaments).
In Fig. 4 we show the results for different amplitudes and widths of the initial density variation. After 30 s of simulation, the results show that when the amplitude of the normal distribution is (δ = 0.33 filaments/μm, σ =1 μm2) or (δ = 0.33 filaments/μm, σ = 6 μm2), the edges deform by half a turn and one complete turn, respectively. We observe that as the membrane edge curls, this curvature attracts type I filaments, whereas type II filaments are repelled from this region (see distributions of filaments in the insets). We conclude that if the mobility of the filaments is large enough to respond to the membrane curvature with a large flux, as shown in Fig. 4 D, then a relatively moderate excess of type I over type II filaments at the edges of the hole is sufficient to curl the free edges of RBCs to the extent seen in the experiments. If the excess at the edges is too small (Fig. 4, A–C), we find that the resultant membrane curling is much smaller compared to that in the experiments. We further conclude that diffusion and segregation of the two filament types are not sufficient by themselves to drive the curling of the whole membrane—a global excess of type I is also required.
Figure 4.
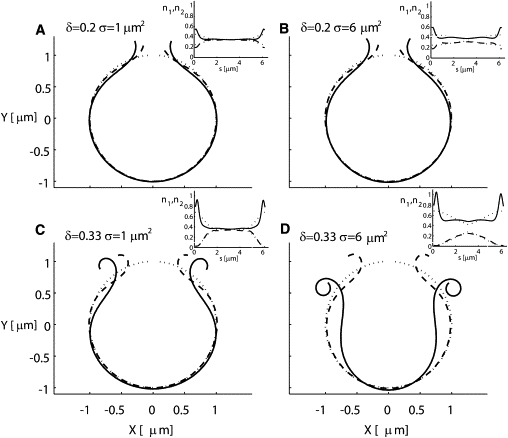
Effects of the spatial distribution of type I and type II filaments on membrane dynamics. The initial distribution has an excess of type I filaments localized at the edges of the hole, with a normal distribution of amplitude (δ) such that the density of the filaments at the edges is 0.35±δ (for type I and type II, respectively). The top and bottom rows are for δ = 0.2 [#/μm] and δ = 0.33 [#/μm], and the left and right columns are for σ = 1 [μm2] and σ = 6 [μm2], respectively. The mobility of the filaments is quite high (nsat = 100 μm−2; Λ/nsat = 10−4 gr s−1) in comparison to the low mobility in Fig. 3. Note that for the case of δ = 0.2 [#/μm] this amplitude was not sufficient to curl the membrane within the given time frame of 30 s (A and B). In addition, the case of high amplitude and low variance is not sufficient to form a complete curl. Finally, the case of high amplitude δ = 0.33 [#/μm] and high variance σ = 6 [μm2] yields a single curl within 30 s. Note that the larger variance creates a larger pool from which to attract more type I filaments toward the edges (D). In each inset, the dotted lines are the initial distribution of filaments, the dashed line is the distribution of type II filaments, and the solid line is the distribution of type I filaments. In the inset of panel D, note the large flux of filaments type I toward the edges.
Modeling the effect of divalent ions
The documented Ca2+-induced increase in the binding strength of spectrin filaments to the membrane (35) may be expected to effectively freeze the filament distribution due to a strong decrease in filament mobility, with an ensuing turnover of type I to type II filaments (Eq. S28) and cytoskeletal crosslinking (9). We found that the curling and spontaneous inside-out vesiculation process could be instantly arrested at any stage by the addition of divalent cations to the medium, but reversibility was observed only with Mg2+ ions. In Fig. 5 we model these divalent cation effects under two of the conditions analyzed above: 1), low mobility of spectrin filaments and large excess of type I filaments throughout the membrane (as in Fig. 3 D); and 2), high-mobility filaments and a localized excess of type I filaments at the free edges (as in Fig. 4 D).
Figure 5.
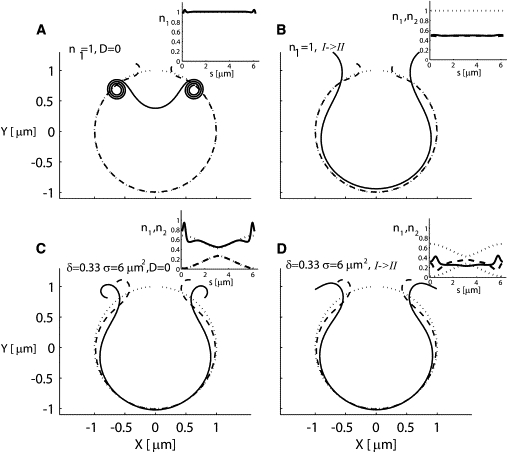
Modeling the effects of adding divalent ions on the membrane dynamics. The addition of divalent ions is modeled by eliminating the diffusion of filaments or by the turnover of type I to type II filaments. This modeling is performed for two successful cases: 1), high and uniform density (n1 = 1) of type I filaments with low mobility, as described in Fig. 3D (shown here in the top row); and 2), a more localized spatial distribution with large amplitude and variance (δ = 0.33 [#/μm], σ = 6 [μm2]) as described in Fig. 4D (shown here in the bottom row). The results for the arrest of diffusion are demonstrated in the left column, and the results for the partial turnover of type I to type II filaments are demonstrated in the right column. Since the curling in Fig. 3D is obtained within 10 s, the arrest of diffusion is performed after 2 s (A). Note that the arrest of diffusion is not able to stop the curling. In contrast, the curling in Fig. 4D is obtained within minutes, which allows us to arrest the diffusion after 10 s (C). This arrest slows down the curling, and a single full curl is not obtained within the time frame of 30 s. In the right column, the turnover is of 50% of type I into type II filaments, which is sufficient to stop the curling and to even unfold its curled edges (B and D).
In the low-mobility case (top row), we simulated the effect of the divalent ions after allowing the membrane to curl freely for 2 s. We first modeled the effect of the ions by elimination of filament diffusion, but this did not stop the curling because the excess of type I filaments was still high enough to keep the process going (Fig. 5 A). We next modeled the effect of the ions as a global turnover of type I to type II. We chose a significant turnover of 50% (this value is somewhat arbitrary) of type I to type II due to the addition of the ions, and found that this practically arrested the curling process; the spontaneous curvature was reduced significantly (to zero for this choice of parameters) and the curls began to slowly unfold (Fig. 5 B).
In the high-mobility and localized excess case (Fig. 5, bottom row), we tested the effects of the divalent ions by elimination of filament diffusion (Fig. 5 C) and turnover of type I to type II (Fig. 5 D). We found that when the ions diminished the diffusion, the curling process was considerably slowed down (Fig. 5 C) compared to the results shown in Fig. 4 D. A partial turnover of type I to type II also effectively arrested the curling (Fig. 5 D), initiating a partial unfolding of the curls. We conclude that when the mobility of spectrin filaments is high enough to play a role in the curling process, the elimination of diffusion due to the ions will slow down the curling, whereas the turnover of type I to type II filaments due to the addition of ions is always a sufficient mechanism to account for the observed arrest in the curling.
Modeling the effects of Ca2+-dependent filament turnover after a transient local Ca2+ influx episode
We next applied our model to simulate the membrane dynamics of an intact RBC in response to a transient local influx of Ca2+ ions. Such Ca2+ influx transients have been proposed to follow the initial contacts between merozoites and RBCs before merozoite invasion (5,8). Ca2+ influx was simulated by means of a step-function amplitude with a spatial width of 0.5 μm held constant for 2 s. The density of the type I and type II filaments was determined by the local instantaneous Ca2+ concentration (see Eq. S28). We chose a 3-μm-long membrane for these simulations, using periodic boundary conditions. We assumed that the initial filament density was the same for both species (n1 = n2 = 0.5). The Ca2+ pulse was assumed to cause a complete turnover of type I to type II filaments at the point of maximum amplitude, to give us an estimate of the upper bound of the amplitude of membrane deformation. The results are shown in Fig. 6, A and B. The Ca2+-induced turnover of type I to type II filaments caused the bending of the initially planar membrane in both the inward and outward directions due to the resulting inhomogeneous spontaneous curvature. The maximal membrane deformation was ∼0.4 μm after 2 s. In Fig. 6, C and D, the Ca2+ influx region was held fixed in space and prevented from folding inward. Despite this restriction, the folding-outward of the surrounding membrane remained robust.
Figure 6.
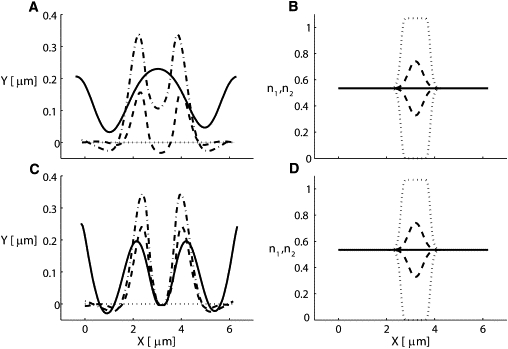
Exploring the effects of a Ca2+ influx pulse on local membrane shape in an intact RBC assuming the same mechanism as that applied to explain curling arrest by divalent cations. Two scenarios are modeled: 1), the membrane in the Ca2+ influx region is free to move (top row); or 2), it is held fixed (bottom row). The distributions of the two types of filaments are determined by the instantaneous local Ca2+ concentration. Therefore, the distribution has an excess of type II over type I filaments at the middle of the membrane. The density distributions of the two types are shown in B and D. The influx of Ca2+ is constant for a period of 2 s and causes the conversion of type I to type II (dotted line in B and D), compared with an initial density of 0.5 for both types of filaments. After 2 s, the influx stops, and as a result the Ca2+ density decays within 0.5 s, and consequently the filament densities decay toward 0.5 (dashed line in B and D). The turnover of type I to type II filaments causes the bending of the straight initial membrane (dotted line in A and C) in both the inward and outward directions (D). After 0.5 s the shape is given by the dashed line (A and C), and the maximal amplitude of ∼0.4 μm is reached after 2 s (the dotted-dashed line in A and C). Note that although the adhesion region prevents the membrane from folding inward, the folding outward remains robust (C). The solid line is the shape of the membrane after 10 s. Slow mobility of the filaments was allowed, and values are listed in Table 1.
Discussion and Conclusions
The results presented here show that a model based on the assumption that spectrin filaments attached to the inner side of the lipid bilayer membrane induce a spontaneous curvature can explain local dynamic membrane shape changes observed in experiments. Two classes of filaments are considered in the model depending on whether one end (type I) or both ends (type II) of the spectrin tetramer are attached to the membrane. Each type induces a spontaneous curvature on the membrane of opposite sign and roughly equal magnitude. The model treats these nanometer-scale components in a continuum landscape of variable local densities of each filament type in response to environmental conditions and membrane shape. We sought to determine whether the model could account for two well-documented examples of dynamic membrane deformations: 1), the curling phenomenon of spontaneously vesiculating RBC ghosts; and 2), the mechanism of membrane deformation during apical alignment of malaria parasites.
In the study of the curling phenomenon, the simulations showed that either an overall excess of type I filaments or an initial excess of type I filaments close to the lytic hole could initiate the outward curling of the cell membrane. Comparing the model with experiment (see Figs. 3–5) allowed us to fit the free parameter of our model, the effective membrane hydrodynamic friction. Divalent cations have been shown to arrest the curling and spontaneous vesiculation process (9,12), and to induce stronger spectrin-membrane binding (34,35). This effect is represented in the model by the elimination of filament diffusion and a turnover of type I to type II filaments. We find that the cation-induced turnover of type I to type II filaments is the dominant mechanism that allows us to reproduce the experimentally observed arrest of the curling (Fig. 5).
The mechanism of the effects attributed to Ca2+ was also investigated in relation to the potential of transient Ca2+ influx during merozoite apical alignment (4,5,8,47). The results (Fig. 6) show that the amplitude and timescale of the membrane deformations induced by the transformation of type I to type II filaments are in good quantitative agreement with those documented in the best available observations of this process (4–6). In addition, the simulations show that when the cytoskeleton consists mainly of type II filaments, membrane dynamics cannot occur and thus invasion efficiency is reduced. This may help explain the reduced invasion previously observed in ATP-depleted and volume-reduced RBCs (48–50).
The basic idea developed here—that spectrin filaments, or spectrin-like components of cortical cytoskeletons, control the local curvature of biological membranes and hence cell shape in static and dynamic conditions—is relevant not only to RBCs but also to all cellular systems with adsorbed networks of spectrin or spectrin-like filaments, such as neurons (7) and intracellular organelles (51).
Table 1.
List of parameters used in our simulation study
| Curvature, H1 [μm−1] | −10 | Temperature, T [K] | 300 |
|---|---|---|---|
| Curvature, H2 [μm−1] | 10 | Bending rigidity, κ [kB∗T] | 10 |
| n1,n2, relative densities of type I and type II filaments | nsat, maximum number of filaments per micron squared [μm−2] | 100, 1000 | |
| Diffusion coefficient of filaments, D [μm2 s−1] | 0.001 | Mobility of proteins, Λ [gr s−1μm−2] | D/(kB∗T) |
| Viscosity (water) η [gr m−1 s−1] | 10−4 | Relative mobility [gr s−1] | Λ/nsat |
| Filament length scale, d [μm] | 0.1 | Oseen tensor [s/gr] | 12.5 |
| Threshold distance for repulsion [μm] | 0.0327 | DCa [μm2/s] | 1 |
| Ca2+ efflux rate Keff [s−1] | 35 |
Acknowledgments
This study was supported by the U.S.-Israel Binational Science Foundation (grant 2006285 to N.S.G.), the Ministry of Absorption of Israel (D.K.), and the Wellcome Trust and the Biotechnology and Biological Sciences Research Council (V.L.L.).
Supporting Material
References
- 1.Bennett V. The spectrin-actin junction of erythrocyte membrane skeletons. Biochim. et Biophys. Acta. 1989;18:107–121. doi: 10.1016/0304-4157(89)90006-3. [DOI] [PubMed] [Google Scholar]
- 2.Bessis M. RI. The structure of normal and pathologic erythrocytes. Adv. Biol. Med. Phys. 1973;14:35–91. doi: 10.1016/b978-0-12-005214-1.50006-6. [DOI] [PubMed] [Google Scholar]
- 3.Wong P. A basis of echinocytosis and stomatocytosis in the disc-sphere transformations of the erythrocyte. J. Theor. Biol. 1999;196:343–361. doi: 10.1006/jtbi.1998.0845. [DOI] [PubMed] [Google Scholar]
- 4.Dvorak J.A., Miller L.H., Shiroishi T. Invasion of erythrocytes by malaria merozoites. Science. 1975;187:748–750. doi: 10.1126/science.803712. [DOI] [PubMed] [Google Scholar]
- 5.Gilson P.R., Crabb B.S. Morphology and kinetics of the three distinct phases of red blood cell invasion by Plasmodium falciparum merozoites. Int. J. Parasitol. 2009;39:91–96. doi: 10.1016/j.ijpara.2008.09.007. [DOI] [PubMed] [Google Scholar]
- 6.Glushakova S., Yin D., Zimmerberg J. Membrane transformation during malaria parasite release from human red blood cells. Curr. Biol. 2005;15:1645–1650. doi: 10.1016/j.cub.2005.07.067. [DOI] [PubMed] [Google Scholar]
- 7.Lencesova L., O'Neill A., Blaustein M.P. Plasma membrane-cytoskeleton-endoplasmic reticulum complexes in neurons and astrocytes. J. Biol. Chem. 2004;23:2885–2893. doi: 10.1074/jbc.M310365200. [DOI] [PubMed] [Google Scholar]
- 8.Lew V.L., Tiffert T. Is invasion efficiency in malaria controlled by pre-invasion events? Trends Parasitol. 2007;23:481–484. doi: 10.1016/j.pt.2007.08.001. [DOI] [PubMed] [Google Scholar]
- 9.Lew V.L., Hockaday A., Bookchin R.M. Mechanism of spontaneous inside-out vesiculation of red cell membranes. J. Cell Biol. 1988;106:1893–1901. doi: 10.1083/jcb.106.6.1893. [DOI] [PMC free article] [PubMed] [Google Scholar]
- 10.Lew V.L., Muallem S., Seymour C.A. Properties of the Ca2+-activated K+ channel in one-step inside-out vesicles from human red cell membranes. Nature. 1982;296:742–744. doi: 10.1038/296742a0. [DOI] [PubMed] [Google Scholar]
- 11.Steck T.L., Weinstein R.S., Wallach D.F. Inside-out red cell membrane vesicles: preparation and purification. Science. 1970;168:255–257. doi: 10.1126/science.168.3928.255. [DOI] [PubMed] [Google Scholar]
- 12.Tiffert T., Hockaday A.R., Lew V.L. Cytoskeletal protein changes and morphology during spontaneous inside-out vesiculation of human red cell membranes. J. Physiol. 1995;487:99. doi: 10.1007/s00424-014-1483-5. [DOI] [PMC free article] [PubMed] [Google Scholar]
- 13.Duran A., Cabib E., Bowers B. Chitin synthetase distribution on the yeast plasma membrane. Science. 1979;203:363–365. doi: 10.1126/science.366747. [DOI] [PubMed] [Google Scholar]
- 14.Burke B.E., Shotton D.M. Erythrocyte membrane skeleton abnormalities in hereditary spherocytosis. Br. J. Haematol. 1983;54:173–187. doi: 10.1111/j.1365-2141.1983.tb02086.x. [DOI] [PubMed] [Google Scholar]
- 15.Glück J.M., Wittlich M., Koenig B.W. Integral membrane proteins in nanodiscs can be studied by solution NMR spectroscopy. J. Am. Chem. Soc. 2009;131:12060–12061. doi: 10.1021/ja904897p. [DOI] [PubMed] [Google Scholar]
- 16.Zimmerberg J., Kozlov M.M. How proteins produce cellular membrane curvature. Nat. Rev. Mol. Cell Biol. 2006;7:9–19. doi: 10.1038/nrm1784. [DOI] [PubMed] [Google Scholar]
- 17.Shotton D.M. The proteins of the erythrocyte membrane. In: Harris J.R., editor. Vol. 4. Academic Press; London: 1983. pp. 205–330. (Electron Microscopy of Proteins). [Google Scholar]
- 18.Steck T.L., Kant J.A. Preparation of impermeable ghosts and inside-out vesicles from human erythrocyte membranes. Methods Enzymol. 1974;31:172–180. doi: 10.1016/0076-6879(74)31019-1. [DOI] [PubMed] [Google Scholar]
- 19.Gov N.S. Active elastic network: cytoskeleton of the red blood cell. Phys. Rev. E Stat. Nonlin. Soft Matter Phys. 2007;75:011921. doi: 10.1103/PhysRevE.75.011921. [DOI] [PubMed] [Google Scholar]
- 20.Li J., Lykotrafitis G., Suresh S. Cytoskeletal dynamics of human erythrocyte. Proc. Natl. Acad. Sci. USA. 2007;104:4937–4942. doi: 10.1073/pnas.0700257104. [DOI] [PMC free article] [PubMed] [Google Scholar]
- 21.Frank C., Frielinghaus H., Richter D. Hydrophilic alcohol ethoxylates as efficiency boosters for microemulsions. Langmuir. 2008;24:6036–6043. doi: 10.1021/la800360m. [DOI] [PubMed] [Google Scholar]
- 22.Nikolov V., Lipowsky R., Dimova R. Behavior of giant vesicles with anchored DNA molecules. Biophys. J. 2007;92:4356–4368. doi: 10.1529/biophysj.106.100032. [DOI] [PMC free article] [PubMed] [Google Scholar]
- 23.Tsafrir I., Caspi Y., Stavans J. Budding and tubulation in highly oblate vesicles by anchored amphiphilic molecules. Phys. Rev. Lett. 2003;91:138102. doi: 10.1103/PhysRevLett.91.138102. [DOI] [PubMed] [Google Scholar]
- 24.Tsafrir I., Sagi D., Arzi T., Stavans J. Pearling instabilities of membrane tubes with anchored polymers. Phys. Rev. Lett. 2001;86:1138–1141. doi: 10.1103/PhysRevLett.86.1138. [DOI] [PubMed] [Google Scholar]
- 25.Auth T., Gompper G. Self-avoiding linear and star polymers anchored to membranes. Phys. Rev. E Stat. Nonlin. Soft Matter Phys. 2003;68:051801. doi: 10.1103/PhysRevE.68.051801. [DOI] [PubMed] [Google Scholar]
- 26.Eisenriegler E., Hanke A., Dietrich S. Polymers interacting with spherical and rodlike particles. Phys. Rev. E. 1996;54:1134–1152. doi: 10.1103/physreve.54.1134. [DOI] [PubMed] [Google Scholar]
- 27.Lipowsky R. Flexible membranes with anchored polymers. Colloids Surf. A Physicochem. Eng. Asp. 1997;128:255–264. [Google Scholar]
- 28.Auth T., Gov N.S., Safran S.A. Filament networks attached to membranes: cytoskeletal pressure and local bilayer deformation. N. J. Phys. 2007;9:430. [Google Scholar]
- 29.Reference deleted in proof.
- 30.Auth T., Safran S.A., Gov N.S. Fluctuations of coupled fluid and solid membranes with application to red blood cells. Phys. Rev. E Stat. Nonlin. Soft Matter Phys. 2007;76:051910. doi: 10.1103/PhysRevE.76.051910. [DOI] [PubMed] [Google Scholar]
- 31.Gov N.S., Safran S.A. Red blood cell membrane fluctuations and shape controlled by ATP-induced cytoskeletal defects. Biophys. J. 2005;88:1859–1874. doi: 10.1529/biophysj.104.045328. [DOI] [PMC free article] [PubMed] [Google Scholar]
- 32.Podgornik R. Surface polymer network model and effective membrane curvature elasticity. Phys. Rev. E Stat. Phys. Plasmas Fluids Relat. Interdiscip. Topics. 1995;51:3368–3375. doi: 10.1103/physreve.51.3368. [DOI] [PubMed] [Google Scholar]
- 33.Liu S.C., Derick L.H., Palek J. Visualization of the hexagonal lattice in the erythrocyte membrane skeleton. J. Cell Biol. 1987;104:527–536. doi: 10.1083/jcb.104.3.527. [DOI] [PMC free article] [PubMed] [Google Scholar]
- 34.Takakuwa Y., Mohandas N. Modulation of erythrocyte membrane material properties by Ca2+ and calmodulin. Implications for their role in regulation of skeletal protein interactions. J. Clin. Invest. 1988;82:394–400. doi: 10.1172/JCI113611. [DOI] [PMC free article] [PubMed] [Google Scholar]
- 35.Liu F., Mizukami H., Ostafin A. Calcium-dependent human erythrocyte cytoskeleton stability analysis through atomic force microscopy. J. Struct. Biol. 2005;150:200–210. doi: 10.1016/j.jsb.2005.02.001. [DOI] [PubMed] [Google Scholar]
- 36.Auth T., Gompper G. Budding and vesiculation induced by conical membrane inclusions. Phys. Rev. E Stat. Nonlin. Soft Matter Phys. 2009;80:031901–031910. doi: 10.1103/PhysRevE.80.031901. [DOI] [PubMed] [Google Scholar]
- 37.Breidenich M., Netz R.R., Lipowsky R. The shape of polymer-decorated membranes. Europhys. Lett. 2000;49:431–437. [Google Scholar]
- 38.Helfrich W. Elastic properties of lipid bilayers: theory and possible experiments. Z. Naturforsch. [C]. 1973;28:693–703. doi: 10.1515/znc-1973-11-1209. [DOI] [PubMed] [Google Scholar]
- 39.Lipowsky R. The conformation of membranes. Nature. 1991;349:475–481. doi: 10.1038/349475a0. [DOI] [PubMed] [Google Scholar]
- 40.Tu Z.C., Ou-Yang Z.C. Lipid membranes with free edges. Phys. Rev. E Stat. Nonlin. Soft Matter Phys. 2003;68:061915. doi: 10.1103/PhysRevE.68.061915. [DOI] [PubMed] [Google Scholar]
- 41.Seifert U., Berndl K., Lipowsky R. Shape transformations of vesicles: phase diagram for spontaneous- curvature and bilayer-coupling models. Phys. Rev. A. 1991;44:1182–1202. doi: 10.1103/physreva.44.1182. [DOI] [PubMed] [Google Scholar]
- 42.Veksler A., Gov N.S. Phase transitions of the coupled membrane-cytoskeleton modify cellular shape. Biophys. J. 2007;93:3798–3810. doi: 10.1529/biophysj.107.113282. [DOI] [PMC free article] [PubMed] [Google Scholar]
- 43.Grati M.h., Schneider M.E., Kachar B. Rapid turnover of stereocilia membrane proteins: evidence from the trafficking and mobility of plasma membrane Ca2+-ATPase 2. J. Neurosci. 2006;26:6386–6395. doi: 10.1523/JNEUROSCI.1215-06.2006. [DOI] [PMC free article] [PubMed] [Google Scholar]
- 44.Lew V.L., Daw N., Tiffert T. Distribution of plasma membrane Ca2+ pump activity in normal human red blood cells. Blood. 2003;102:4206–4213. doi: 10.1182/blood-2003-06-1787. [DOI] [PubMed] [Google Scholar]
- 45.Blum J.J., Lawler G., Shin I. Effect of cytoskeletal geometry on intracellular diffusion. Biophys. J. 1989;56:995–1005. doi: 10.1016/S0006-3495(89)82744-4. [DOI] [PMC free article] [PubMed] [Google Scholar]
- 46.Mabrouk E., Cuvelier D., Li M.-H. Bursting of sensitive polymersomes induced by curling. Proc. Natl. Acad. Sci. U.S.A. 2009;106:7294–7298. doi: 10.1073/pnas.0813157106. [DOI] [PMC free article] [PubMed] [Google Scholar]
- 47.Treeck M., Zacherl S., Gilberger T.W. Functional analysis of the leading malaria vaccine candidate AMA-1 reveals an essential role for the cytoplasmic domain in the invasion process. PLoS Pathog. 2009;5:e1000322. doi: 10.1371/journal.ppat.1000322. [DOI] [PMC free article] [PubMed] [Google Scholar]
- 48.Dluzewski A.R., Zicha D., Gratzer W.B. Origins of the parasitophorous vacuole membrane of the malaria parasite: surface area of the parasitized red cell. Eur. J. Cell Biol. 1995;68:446–449. [PubMed] [Google Scholar]
- 49.Olson J.,, Kilejian A. Involvement of spectrin and ATP in infection of resealed erythrocyte ghosts by the human malarial parasite, Plasmodium falciparum. J. Cell Biol. 1982;95:757–762. doi: 10.1083/jcb.95.3.757. [DOI] [PMC free article] [PubMed] [Google Scholar]
- 50.Tiffert T., Lew V.L., Mohandas N. The hydration state of human red blood cells and their susceptibility to invasion by Plasmodium falciparum. Blood. 2005;105:4853–4860. doi: 10.1182/blood-2004-12-4948. [DOI] [PMC free article] [PubMed] [Google Scholar]
- 51.De Matteis M.,, Morrow J. Spectrin tethers and mesh in the biosynthetic pathway. J. Cell Sci. 2003;113:2331–2343. doi: 10.1242/jcs.113.13.2331. [DOI] [PubMed] [Google Scholar]
Associated Data
This section collects any data citations, data availability statements, or supplementary materials included in this article.