

Abstract
Bone morphogenetic proteins (BMPs) play a crucial role during embryonic development and regulate processes as diverse as neurogenesis, skeletal formation, and hematopoesis. They signal through a hetero-oligomer complex of BMP receptors. Binding of the ligand to the receptors activates several pathways, including Smad and p38. BMP signaling is controlled in the extracellular space, the plasma membrane, and the intracellular space; however, the mechanism of receptor signaling at the plasma membrane and proteins that regulate this process still need to be identified. The experiments presented here identify the protein kinase casein kinase II (CK2) as a BMP receptor type Ia (BRIa) interacting protein. Fluorescence resonance energy transfer revealed that this interaction occurs at the plasma membrane. BMP2 stimulation of C2C12 cells leads to the release of CK2 from BRIa. Blocking this interaction with specific peptides that inhibit the binding sites for CK2 on BRIa demonstrated a redistribution of BRIa on the plasma membrane. Signaling was initiated once CK2 was released from BRIa, leading to the mineralization of C2C12 cells. These data suggest that CK2 is a negative regulator of BMP signaling and osteoblast differentiation.
Introduction
Bone morphogenetic proteins (BMPs) regulate diverse processes including skeletal formation, embryonic development, hematopoesis, and neurogenesis (1,2). They form a large subgroup of the transforming growth factor-β (TGF-β) superfamily, consisting of over 20 proteins found in humans (3). BMP2 is one of the most studied and is crucial for osteoblast differentiation during healing of bone fractures (4). BMPs initiate signaling through binding of two types of receptors, type I and type II, both of which are serine/threonine kinases. Currently, three type I and three type II receptors have been identified, of which BMP receptor type Ia (BRIa) and BMP receptor type II (BRII) are being extensively investigated. Signaling is initiated with BMPs binding to the high-affinity receptor type I and then to the type II receptor, a constitutively active kinase that phosphorylates the type I receptor, which in turn activates various signaling pathways: Smad, p38, and the Map kinases (1,5,6).
BMP receptors (BMPRs) are segregated on the plasma membrane in caveolae and clathrin-coated pits (CCPs) (7–10). Caveolae are flask-shaped invaginations of the plasma membrane where proteins are stored or signal transduction occurs. Two caveolar populations have been identified; one enriched with the protein caveolin-1 (Cav1) β isoform and the other enriched with both α and β isoforms of Cav1 (9,11). CCPs are centers for endocytosis of proteins, including BMPRs (8,12). Both of these domains regulate BMP signaling, but the mechanism is unclear due to a multitude of conflicting results. Furthermore, BMPRs shuttle to caveolae enriched with Cav1 α and β, and a fraction of BRIa shifts to CCPs (7,10). In addition to shuttling between membrane domains, the organization of BMPRs changes as well. To date, there are no known proteins involved with the shuttling and reorganization of BRIa (7,13). Therefore, novel protein interactions with BRIa were investigated to determine possible interactions involved with the relocalization of BRIa. Casein kinase II (CK2) was identified through a protein domain search as a possible BRIa-interacting protein.
CK2 is a highly conserved, ubiquitously expressed enzyme with >300 substrates affecting many cellular processes such as cell growth, proliferation, differentiation, apoptosis, and tumorigenesis (14). It is a tetramer of four subunits, consisting of two regulatory β-subunits and two catalytic subunits (α and/or α′) (15). The two β-subunits aid the assembly of the tetrameric CK2 complex, as well as recruitment and docking of CK2 substrates (16). The catalytic activity is targeted to substrates at serine, threonine, and, less favorably, tyrosine residues. Activity is localized to the membrane-associated cell fractions (17).
The BMP signal is regulated at the membrane surface, yet this mechanism and the proteins involved are largely unknown. In the experiments described here, we identified a novel interaction between BRIa and CK2 at the cell surface. Ligand stimulation by BMP2 led to the release of CK2 from BRIa. Blocking this interaction with specifically designed peptides resulted in ligand-independent signaling and osteoblast differentiation. The blocking peptides also led to a redistribution of BRIa at the cell surface. Taken together, these results suggest that CK2 negatively regulates BMP signaling and osteoblast differentiation.
Materials and Methods
Materials
Recombinant BMP2 was obtained from R&D systems (Minneapolis, MN). Protein G sepharose was purchased from GE Healthcare (Piscataway, NJ). Polyclonal goat antisera against BRIa, Alexa 546 conjugated donkey antigoat IgG, fluorescein isothiocynate conjugated monoclonal mouse antibody 12CA5 against the HA tag (18), and horseradish peroxidase conjugated goat antidonkey IgG were purchased from Santa Cruz Biotechnology (Santa Cruz, CA). Horseradish peroxidase goat antirabbit IgG was purchased from Sigma Aldrich (St. Louis, MO). The cell line C2C12 was purchased from American Type Culture Collection (Manassas, VA). All antibodies were tested for specificity as previously reported (19–22). The HA epitope tag does not affect the activity of the BMP receptors (13,21). All CK2 mutants were obtained from Dr. Litchfield.
Cotransfection of C2C12 cells
Murine myoblast cells (C2C12) were grown in Dulbecco's modified Eagle's medium supplemented with 10% fetal bovine serum (Gemini Bio-Products, West Sacramento, CA) and 1% penicillin/streptomycin and transfected either by lipofectamine 2000 (Invitrogen, Carlsbad, CA) for reporter gene assays or turbofect (Fermentas, Glen Burnie, MD) for western blots. Plasmids (1 μg) or 200 pM of the small interfering RNA (siRNA) (Santa Cruz Biotechnology) against the CK2 α-subunit or a random control (GCUCAGAUCAAUACGGAGAdTdT) was used for transfections.
Antibodies
All antibodies were tested for labeling saturation. Fixed cells were labeled with various concentrations of antibodies, and images were collected. The fluorescence intensity was then graphed (Fig. S1 A in the Supporting Material). The antibody concentration corresponding to the region where the intensity did not change with decreased concentration (Fig. S1 A, star) was chosen. The region with high antibody concentrations represented unspecific binding, whereas low antibody concentrations were not effective in saturating all sites. In addition, we assume that there is a 1:1 ratio for antibody binding to protein. Labeling of BRIa is shown in Fig. S1 A. Similar results were seen with the other antibodies.
Fluorescence resonance energy transfer
Fluorescence resonance energy transfer (FRET) measures the energy transfer between a donor chromophore on one protein and an acceptor chromophore on another protein (23,24). C2C12 cells were grown and stimulated with CK2 peptides (40 nM). Subsequent to blocking, BRIa was labeled with polyclonal goat antibody followed by Alexa 546 donkey antigoat. The CK2 β-subunits were labeled with polyclonal rabbit antibody followed by Alexa 488 goat antirabbit.
Confocal images for FRET were taken using an Olympus (Melville, NY) Fluoview 300 equipped with an Ar/Kr (30 mW) mixed gas laser with the appropriate filter sets for dual fluorophore imaging. Images were taken in sequential mode at high resolution of 512 × 512 pixels, with a 63× objective at the individual cell surface, removed from the nucleus (Fig. S1 B, asterisk). The filter was set for 488 nm laser excitation to measure the Alexa Fluor 488 fluorescence, total laser power was 25.25%, gain (voltage) on the photomultiplier (PM) was set to 780, and emission was collected between 505 nm and 525 nm. The filter was then shifted to laser excitation of 565 nm to measure Alexa 546 at 26.25% of total laser power. The PM was set to 780 and emission was collected with a filter of 585–620 nm. Each image is an average of four scans with a dwell time of 8 μs/pixel. Forster's distance for these fluorophores was calculated to be 32 Å. FRET was performed as previously described, with the exception that the acceptor was BRIa and the donor was CK2 β (7).
Image correlation spectroscopy
Confocal images were taken with a Zeiss LSM 510 system equipped with Ar/Kr (30 mW) and He/Ne (5 mW) lasers. The 568-nm laser excitation was used at 33% total power to measure Alexa 568, with filters set to 585–620 nm. All images were taken in sequential mode for minimal cross talk at a high resolution of 512 × 512 pixels with a 63× objective at the individual cell surface that is distant from the nucleus. Images were analyzed by using the family of image correlation spectroscopy (7,25). Image correlation spectroscopy (ICS) is used to study the distribution of receptors (26–29). ICS involves autocorrelation analysis of the intensity fluctuations within confocal images collected from cells that contain immunofluorescently labeled proteins. Each fluorophore was excited at the indicated wavelengths and images were taken with the corresponding filter. The analysis provides a cluster density (CD) value that measures the average number of receptor clusters/unit area. Sample autocorrelation function is presented in Fig. S2. The beam width was experimentally determined to be 0.57 μm for excitation at 568 nm. Data were derived using Eq. 1 (9,25).
| (1) |
ICS was corrected for white noise and background as described by Petersen and colleagues (25,31).
Knockdown of CK2-α
At 18 h after transfection, cells were fixed and the CK2 α-subunit was immunofluorescently labeled using a polyclonal CK2-α antibody, as described above. The fluorescent signal from individual cells was measured using the confocal microscope. Background noise was subtracted before normalizing the data for intensity.
Reporter gene assays
Reporter gene assays were performed as described previously (7), except that 1 μg of plasmids and 200 pM siRNA were used. Cells were incubated overnight with 40 nM peptides or 20 nM BMP2.
Design of blocking peptides
A prosite search that included patterns with a high probability of occurrence on BRIa yielded three possible CK2 phosphorylation sites. These sites were located at amino acids 213–217 (SLKD), 324–328 (SLYD), and 475–479 (SYED). Peptides were designed with the Antennapedia homeodomain signal sequence for cellular uptake and incorporated one of the following binding sites: CK2.1 (SYED), CK2.2 (SLYD), or CK2.3 (SLKD). The peptides also included several amino acid residues flanking each side, creating a total length of 27 amino acids (CK2.1) and 29 amino acids (CK2.2 and CK2.3) (32).
Immunoprecipitation and Western blots
C2C12 cells at 90% confluency in 60-mm dishes were serum-starved for 12 h. Cells were then either stimulated or not stimulated with 40 nM BMP2 or 100 nM of peptides CK2.1, CK2.2, or CK2.3 for 18 h. Cells were lysed as described previously, except that 60 mM octyl glucoside was added, and were normalized for total protein content, which was measured using Nanodrop (7). Immunoprecipitation (IP) studies used protein G sepharose, 10 ng/ml of antibody for BRIa, or β-subunits of CK2. All IPs were performed at room temperature, shaking for 1 h. Samples were separated on 15% SDS PAGE gel. After electrotransfer of protein to nitrocellulous membrane, blots were blocked for 30 min with 3% BSA/TBS-T (Tris-buffered saline with Tween20) at room temperature. Membranes were blotted for proteins CK2 β or BRIa. As a negative control for IPs, BRIa blocking peptides (Santa Cruz Biotechnology) were used at a 10-times-higher molar concentration to block the interaction between BRIa and its corresponding antibody. Loading controls included stripping blots with Restore Western Blotting Stripping Buffer from Thermo Scientific (Rockford, IL) and blotting for the immunoprecipitated protein.
Von Kossa
After being serum-starved for 12 h, C2C12 cells were stimulated or not stimulated with 40 nM BMP2, or 100 nM peptides CK2.1, CK2.2, or CK2.3 for 8 days. The medium was not changed during this time. Cells were washed with cold phosphate-buffered saline, fixed with 4% parafomaldehyde, and incubated with 5% silver nitrate under strong ultraviolet light for 30 min. After that time cells were washed with water for removal of silver nitrate and background. Mineralization appeared as a black stain. Once dried, wells were scanned using an HP scanner, and images were analyzed with ImageJ. The surface area of the stain was quantified using the Analyzing Particles function of ImageJ, which can be used to calculate areas of mineralization. The high-magnification images were taken with a Nikon (Tokyo, Japan) TMS manual mode 125 with phase 2.
Statistics
The mean ± SD and mean ± SE values were calculated from the raw data at the 95% confidence level. Experiments were performed three times. For both ICS and FRET measurements, 40 images of individual cells were taken per slide from three slides.
Results
CK2 was identified as a new BRIa-interacting protein (Fig. 1). C2C12 cells (murine myoblasts), were grown to a confluency of 90%. After serum starvation, cells were either stimulated with 40 nM BMP2 or nonstimulated. Cells were lysed and normalized to total protein content. Antibodies against BRIa or CK2 subunit β were used for co-IP studies, and the interaction was investigated by western blot. These experiments revealed that BRIa interacts with the CK2 subunit β (Fig. 1 upper). Reciprocals showed similar results (Fig. 1 lower). For negative controls, blocking peptides used to inhibit the antibody's ability to recognize BRIa were added to lysates, followed by IP of BRIa. No bands were detected for BRIa and CK2 β-subunit. Fig. 1 also revealed decreased interaction between BRIa and CK2-β with BMP2 stimulation. The reciprocal did not show this decreased interaction. All blots were stripped and reprobed for the immunoprecipitated protein to verify equal pull-down, which was present.
Figure 1.
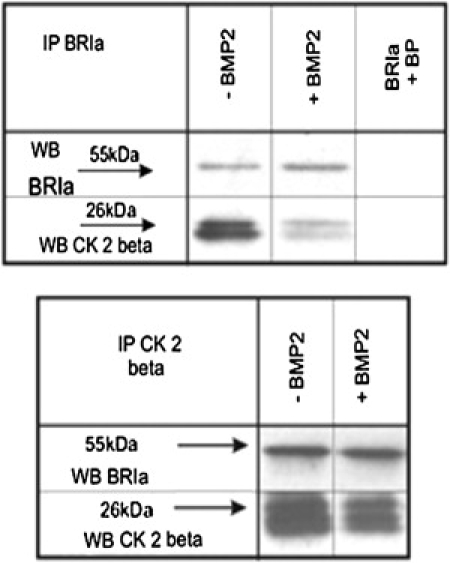
The interaction between BRIa and the CK2 subunit β is dependent upon BMP2. (Upper) Control and BMP2-stimulated cells were coimmunoprecipitated for BRIa and blotted for the CK2 β-subunit. The appearance of a band indicated an association between BRIa and the CK2 β-subunit. The addition of BMP2 led to a decrease of BRIa-CK2 interaction. As a negative control, blocking peptides (BP) were added during the IP to block the pull-down of BRIa. There was no CK2 β-subunit band with the blocking of BRIa pull-down. As for positive controls, blots were stripped and reprobed for the IP protein. (Lower) The reciprocal of the upper blot. The blots shown are representative.
Design of peptides blocking the BRIa-CK2 interaction
The CK2 β-subunit interacted with BRIa, and therefore, a motif search was performed with Prosite to reveal possible sites for this interaction. The search resulted in three possible consensus CK2 sequences in the mouse BRIa (amino acid residues 213–217, 324–328, and 475–479). Three peptides, each incorporating one amino acid sequence, were designed (CK2.1, CK2.2, and CK2.3). In addition to the sequence, these peptides contained the Antennapedia homeodomain (HD) signal sequence to allow for enhanced cellular uptake. This HD was used previously to create a chimera for internalization of a peptide encoding the caveolin-1 scaffolding domain (32). As a control peptide, only the HD was used. Serum-starved C2C12 cells were stimulated with 100 nM CK2 peptides. Cells were lysed and immunoprecipitated for CK2 subunit β and BRIa followed by western blot for BRIa and CK2 β-subunit, respectively. Using this approach, the association of CK2-β to BRIa was decreased (Fig. 2 A, upper). The reciprocal showed similar results (Fig. 2 A, lower). As controls, blots were stripped and reblotted for the IP protein.
Figure 2.
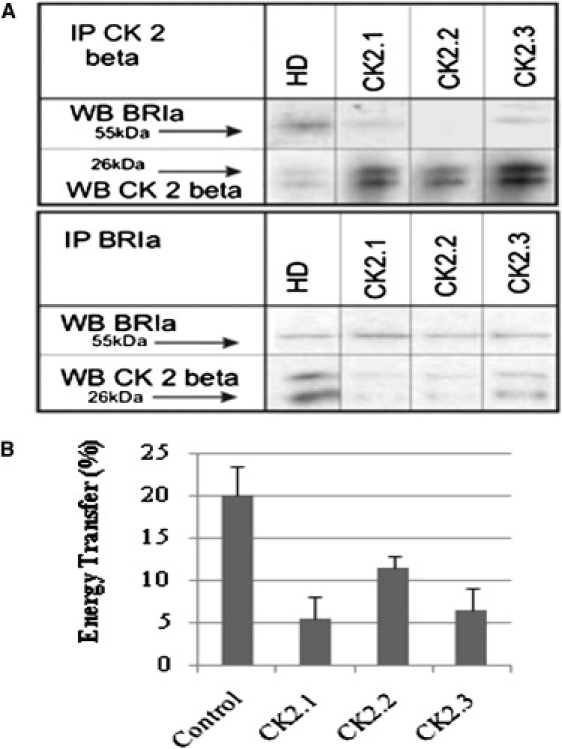
Peptides block the interaction between BRIa and CK2. (A) Cells were stimulated with the control peptide (HD) or designed peptides CK2.1, CK2.2, and CK2.3, followed by lysis, normalization of protein content, and IP with the CK2 β-subunit antibody. Western blots were probed for BRIa, then stripped and reprobed for CK2 β-subunit as an IP control. The addition of designed peptides led to a decrease in band intensity. Reciprocal IP is shown in the lower panel. The blots shown are representative. (B) Cells stimulated with peptides were fixed and dual-labeled for BRIa and the CK2 β-subunit, as described earlier. The addition of peptides resulted in a reduced energy transfer between BRIa and CK2-β. The error bars depict the SE of five independent experiments (p < 0.05).
Since CK2-β is known to bind with its substrates, FRET was used to determine whether the CK2 peptides inhibited the interaction between BRIa and CK2-β. FRET measures the interaction of proteins within 100 Å of each other. Therefore, serum-starved C2C12 cells stimulated with the peptides were dually immunofluorescently labeled for BRIa and CK2-β using the primary and secondary antibodies, as described earlier. High-magnification images of flat regions on the plasma membrane were collected, and FRET was measured. Fig. 2 B revealed that FRET was significantly decreased: 75% with the addition of the blocking peptides CK2.1 and CK2.3, but only 50% with CK2.2. Taken together, the BRIa-CK2 interaction was at the membrane surface, and all three peptides, CK2.1, CK2.2, and CK2.3, were able to inhibit the BRIa-CK2 interaction.
Inhibition of the CK2-BRIa interaction led to the activation of the Smad signaling pathway
The results indicated an interaction between BRIa and the CK2 β-subunit. In addition, peptides were designed to block this interaction. To examine whether the CK2-BRIa interaction had a functional role in Smad signaling, reporter gene assays were performed with the addition of peptides or siRNA for CK2 α-subunit. The CK2 α-subunit was knocked down to investigate the role of the catalytic subunit. First, siRNA against the CK2 α-subunit was used to knock down the CK2 α-subunit (Fig. 3 A). To achieve this, C2C12 cells were transfected with siRNA for CK2 α, control siRNA, or no siRNA. Cells were fixed and fluorescently labeled for CK2-α as described before. High-magnification images of flat regions of the membrane were collected, and the intensity of CK2-α expression on the cell surface was determined. Fig. 3 A shows the intensity of CK2-α from the images. There was a 40% downregulation of CK2-α at the cell surface.
Figure 3.
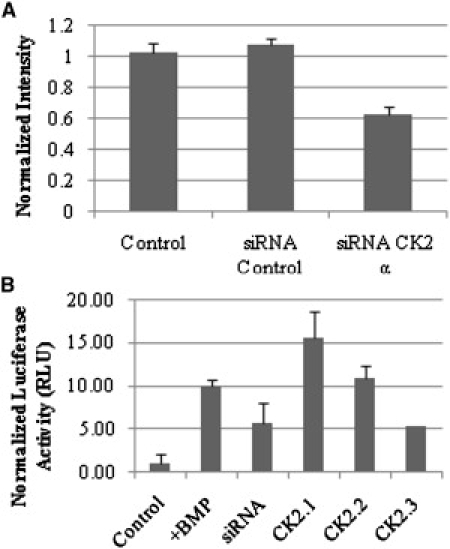
Blocking of the BRIa-CK2 interaction by peptides led to Smad-dependent signaling. (A) C2C12 cells were transfected with control siRNA or with siRNA against the CK2 α-subunit. Cells were then fixed and immunofluorescently labeled for CK2 α-subunit. The fluorescent signal was measured using a confocal microscope. CK2-α expression was downregulated by 40%. The error bars depict the SD (p < 0.05). (B) Cells transfected with pSBE and pRLuc were incubated with BMP2 or peptides to block the interaction of BRIa and CK2. For the siRNA luciferase assay, plasmids encoding pSBE, pRLuc, and the CK2 α-subunit siRNA were cotransfected. Presence of the peptides or CK2-α siRNA led to BMP-independent Smad signaling (p < 0.05).
To define the effect of the catalytic subunit CK2 α on BMP signaling, C2C12 cells were transfected with plasmids encoding the pSBE (Smad binding element fused to firefly luciferase) and pRLuc (Renilla luciferase plasmid, used for normalization). Cells were transfected with siRNA against CK2-α, stimulated with peptides CK2.1, CK2.2, or CK2.3 to block the CK2-BRIa interaction, stimulated with BMP2, or not stimulated. The results (Fig. 3 B) showed a significant increase in luciferase activity with the addition of BMP2, peptides, and the knockdown of CK2 α. Peptides CK2.1 and CK2.2 induced the highest level of Smad-dependent signaling, a 15-fold and 11-fold increase, respectively, compared to the HD. The knockdown of CK2-α and peptide CK2.3 each induced a fivefold increase. Thus, the BRIa-CK2 interaction and availability of catalytic CK2 α-subunit appeared to negatively affect Smad-dependent signaling.
Overexpression of CK2 β-subunit or a dominant negative CK2 α-subunit led to an increase in BMP signaling
The downregulation of CK2 interaction with BRIa led to the increase of BMP signaling. Therefore, the effect of overexpression of CK2 subunits α and β on BMP signaling was examined. For this experiment, serum-starved C2C12 cells were transfected with plasmids encoding pSBE and pRLuc, and plasmids encoding CK2-β, dominant negative (dn) CK2-α, or CK2-α. Although the dn CK2 α-subunit has a lysine-to-methionine substitution that renders it inactive, it is still competent for interactions with other subunits of CK2. It also shows the same localization within cells as active CK2 (22,33,34). Fig. 4 shows that the overexpression of the CK2 β-subunit and dn CK2-α led to a 100% increase of Smad-dependent signaling compared to BMP2 stimulation alone. Although there was induction of Smad-dependent signaling by blocking the interaction of BRIa and CK2 β, there was also an increase of signaling with overexpression of CK2-β and dn CK2-α. CK2-α overexpression had no effect.
Figure 4.
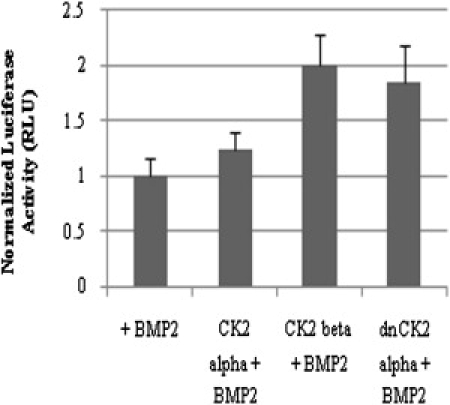
CK2-β influenced Smad-dependent signaling. Cells were transfected with plasmids encoding pSBE, pRLuc, and, where noted, CK2-β, dn CK2 α-subunit, or CK2-α. Cells were stimulated with BMP2. The overexpression of CK2 subunit β and a dn CK2-α significantly increased Smad-dependent signaling compared to BMP2 stimulation alone. CK2-α overexpression showed no change. Error bars depict the SD (p < 0.05).
Inhibition of the CK2-BRIa interaction led to a redistribution of BRIa on the plasma membrane
An increase of BMP signaling was seen with the inhibition of the CK2-BRIa interaction. For Smad-dependent signaling to occur, BMPRs must shuttle between membrane domains and change their CD (21). CD is the average number of protein clusters/unit area of the cell surface. It is possible that CK2 directs this shuttling or rearrangement of BRIa. To examine this, serum-starved C2C12 cells were either stimulated or not stimulated with the CK2 peptides for 18 h. Cells were fixed and labeled for BRIa as described earlier. High-magnification images were collected from the flat surface of cells followed by ICS analysis for the semiquantification of CD (Fig. 5). The results revealed a 25% decrease of CD for BRIa with the addition of peptides CK2.1 and CK2.3. Peptide CK2.2 led to a decrease of 20%. This is similar to the decrease observed with BMP2 stimulation. The overall intensity of BRIa at the cell surface showed no difference between treatments (data not shown).
Figure 5.
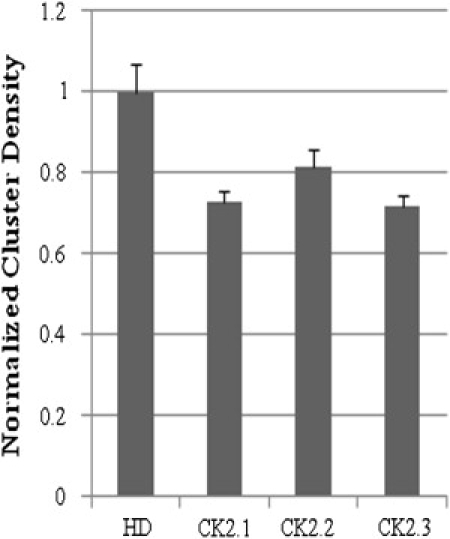
Cluster density is affected by the BRIa-CK2 interaction. C2C12 cells were stimulated with HD, CK2.1, CK2.2, or CK2.3 for 18 h, then fixed and labeled for BR1a. ICS analysis revealed that the BRIa CD decreased 20% with peptide CK2.2 and 25% with peptides CK2.1 and CK2.3. Error bars depict the SD (p < 0.05).
Block of the BRIa-CK2 interaction led to mineralization
The previous results showed that BRIa interacted with CK2 on the plasma membrane. The blocking of this interaction led to the activation of Smad-dependent signaling. Further, the peptides redirected the BRIa to a different location on the plasma membrane. Overexpression of the CK2 β-subunit and the dn CK2 α-subunit increased Smad-dependent signaling in the presence of BMP2. To investigate whether the loss of CK2 interaction with BRIa can lead to mineralization by C2C12 cells, serum-starved cells were incubated with peptides or BMP2 for 8 days. Cells were fixed and von Kossa staining was performed as described in Materials and Methods. Mineralization was analyzed with ImageJ (Fig. 6 A) and light microscopy (Fig. 6 B). The results show an increased amount of mineralization in response to peptide treatment, comparable to mineralization obtained by 40 nM BMP2.
Figure 6.
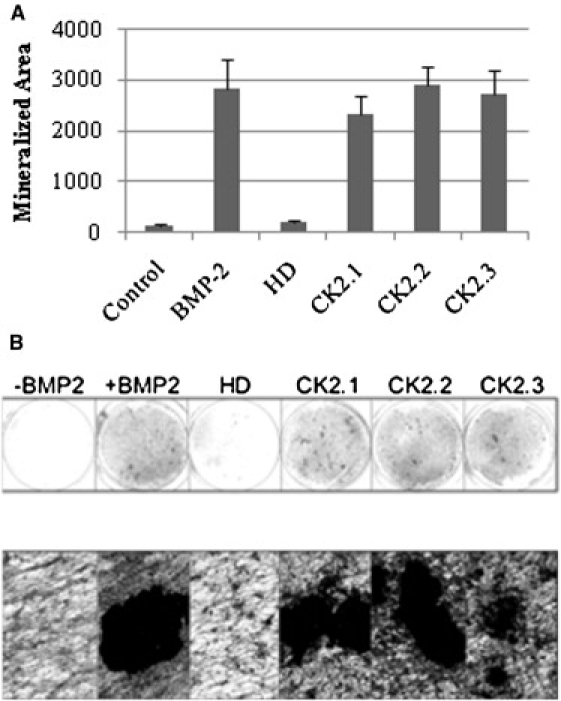
Mineralization is induced by blocking the BRIa-CK2 interaction. C2C12 cells were incubated with BMP2 or 100 nM peptides. Cells were fixed and subjected to von Kossa staining for mineralization. (A) Addition of BMP2 led to a significant increase in the area of mineralization (p < 0.05). The addition of peptides increased mineralization in a manner equivalent to that seen with BMP2 stimulation. Error bars depict the SE. (B) A representative low- and high-magnification light field image of the mineralization.
Discussion
Activation of BMP signaling pathways requires that both BMPRs, type I and type II, shuttle between caveolae and CCPs, along with receptor reorganization on the membrane surface (7,8,10,21). The mechanism of BMPR organization and shuttling at the cell surface is still poorly understood, partly due to the limited identification of proteins that interact with BMPRs. Here, evidence is presented that establishes an interaction between BRIa and CK2 and the novel regulatory role of this interaction in Smad-dependent signaling.
The tetramer of CK2 is composed of two regulatory and substrate-binding subunits (β) and two active kinase subunits (α and/or α′). Initially, the β-subunit was investigated due to its binding abilities. BRIa and the β-subunit of CK2 interacted in the absence of BMP2. An interaction also has been demonstrated between the CK2 β-subunit and ALK-1 (activinlike receptor-1) (35). Stimulation with BMP2 caused a release of the CK2 β-subunit from BRIa, as demonstrated with the co-IP by the antibody to BRIa, yet the reciprocal did not show this release. These results indicated two possible conclusions: 1), there is more than one CK2 β-subunit binding to a single BRIa; or 2), not all proteins were immunoprecipitated. A motif search did in fact yield three possible sites for CK2 phosphorylation of BRIa.
Peptides were created to specifically block each of the interacting sites. It is important to note that the peptides block the association by binding to CK2-β, not to BRIa. It is possible that these peptides have other effects, but western blots and FRET verified that the three designed peptides blocked the interaction of BRIa and CK2 β at the cell surface. Co-IP and FRET demonstrated that peptides CK2.1 and CK2.3 exerted the highest blocking function.
The Smad pathway is the most intensively studied of the BMP signaling pathways. Activation of Smad is initiated with the binding of BMP to BRIa and BRII preformed receptor complexes. BRII phosphorylates BRIa, activating the kinase activity of BRIa. Smads 1/5/8 are then phosphorylated by BRIa and form complexes with Smad4 to translocate the nucleus where it regulates gene transcription (36). Reporter gene assays were used to examine the effects of the blocking peptides on this pathway. The three blocking peptides induced Smad signaling. The greatest increase was observed with peptide CK2.1. These data signify that CK2 β-subunits are negative regulators of Smad signaling. The activation of the Smad pathway occurred in the absence of BMP2, indicating that signaling is not dependent on ligand binding but on the assembly/disassembly of regulatory proteins on the cellular membrane. However, the possibility that CK2 influences the phosphorylation state of BRIa, and that BMP signaling is regulated through this, cannot be ruled out.
CK2-β has been shown to enhance BMP signaling through its interaction with ALK-1 (35). The discrepancy could be due to the use of diverse cell types or investigation of different TGF-β superfamily receptors. The mode of signaling differs between BMPRs and TGF-β receptors. The active hetero-oligomer of TGF-β receptors shuttles to CCPs for endocytosis, where signaling occurs (12). This is not seen with BMP signaling; the receptors signal at the cell surface (8). To address these differences, overexpression studies similar to that used by Lee et al. were utilized with C2C12 cells. Stimulation by BMP2 plus either overexpression of CK2 β-subunit or a dn form of CK2 α-subunit both led to enhanced BMP Smad-dependent signaling and decreased CK2-α colocalization with BRIa. The signaling results were in agreement with those of Lee et al.
Not only is signaling initiated with BMP2 stimulation, but the CD of BRIa decreases, an indication of protein aggregation. This decrease is not due to internalization, because the cell surface receptor intensity is unchanged (21). Blocking the interaction of BRIa and CK2-β with the three peptides led to elevated BMP signaling independent of BMP2 stimulation. Therefore, the CD of BRIa in cells treated with peptides was examined. The blocking peptides initiated an aggregation of BRIa. Peptides CK2.1 and CK2.3 presented the greatest degree of aggregation. Although the CK2 peptides bind to the CK2 β-subunit and not BRIa, their effects are related to CD and mediated through the Smad pathway. This suggests that the CK2 β-subunit is a novel protein involved with the mechanism of receptor organization at the cell surface.
Inhibiting the BRIa-CK2 interaction led to receptor aggregation and signaling that is comparable to BMP2 stimulation. In C2C12 cells, BMP2 initiates osteoblast differentiation (37). It is possible that the blocking peptides could also induce osteoblast differentiation. A marker used for mature osteoblasts is mineralization, measured by von Kossa staining (38). The addition of BMP2 or the blocking peptides induced mineralization that was significantly higher than in nonstimulated and HD peptide, indicating that CK2 β-subunit/BRIa interaction can also regulate osteoblast differentiation.
In conclusion, it was demonstrated in this study that 1), the CK2 β-subunits interact with BRIa and are released upon BMP2 stimulation; 2), custom-designed peptides blocked this interaction; 3), blocking this interaction in the presence of the blocking peptides led to aggregation of BRIa; and 4), prevention of the CK2-BRIa interaction with the peptides activated the Smad pathway and induced osteoblast differentiation. Fig. 7 is a model depicting CK2 influence on BMP signaling. The CK2 β-subunit binds to the preformed complex of BMPRs. Upon BMP2 stimulation, CK2-β is released from BRIa. BRII phosphorylates BRIa, and in turn BRIa phosphorylates Smad1/5/8. The phosphorylated Smads form a complex with Smad4 that translocates to the nucleus, where it regulates gene transcription. These data suggest that the CK2 β-subunit is a novel regulator of BMPR signaling and the cell surface organization of BRIa.
Figure 7.
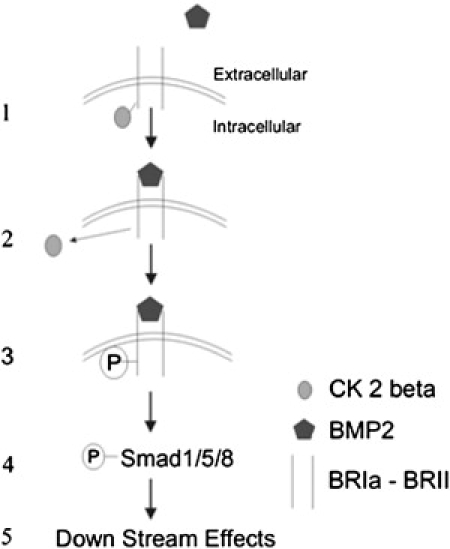
BMP signaling model including CK2-β. Shown here is an incorporation of CK2-β with the model for activation of BMP signaling. CK2-β (gray ovals) binds to preformed complexes of BRIa and BRII. There is a release of CK2-β from BRIa upon stimulation of BMP2 (pentagons). BRII phosphorylates BRIa, and BRIa then phosphorylates Smad 1/5/8. Smad4 forms a complex with phosphorylated Smad1/5/8 and translocates to the nucleus, where it regulates gene transcription and downstream effects (which would include mineralization).
Acknowledgments
We express our sincere appreciation to Drs. Wesley Beamer, Clifford Rosen, and Robert Gundersen for their support and guidance, to Betty Ingraham, Jeremy Bonor, and James Cook for laboratory support and advice, and to JoAnne Julian for her time spent reading the manuscript and her helpful suggestions.
Supporting Material
References
- 1.Chen D., Zhao M., Mundy G.R. Bone morphogenetic proteins. Growth Factors. 2004;22:233–241. doi: 10.1080/08977190412331279890. [DOI] [PubMed] [Google Scholar]
- 2.Kawai M., Hattori H., Hoshino T. Development of hemopoietic bone marrow within the ectopic bone induced by bone morphogenetic protein. Blood Cells. 1994;20:191–199. discussion, 200–191. [PubMed] [Google Scholar]
- 3.Raida M., Heymann A.C., Niederwieser D. Role of bone morphogenetic protein 2 in the crosstalk between endothelial progenitor cells and mesenchymal stem cells. Int. J. Mol. Med. 2006;18:735–739. doi: 10.3892/ijmm.18.4.735. [DOI] [PubMed] [Google Scholar]
- 4.Tsuji K., Bandyopadhyay A., Rosen V. BMP2 activity, although dispensable for bone formation, is required for the initiation of fracture healing. Nat. Genet. 2006;38:1424–1429. doi: 10.1038/ng1916. [DOI] [PubMed] [Google Scholar]
- 5.ten Dijke P., Ichijo H., Miyazono K. Activin receptor-like kinases: a novel subclass of cell-surface receptors with predicted serine/threonine kinase activity. Oncogene. 1993;8:2879–2887. [PubMed] [Google Scholar]
- 6.Nohe A., Hassel S., Knaus P. The mode of bone morphogenetic protein (BMP) receptor oligomerization determines different BMP-2 signaling pathways. J. Biol. Chem. 2002;277:5330–5338. doi: 10.1074/jbc.M102750200. [DOI] [PubMed] [Google Scholar]
- 7.Bragdon B., Thinakaran S., Nohe A. FRET reveals novel protein-receptor interaction of bone morphogenetic proteins receptors and adaptor protein 2 at the cell surface. Biophys. J. 2009;97:1428–1435. doi: 10.1016/j.bpj.2009.05.061. [DOI] [PMC free article] [PubMed] [Google Scholar]
- 8.Hartung A., Bitton-Worms K., Knaus P. Different routes of bone morphogenic protein (BMP) receptor endocytosis influence BMP signaling. Mol. Cell. Biol. 2006;26:7791–7805. doi: 10.1128/MCB.00022-06. [DOI] [PMC free article] [PubMed] [Google Scholar]
- 9.Nohe A., Keating E., Petersen N.O. Caveolin-1 isoform reorganization studied by image correlation spectroscopy. Faraday Discuss. 2004;126:185–195. doi: 10.1039/b304943d. discussion, 245–154. [DOI] [PubMed] [Google Scholar]
- 10.Nohe A., Keating E., Petersen N.O. Dynamics and interaction of caveolin-1 isoforms with BMP-receptors. J. Cell Sci. 2005;118:643–650. doi: 10.1242/jcs.01402. [DOI] [PubMed] [Google Scholar]
- 11.Fujimoto T., Kogo H., Une T. Isoforms of caveolin-1 and caveolar structure. J. Cell Sci. 2000;113:3509–3517. doi: 10.1242/jcs.113.19.3509. [DOI] [PubMed] [Google Scholar]
- 12.Di Guglielmo G.M., Le Roy C., Wrana J.L. Distinct endocytic pathways regulate TGF-β receptor signalling and turnover. Nat. Cell Biol. 2003;5:410–421. doi: 10.1038/ncb975. [DOI] [PubMed] [Google Scholar]
- 13.Gilboa L., Nohe A., Knaus P. Bone morphogenetic protein receptor complexes on the surface of live cells: a new oligomerization mode for serine/threonine kinase receptors. Mol. Biol. Cell. 2000;11:1023–1035. doi: 10.1091/mbc.11.3.1023. [DOI] [PMC free article] [PubMed] [Google Scholar]
- 14.Duncan J.S., Litchfield D.W. Too much of a good thing: the role of protein kinase CK2 in tumorigenesis and prospects for therapeutic inhibition of CK2. Biochim. Biophys. Acta. 2008;1784:33–47. doi: 10.1016/j.bbapap.2007.08.017. [DOI] [PubMed] [Google Scholar]
- 15.Litchfield D.W. Protein kinase CK2: structure, regulation and role in cellular decisions of life and death. Biochem. J. 2003;369:1–15. doi: 10.1042/BJ20021469. [DOI] [PMC free article] [PubMed] [Google Scholar]
- 16.Vilk G., Weber J.E., Litchfield D.W. Protein kinase CK2 catalyzes tyrosine phosphorylation in mammalian cells. Cell. Signal. 2008;20:1942–1951. doi: 10.1016/j.cellsig.2008.07.002. [DOI] [PubMed] [Google Scholar]
- 17.Litchfield D.W., Slominski E., Gietz R.D. Analysis of interactions between the subunits of protein kinase CK2. Biochem. Cell Biol. 1996;74:541–547. doi: 10.1139/o96-458. [DOI] [PubMed] [Google Scholar]
- 18.Wilson I.A., Niman H.L., Lerner R.A. The structure of an antigenic determinant in a protein. Cell. 1984;37:767–778. doi: 10.1016/0092-8674(84)90412-4. [DOI] [PubMed] [Google Scholar]
- 19.Gietz R.D., Graham K.C., Litchfield D.W. Interactions between the subunits of casein kinase II. J. Biol. Chem. 1995;270:13017–13021. doi: 10.1074/jbc.270.22.13017. [DOI] [PubMed] [Google Scholar]
- 20.Graham K.C., Litchfield D.W. The regulatory β subunit of protein kinase CK2 mediates formation of tetrameric CK2 complexes. J. Biol. Chem. 2000;275:5003–5010. doi: 10.1074/jbc.275.7.5003. [DOI] [PubMed] [Google Scholar]
- 21.Nohe A., Keating E., Petersen N.O. Effect of the distribution and clustering of the type I A BMP receptor (ALK3) with the type II BMP receptor on the activation of signalling pathways. J. Cell Sci. 2003;116:3277–3284. doi: 10.1242/jcs.00519. [DOI] [PubMed] [Google Scholar]
- 22.Penner C.G., Wang Z., Litchfield D.W. Expression and localization of epitope-tagged protein kinase CK2. J. Cell. Biochem. 1997;64:525–537. [PubMed] [Google Scholar]
- 23.Sorkin A., McClure M., Carter R. Interaction of EGF receptor and grb2 in living cells visualized by fluorescence resonance energy transfer (FRET) microscopy. Curr. Biol. 2000;10:1395–1398. doi: 10.1016/s0960-9822(00)00785-5. [DOI] [PubMed] [Google Scholar]
- 24.Kenworthy A.K. Imaging protein-protein interactions using fluorescence resonance energy transfer microscopy. Methods. 2001;24:289–296. doi: 10.1006/meth.2001.1189. [DOI] [PubMed] [Google Scholar]
- 25.Nohe A., Petersen N.O. Image correlation spectroscopy. Sci. STKE. 2007;2007:pl7. doi: 10.1126/stke.4172007pl7. [DOI] [PubMed] [Google Scholar]
- 26.Brown C.M., Petersen N.O. An image correlation analysis of the distribution of clathrin associated adaptor protein (AP-2) at the plasma membrane. J. Cell Sci. 1998;111:271–281. doi: 10.1242/jcs.111.2.271. [DOI] [PubMed] [Google Scholar]
- 27.Srivastava M., Petersen N.O. Diffusion of transferrin receptor clusters. Biophys. Chem. 1998;75:201–211. doi: 10.1016/s0301-4622(98)00206-3. [DOI] [PubMed] [Google Scholar]
- 28.Wiseman P.W., Hoddelius P., Magnusson K.E. Aggregation of PDGF-β receptors in human skin fibroblasts: characterization by image correlation spectroscopy (ICS) FEBS Lett. 1997;401:43–48. doi: 10.1016/s0014-5793(96)01429-9. [DOI] [PubMed] [Google Scholar]
- 29.Wiseman P.W., Petersen N.O. Image correlation spectroscopy. II. Optimization for ultrasensitive detection of preexisting platelet-derived growth factor-β receptor oligomers on intact cells. Biophys. J. 1999;76:963–977. doi: 10.1016/S0006-3495(99)77260-7. [DOI] [PMC free article] [PubMed] [Google Scholar]
- 30.Reference deleted in proof.
- 31.Keating E., Brown C.M., Petersen N.O. Mapping molecular interactions and transport in cell membranes by image correlation spectroscopy. In: Periasamy A., Day R., editors. Molecular Imaging: FRET Microscopy and Spectroscopy. Oxford University Press; 2005. pp. 284–302. [Google Scholar]
- 32.Zhu L., Schwegler-Berry D., He P. Internalization of caveolin-1 scaffolding domain facilitated by Antennapedia homeodomain attenuates PAF-induced increase in microvessel permeability. Am. J. Physiol. Heart Circ. Physiol. 2004;286:H195–H201. doi: 10.1152/ajpheart.00667.2003. [DOI] [PubMed] [Google Scholar]
- 33.Canton D.A., Zhang C., Litchfield D.W. Assembly of protein kinase CK2: investigation of complex formation between catalytic and regulatory subunits using a zinc-finger-deficient mutant of CK2β. Biochem. J. 2001;358:87–94. doi: 10.1042/0264-6021:3580087. [DOI] [PMC free article] [PubMed] [Google Scholar]
- 34.Vilk G., Saulnier R.B., Litchfield D.W. Inducible expression of protein kinase CK2 in mammalian cells. Evidence for functional specialization of CK2 isoforms. J. Biol. Chem. 1999;274:14406–14414. doi: 10.1074/jbc.274.20.14406. [DOI] [PubMed] [Google Scholar]
- 35.Lee N.Y., Haney J.C., Blobe G.C. Casein kinase 2β as a novel enhancer of activin-like receptor-1 signaling. FASEB J. 2009;23:3712–3721. doi: 10.1096/fj.09-131607. [DOI] [PMC free article] [PubMed] [Google Scholar]
- 36.Nishimura R., Hata K., Yoneda T. The role of Smads in BMP signaling. Front. Biosci. 2003;8:s275–s284. doi: 10.2741/1049. [DOI] [PubMed] [Google Scholar]
- 37.Katagiri T., Yamaguchi A., Suda T. Bone morphogenetic protein-2 converts the differentiation pathway of C2C12 myoblasts into the osteoblast lineage. J. Cell Biol. 1994;127:1755–1766. doi: 10.1083/jcb.127.6.1755. [DOI] [PMC free article] [PubMed] [Google Scholar]
- 38.Wang Y.H., Liu Y., Rowe D.W. Examination of mineralized nodule formation in living osteoblastic cultures using fluorescent dyes. Biotechnol. Prog. 2006;22:1697–1701. doi: 10.1021/bp060274b. [DOI] [PMC free article] [PubMed] [Google Scholar]
Associated Data
This section collects any data citations, data availability statements, or supplementary materials included in this article.