

Abstract
Anionic lipids are key components in the cell membranes. Many cell-regulatory and signaling mechanisms depend upon a complicated interplay between them and membrane-bound proteins. Phospholipid bilayers are commonly used as model systems in experimental or theoretical studies to gain insight into the structure and dynamics of biological membranes. We report here 200-ns-long MD simulations of pure (DMPC and DMPG) and mixed equimolar (DMPC/DMPG, DMPC/DMPS, and DMPC/DMPA) bilayers that each contain 256 lipids. The intra- and intermolecular interaction patterns in pure and mixed bilayers are analyzed and compared. The effect of monovalent ions (Na+) on the formation of salt-bridges is investigated. In particular, the number of Na+-mediated clusters in the presence of DMPS is higher than with DMPG and DMPA. We observe a preferential clustering of DMPS (and to some extent DMPA) lipids together rather than with DMPC molecules, which can explain the phase separation observed experimentally for DMPC/DMPS and DMPC/DMPA bilayers.
Introduction
The function of biological membranes goes beyond their obvious role as a physical barrier around cells or cell compartments; they are active players in many biochemical processes. Zwitterionic lipids, such as phosphatidylcholine (PC) and phosphatidylethanolamine (PE), are the major lipid components of eukaryotic membranes, which also contain a small fraction of acidic lipids such as phosphatidylserine (PS), phosphatidylglycerol (PG), and phosphatidylacid (PA). PS and PA lipids make up 5–10% and 1–4% of mammalian membranes, respectively. PG lipids are common in plants and prokaryotic membranes but are rare in eukaryotes, where they are found only in membranes of mitochondria and red blood cells (1). PS lipids are found to build lipid domains (2) or lipid rafts that play a role in the regulation of the cell cycle (3,4). In an attempt to understand biological membranes and membrane proteins, lipid bilayers have been and are still extensively studied.
However, detailed structural data of the fully hydrated liquid crystalline Lα phase, which is the most biologically relevant phase, is difficult to obtain experimentally (5). Molecular dynamics (MD) simulations are a powerful tool to describe the atomic structure and dynamics of lipid bilayers. Experimental and computational methods have become complementary techniques (for reviews, see (6–8)) and MD simulations are even integrated into the determination of structural and dynamical properties from experimental data (9,10). Simulations of pure anionic (11,12) and mixed zwitterionic/anionic lipids bilayers (13–15) have provided atomistic insights into the influence of anionic lipid PG and PS lipids on the bilayer structure.
To overcome artifacts due to size limitations of in silico bilayers and applied periodic boundary conditions, MD simulations of lipid bilayers are more reliably performed at constant area (NPAT ensemble) or constant lateral pressure (constant surface tension, NPγT ensemble) (e.g., (16,17)). The absence of bilayer undulations in small finite systems leads to an underestimated area per lipid when they are simulated at zero surface tension (16). This effect is obviously size-dependent and increasing the system size decreases the required surface tension (17,18). Two recent studies using modifications of the CHARMM force field have successfully reproduced the structural parameters of DMPC and DPPC bilayers at zero surface tension (19,20). However, the potential dependency of these parameters on system size remains an issue.
Here, we investigated three biologically relevant anionic lipid types (DMPG, DMPS, and DMPA) mixed with neutral DMPC lipids. Therefore, we performed simulations in the NPγT ensemble of bilayers composed of either 256 DMPC or 256 DMPG molecules as well as equimolar mixtures of DMPC with DMPG, DMPS, or DMPA (Fig. 1). We determined the surface tension γ required to accurately reproduce the structural properties of both neutral (DMPC) and anionic (DMPG) bilayers. We analyzed the effect of the Na+ counterions on the membranes structure, the hydrogen-bonding patterns, and the structural and dynamical properties of the bilayers with different lipid types. We simulated mixtures of DMPC with DMPG, DMPS, and DMPA under the same conditions (i.e., of system size and ion concentration) to enable a direct comparison of the effects of different anionic headgroups on the membrane properties.
Figure 1.
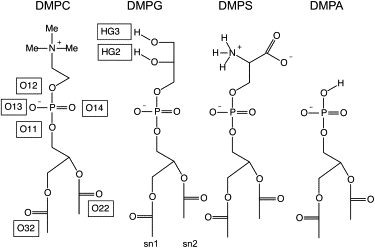
Atomic structures of the simulated lipids (atom names according to the CHARMM27 force field (24)).
Methods
We calibrated the surface tension for pure DMPC and DMPG bilayers from constant area simulations (NPAT). For DMPS and DMPA bilayers, no structural data is available. Therefore, calibration of the simulation parameters must rely on nonstructural data. We applied, for all three mixtures, the arithmetic mean of the DMPC and DMPG surface tension values. Although it is a rough approximation, the simulations results for all three mixtures agree well with the experimental estimates (for these, refer to Discussion and Conclusion). Moreover, running the simulations under the same conditions (identical surface tension γ) allowed direct comparison of the three mixtures.
Input preparation
We prepared five fully hydrated lipid bilayers containing 256 lipids each: 1) DMPC, 2) DMPG, 3) DMPC/DMPG, 4) DMPC/DMPS, and 5) DMPC/DMPA. The mixtures are equimolar. A previously equilibrated bilayer of 64 DMPC lipids (21,22) was replicated four times to form a 256-DMPC bilayer and simulated for 10 ns (NPT, γ = 0). The final set of coordinates was used as the starting set for the NPAT simulations. We also used this DMPC bilayer to build the DMPG bilayer; we replaced the choline headgroups by glycerol, using the CHARMM software (Ver. 32b1) (22). Likewise, the mixed DMPC/DMPG bilayer was set up by randomly replacing half the PC headgroups in each leaflet by PG headgroups. The same PC headgroups were substituted with either PS or PA headgroups to set up the mixed DMPC/DMPS and DMPC/DMPA bilayers, respectively. As a result, the three mixtures have identical starting lipids distribution. The systems were solvated using the SOLVATE plugin of VMD (Ver. 1.8.5) (23). Water molecules within the hydrocarbon region of the bilayer were removed. We used 24 water molecules per DMPC lipid and 48 water molecules per lipid for pure DMPG as well as all mixed bilayers. All systems were neutralized by randomly replacing the relevant number of water molecules with Na.
Force-field parameters
Force-field parameters for the lipids were taken from the CHARMM27 force field (24,25) including revised torsion potentials for lipid chains CHARMM27r (26). The missing parameters (charges, angles, and torsion angles) for the hydroxyl groups of DMPG were taken from the amino acids serine and threonine. It implies that both hydroxyl groups bear the same charges, in agreement with Pedersen et al. (27). Parameters for the DMPS headgroup were derived from the C-terminal and lysine residues, consistent with the work of Schlenkrich et al. (28).
MD simulations
We ran all simulations at a temperature of 37°C (310 K). This ensures that all bilayers of DMPC and DMPG were in the liquid-crystalline phase; DMPC/DMPA was in the fluid-crystalline phase or coexisting phase (29); and similar DMPC/DMPS mixtures were found in the fluid-crystalline phase (30). We performed all simulations using NAMD (31), in the isobaric-isothermal ensemble using the Langevin piston method (32) (target pressure, 1 atm; oscillation period, 200 fs; and damping timescale, 50 fs) and Langevin dynamics to control the temperature (310 K; damping coefficient, 1.0) during the whole simulation. For the short-range interactions (i.e., van der Waals (vdW) and electrostatics), we applied a cutoff distance of 11.0 Å and a switch distance of 8.0 Å. The particle-mesh Ewald algorithm (33) was used to estimate the long-range electrostatic forces. The equations of motion were integrated using a multiple time-step algorithm (34); bonded interactions and short-range nonbonded forces were evaluated every 2 fs, and long-range electrostatics were calculated every 4 fs. SHAKE (35) was applied to constrain the O-H bond length of water molecules. The P atoms were fixed during initial equilibration with velocities' reassignment every 100 steps, in the NPAT ensemble. The constraints were then removed, while continuing the equilibration in the NPAT ensemble for 200 ps with reassignment of the velocities every picosecond. For pure DMPG and DMPC, the last 6 ns of 8-ns-long MD simulations in the NPAT ensemble were used to determine the surface tension γ. Subsequently, simulations of pure DMPC and pure DMPG were run for 140 ns in the NPγT ensemble. The equilibration procedure of the equimolar mixtures was followed by NPγT simulations lasting for 200 ns (DMPC/DMPG, and DMPC/DMPA) and 300 ns (DMPC/DMPS). We used the arithmetic mean of the surface-tension values of DMPC and DMPG. The monitoring of the structural properties showed a stabilization of the systems within ≤40 ns. In particular, the binding of ions to the membrane was equilibrated in <40 ns (Fig. S1). Only the last 100 ns of all simulations were used for the structural analysis. These windows were chosen after careful evaluation of the evolution of the hydrogen-bonding pattern between lipid headgroups (results not shown) and evolution of the ion clustering (see Results). A detailed description of the order parameter calculation, as well as the analysis of hydrogen binding, Na+ ions binding, lipid-clustering, and calculation of the surface charge density, are given in the Supporting Material.
Results
DMPC
We ran MD simulations to calibrate lipid bilayers made of 256 lipids using the CHARMM27r force field (26). A 140-ns-long simulation with γ = 26 dyn/cm (estimated from a 8-ns simulation at NPAT; where A = 60 Å2) yielded an area per lipid of 60.0 ± 1.1 Å2 (last 100 ns). This is within the range of the experimental values (see Table 1). Similarly, the order parameters SCD agree well with experimental data (see Fig. 2 A). The simulated electron density profile (Fig. 2 B) reveals a headgroup spacing DHH of 35.7 Å, in good agreement with the values of 35.2 Å (36) and 35.3 Å (37) obtained by x-ray scattering experiments.
Table 1.
Area per lipid obtained from simulations of pure and equimolar mixtures lipid bilayers compared to the experimental estimates
| Area per lipid/Å2 | DMPC | DMPG | DMPC/DMPG | DMPC/DMPS | DMPC/DMPA |
|---|---|---|---|---|---|
| Simulation | 60.0 ± 1.1 | 61.8 ± 1.2 | 59.9 ± 1.1 | 54.7 ± 0.6 | 54.7 ± 0.7 |
| Experiment | 59.7–60.6∗ | 62† | 60–62‡ | — | — |
Taken from the literature (9,10,36,37,59).
Experimental estimate by Marra (44).
Derived from near-ideal mixing behavior (40).
Figure 2.
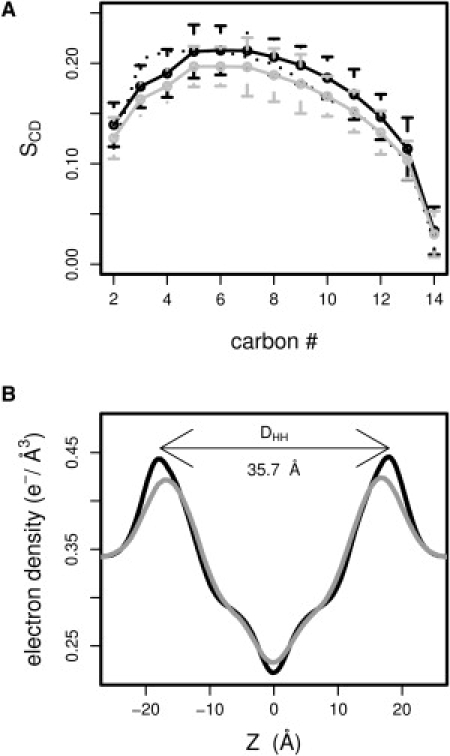
Properties of the pure DMPC (γ = 26 dyn/cm, black line) and DMPG (γ = 8 dyn/cm, gray line) bilayers. (A) Order parameters (solid line) with standard deviation are plotted for each carbon in the sn-2 chain and compared to experimental values (dotted line) (38). (B) Electron density profile. Both properties are calculated over the last 100 ns.
DMPG
Simulations at zero surface tension resulted in an area per lipid below 60 Å2 and too high order parameters (after 20 ns, the area per lipid had dropped from 61.8 Å2 to 58.4 Å2). Therefore, we adapted the strategy used for DMPC to run constant area simulations. For the modeling of DMPG, we aimed for acyl-chain order parameters bearing resemblance to the order parameters obtained for DMPC (38) and an area per lipid ∼62 ± 2 Å2 (see Discussion and Conclusion). We ran NPAT simulations at different constant areas of 62 Å2, 63 Å2, and 64 Å2 for 8 ns, with 2-ns equilibration, and compared the corresponding SCD with the experimental SCD of DMPC. The order parameters obtained for the simulations at 63 Å2 and 64 Å2 were significantly below the NMR order parameters determined for DMPC, while the parameters resulting from a constant area simulation at 62 Å2 showed a good agreement with the expected values. We calculated a surface tension of ∼10 dyn/cm and subsequently ran several NPγT simulations with values of γ at ∼10 dyn/cm. The choice of γ = 8 dyn/cm led to the best agreement with the expected value of the area per lipid and the order parameters (Fig. 2 A). Indeed we calculated an area per lipid equal to 61.8 ± 1.2 Å2 for the last 100 ns of simulation. The calculated electron density profile displays a headgroup spacing DHH of 33.8 Å (Fig. 2 B).
It has been shown that the attractive forces in the DMPC headgroup region result from charge-pairing of the choline with the negatively charged phosphate oxygens (39). Here, we investigate the intermolecular stabilization effects of the DMPG glycerol hydroxyl groups. We find that the most frequent intermolecular hydrogen bonds of the hydroxyl groups of DMPG are made with phosphate nonester oxygens. There is a significant difference in the number of hydrogen bonds formed by the hydrogen of the terminal hydroxyl group (HG3) compared to the secondary hydroxyl group (HG2) (see Fig. 1 for labeling). The average number of hydrogen bonds calculated per frame is 49.9, 17.0, and 13.0 for HG2 compared to 25.4, 7.3, and 5.9 for HG3 groups with the phosphate nonester oxygens, the ester carbonyl oxygens (O22 + O32), and the hydroxyl groups (OG2 + OG3), respectively. To evaluate the stability of these hydrogen bonds, we calculated their average lifetime. For both the HG2 and HG3 groups, hydrogen bonds with the phosphate oxygen have an average lifetime of 19 ps, and the lifetimes of hydrogen bonds with carbonyl and hydroxyl as acceptors drop to 12 ps and 9 ps, respectively (Table 2). The terminal hydroxyl group is anticipated to be more accessible than the secondary hydroxyl group for intermolecular contacts. However, the terminal hydroxyl makes only one-half as many intermolecular hydrogen bonds as the nonterminal hydroxyl. We observed that 120 out of 256 HG3 groups are involved in intramolecular hydrogen bonds (110 with O12, the phosphorus ester oxygen), whereas HG2 groups only form 15 intramolecular hydrogen bonds. The differences of HG2 and HG3 in the binding patterns as well as the preference for HG3 to bind to O12 can also be seen in the radial distribution functions plots (Fig. S2). The hydrogen bond between HG3 and O12 groups yields intramolecular six-membered rings, which are highly stable during the simulation. Therefore, intermolecular hydrogen bonds involving HG3 atoms are rare compared to the HG2.
Table 2.
Average number of intermolecular and intramolecular hydrogen bonds per frame for a 256-DMPG bilayer simulated with a surface tension γ = 8 dyn/cm
| Intermolecular |
Intramolecular |
|||
|---|---|---|---|---|
| HG2 | HG3 | HG2 | HG3 | |
| O13 and O14 | 49.9 (19) | 25.4 (19) | 12.5 (16) | 8.8 (7) |
| O11 | 7.4 (7) | 2.8 (7) | 2.3 (9) | 1.4 (5) |
| O12 | 1.9 (5) | 0.9 (5) | 0.1 (2) | 109.0 (12) |
| O22 | 9.3 (12) | 4.0 (10) | 0.9 (8) | 0.8 (9) |
| O32 | 7.7 (12) | 3.3 (10) | 0.6 (6) | 0.6 (9) |
| OG2 | 6.6 (10) | 3.0 (8) | — | 0.002 (2) |
| OG3 | 6.4 (9) | 2.9 (7) | 0.01 (2) | — |
| Total | 89.2 | 42.3 | 16.4 | 120.6 |
| 131.5 | 137.0 | |||
The average lifetime for each hydrogen bond type is given in parentheses. O13 and O14 are the phosphate nonester oxygens. HG2 and HG3 are the secondary and terminal hydroxyl groups of PG, respectively. See Fig. 1 for other atom labels.
Mixtures
Biophysical properties
We compare the 300-ns simulations at NPγT (γ = 17 dyn/cm) of the three mixtures of DMPC with anionic lipids DMPG, DMPS, and DMPA. The area per lipid of the DMPC/DMPG mixture is close to the one of pure DMPC and DMPG (Table 1). In addition, the order parameters SCD of the DMPC/DMPG mixture are similar to pure DMPC and DMPG. This is in agreement with the near-ideal mixing behavior observed experimentally (40). The bilayers containing DMPS and DMPA have a lower area per lipid (Table 1) and higher order parameters SCD (Fig. 3 A). The lipid tails of DMPC/DMPS and DMPC/DMPA mixtures are more ordered than mixed DMPC/DMPG (Fig. 3 A) as well as pure DMPC and DMPG bilayers. This is in agreement with experimental studies reporting tighter chain packing in DMPC/DMPA bilayers compared to DMPC (30).
Figure 3.
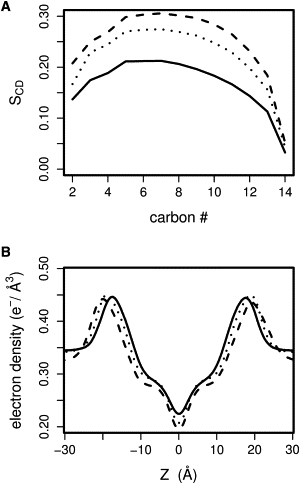
Structural properties of the mixed bilayers: DMPC/DMPG (black solid line), DMPC/DMPS (dashed line), and DMPC/DMPA (dotted line). (A) Order parameters and (B) electron density profiles (both calculated over the last 60 ns of the NPγT MD).
The PC headgroup orientation as described by the average angle of the P-N vector with the bilayer normal was at most affected by one degree compared to the pure DMPC bilayer simulation. Similar to the P-N vector of DMPC, the P-N vector (phosphorus to ammonium nitrogen) of DMPS lies almost planar to the bilayer normal (for details, see Supporting Material).
Na+-binding and intermolecular Na+-bridges
The surface charge densities for DMPC/DMPG, DMPC/DMPA, and DMPC/DMPS are −0.54, −0.57, and −0.41 e/nm2, respectively. Eisenberg et al. (41) report values of the electrokinetic potential (ζ) of equally sized vesicles made of pure DMPG, DMPA, and DMPS: −63.5, −69.0, and −62.0 mV, respectively. There is a thus a qualitative agreement between these measurements and our calculated surface charge densities. As the ζ-potential is a widely used measure of the net charge of double layers (vesicles) (42), we believe that our simulations reproduce quantitatively well the density of charge of the three mixtures.
We then calculated the average number of Na+ bound to lipids per frame, the hydration number of Na+, and the average number of Na+-lipid contacts per frame for the different lipid mixtures. We found 45.9, 70.4, and 48.6 Na+ bound to the bilayers of DMPC/DMPG, DMPC/DMPS, and DMPC/DMPA, respectively. To evaluate the strength of Na+ binding in the different bilayers, the coordination number of Na+ with different groups constituting the lipid heads need to be considered. The Na+ coordination numbers with the nonester phosphate oxygens are 0.43, 0.43, and 0.64 for mixtures of DMPC/DMPG, DMPC/DMPS, and DMPC/DMPA, respectively. The hydration number with the DMPG glycerol group in the DMPC/DMPG mixture is 0.11 and 0.88 for the carboxylate group of DMPS in the DMPC/DMPS mixture.
Based on all these values, we rank the Na+ binding affinity in the following order:
A strong preference of cations for DMPA in the presence of DMPC is also observed experimentally (30). The increased binding of Na+ to DMPG versus DMPC is a result of the Na+ binding to the glycerol groups. On the other hand, the increased binding strength of DMPA is caused by its phosphate group. The small size of the DMPA headgroup exposes the phosphate group much more than DMPC, DMPG, and DMPS where the phosphate group is shielded by either a large choline, glycerol, or serine headgroup. The highest Na+ binding affinity is observed for DMPS and is due to the strong ion binding by the carboxylate group.
Table 3 lists the number of salt-bridge pairs between different lipid atom types, in the three simulated mixtures. The average number of salt-bridge pairs per frame in the bilayers increases from DMPC/DMPG (47.3) to DMPC/DMPA (55.5) and DMPC/DMPS (168.3). The number of phosphate-phosphate salt-bridges in DMPC/DMPA (33.7) is significantly larger than in DMPC/DMPG (18.1) and DMPC/DMPS (15.5), which is consistent with the observed increased binding of Na+ to the DMPA phosphate groups. The DMPS lipid mixture is predominantly stabilized by salt-bridge pairs involving its carboxylate groups, either with another carboxylate (72.1) or a phosphate oxygen (59.5). However, for the mixture of DMPC/DMPG, we cannot observe a significant number of salt-bridge pairs involving the glycerol groups.
Table 3.
Number of sodium bridges for the equimolar mixtures of DMPC/DMPG, DMPC/DMPS, and DMPC/DMPA
| Mixture/atom groups | DMPC/DMPG | DMPC/DMPS | DMPC/DMPA |
|---|---|---|---|
| OCO-OCO | 6.2 | 2.2 | 3.8 |
| OCO-OPO | 12.7 | 10.5 | 18.0 |
| OCO-OHG | 2.6 | 8.6 | — |
| OPO-OPO | 18.1 | 15.5 | 33.7 |
| OPO-OHG | 6.9 | 59.5 | — |
| OHG-OHG | 0.9 | 72.1 | — |
| Total | 47.3 | 168.3 | 55.5 |
OPO, phosphate oxygens; OCO, ester group oxygens; and OHG, sodium bridge acceptors of the headgroups (i.e., DMPC, none; DMPG, glycerol hydroxyl oxygens; DMPS, carboxylate oxygens; and DMPA, none).
Further, we analyzed the clustering of lipids by Na+ in the three mixed bilayers. In Fig. 4, we plot the evolution along simulation time of lipid clustering around Na+. Although the initial numbers of clusters are close to zero, the numbers after 50 ns are very different for the three mixtures (Fig. 4 A), which shows that the clustering pattern we observe is independent from the starting conformation. After a steady increase during the very first phase of the NPγT simulations (Fig. 4 B), the number of clusters made of three and four lipids stabilizes, and it is thus reasonable to believe that the systems have reached equilibrium. Moreover, the migration of ions from the water phase to the interface is finished within 40 ns (see Fig. S1). We then determined the average number of Na+-mediated clusters for the last 100 ns of each simulation: 39.1 for DMPC/DMPS, 23.0 for DMPC/DMPA, and 18.6 for DMPC/DMPG with average cluster sizes of 2.50, 2.35, and 2.31, respectively. In Fig. 5, we show the number of clusters made of two, three, and four lipids around Na+ and the nature of these clusters, i.e., containing two types of lipids (gray bars), or pure clusters of DMPC (dark gray bars) and anionic lipids (light gray bars). DMPS shows a stronger tendency to cluster around Na+ and exclude neutral zwitterionic DMPC in the cluster formation than DMPA and DMPG.
Figure 4.
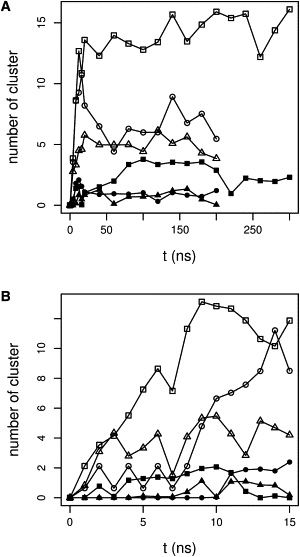
Evolution of the number of three- and four-lipids clusters around Na+ ions, along the NPγT simulations. Clusters of size three (open symbols) and clusters of size four (solid symbols) for DMPC/DMPG (triangle), DMPC/DMPA (circle), and DMPC/DMPS (square). (A) Number of clusters over the entire simulation time. (B) Number of clusters for the first 15 ns and equilibration.
Figure 5.
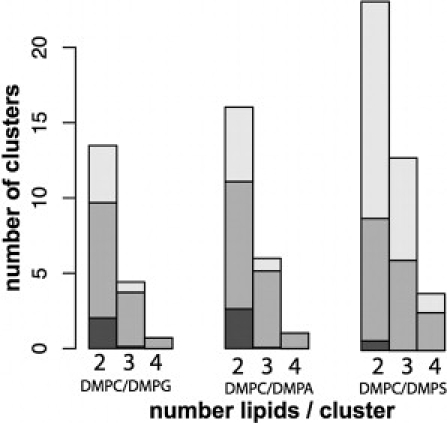
Number and composition of lipid clusters in mixed bilayers. Number of clusters (y axis) made of two, three, and four lipids (x axis). The color of the bars refers to the composition of the clusters: those clusters containing only zwitterionic DMPC lipids (dark shaded); mixed clusters of one or more DMPC and one or more anionic lipids (medium shaded); or pure anionic lipid clusters (light shaded). The numbers are averages per frame in the NPγT simulations.
Intermolecular hydrogen bonding
The choline groups of DMPC form intermolecular interactions with hydrogen-bond acceptors such as the oxygen atoms of the phosphate groups (O11 and O12, nonesters; and O13 and O14, ester oxygens), the carbonyl oxygens (O22, O32), and the hydroxyl oxygen atoms of DMPG or carboxylate oxygens in DMPS (detailed inventory is given in Supporting Material). We observe, on average, approximately one such interaction per choline group per frame and their lifetime is rather short (3.6 ps on average). This interaction pattern does not change significantly from pure DMPC to the mixtures, i.e., the DMPC choline groups form the same type of interaction with other DMPC headgroups as with DMPG, DMPS, or DMPA headgroups. Indeed very few cholines interact with the hydroxyl oxygens of DMPG or the carboxylate of DMPS and most of the interactions happen with the phosphate and ester carbonyl oxygens. This is consistent with the fact that we do not observe a reorientation of the dipole vector of DMPC when it is mixed with different anionic lipids.
In the equimolar mixture DMPC/DMPG, each glycerol group of DMPG is, on average, involved in approximately the same number of intermolecular hydrogen bonds with phosphate and carbonyl oxygens (of DMPC or DMPG) as in the DMPG bilayer. The lifetime of the interactions in the mixture and the pure bilayer is comparable. The total number of interactions is thus halved in DMPC/DMPG compared to pure DMPG (Table 2 and Table S2).
The hydrogen of the phosphoric acid of DMPA is not involved in a significant number of intermolecular hydrogen bonds, and therefore does not contribute to the stability of bilayers containing DMPA.
In the DMPC/DMPS mixture, we observe, on average per frame, a greater number of intermolecular hydrogen bonds involving the ammonium groups of DMPS than the choline groups of DMPC (i.e., 164 and 147, respectively). This increase results mostly from intermolecular hydrogen bonds (on average 50.6 per frame) between DMPS ammonium and DMPS carboxylate groups. The corresponding interaction involving one lipid of each type (DMPC choline with DMPS carboxylate) exists but is much less frequent (7.6 per frame). In addition, the average lifetime of hydrogen bonds between ammonium groups and both nonester phosphate oxygens and carboxylate groups is higher than the corresponding interactions made by the choline groups, reflecting the ability of ammonium to form more stable interactions than N(CH3)3. DMPS lipids form a significantly stronger hydrogen-bond network than DMPC lipid headgroups.
Discussion and Conclusion
The modeling of the 256 DMPC lipids bilayer with CHARMM27r required a surface tension γ = 26 dyn/cm to satisfactorily reproduce the structural observables. The use of a value of γ = 42 dyn/cm, reported to be optimum for a bilayer of 128 DMPC lipids (21), failed to reproduce the experimental area per lipid and order parameters on this bilayer containing twice the number of lipids. This agrees with the fact that the value of the surface tension required depends on the system size (number of lipids) and decreases with increasing bilayer size (18).
PG lipids are the most abundant anionic lipids in prokaryotic membranes and reliable in silico models of PG lipid bilayers and PG mixtures are needed for simulations of bacterial membrane proteins and antibacterial peptides. Unfortunately, the calibration and hence simulations of, e.g., DMPG bilayers is not straightforward due to the lack of structural data for DMPG. Moreover, the structural properties are highly dependent on the salt concentration and ion type (43). However, experimental data exist and can be used to calibrate the surface tension to be used in NPγT simulations. Marra (44) has estimated the area per lipid of a DMPG bilayer (at neutral pH, with NaCl) to be ∼62 ± 2 Å2. Later, electron-spin resonance studies showed a slightly lower melting temperature and a slightly lower S33 order parameter for DMPG lipids compared to DMPC at low salt concentrations (45). Therefore, we aimed for an area per lipid at ∼62 ± 2 Å2 and order parameters slightly below the order parameters of simulated DMPC. This was achieved by the application of a surface tension of 8 dyn/cm (for 256 DMPG lipids). We thus obtain an area per lipid of 61.8 ± 1.2 Å2. We also observed in our NPAT simulations that increasing the area per lipid led to too low order parameters compared to the experimental estimate (45). Consistently, simulations at zero surface tension led to too high order parameters and lower area per lipid. We believe that previously reported simulations of PG lipids, at zero surface tension, could have overestimated the cholesterol-like effects of anionic lipids (11,12). Similarly, the application of a surface tension was required for the DMPC/DMPG mixture, to reproduce the near-ideal mixing behavior of DMPC and DMPG (40).
The analysis of the hydrogen-bonding pattern in the pure DMPG bilayer revealed that the secondary hydroxyl groups (HG2) of DMPG participate in more than twice as many intermolecular hydrogen bonds than the terminal primary hydroxyl groups (HG3), despite the steric hindrance anticipated for the secondary hydroxyl groups. However, we observed a six-membered ring formed by a stable intramolecular hydrogen bond between the terminal hydroxyl groups (HG3) and O12, which has an average occupancy of 42%. This intramolecular hydrogen bond reduces the number of observed intermolecular hydrogen bonds formed by HG3. Our observation differs from simulation results reported by Zhao et al. (12) for a POPG bilayer; they observe intermolecular hydrogen bonds only for the terminal primary hydroxyl group, whereas all secondary hydroxyl groups (HG2) are almost exclusively involved (100% occupancy) in an intramolecular hydrogen bond with the phosphate ester oxygen O12 forming a five-membered ring. We, on the other hand, observed no significant intramolecular hydrogen binding between HG2 and O12 (occupancy 0.01%). This difference in the observed hydrogen bonding patterns of PG headgroups could be due to the different lipid tails or most probably to the use of different force fields used; Zhao et al. (12) used GROMACS whereas we used CHARMM. Upon comparing the two force fields, we can see several differences that could influence the preference for either five- or six-membered rings: the valence angles parameters, the torsion potentials, and the partial charges; and instead of a united-atom force field as in the simulations of Zhao et al. (12), we used an all-atom force field. Only comparative simulations with both force fields starting from the same bilayer conformation, and with the same lipids, could surely identify the parameters causing the disparities we observe. In the meantime, and based on chemical intuition, we believe that the interaction pattern we describe is more probable. We cannot see why all PG headgroups in a bilayer should display this intramolecular hydrogen bond leading to the formation of a five-membered ring and why no other conformation should be populated, as it is apparently the case in the simulations reported by Zhao et al. (12).
Phosphatidylcholine bilayers sense and respond to the presence of electrical charges on their surface (46,47). In our simulations the orientation of the P-N vector of DMPC show a limited effect on the anionic lipid types present (at most affected by one degree compared to pure DMPC). This is in agreement with experimental data, which demonstrate that unlike positive charges, negative charges have a limited effect on the orientation of PC headgroups (13,47,48). As PC headgroups lie almost parallel to the membrane plane, steric hindrance hinders significant reorientation toward the bilayer center (48).
The higher-order parameters and lower area per lipid that we observed for DMPC/DMPS and DMPC/DMPA mixtures compared to the DMPC/DMPG mixture pointed to a strong stabilization effect of DMPS and DMPA lipids. This is the result of stronger interactions between the headgroups of DMPC/DMPS and DMPC/DMPA compared to DMPC/DMPG. For all lipid types (DMPC, DMPG, DMPS, and DMPA), the hydration numbers and radial distribution functions revealed a preferred binding of Na+ to the phosphate groups compared to the lipid ester carbonyl groups. Experimental data showed that cations mainly bind to the phosphate oxygens. Fourier-transform infrared (FTIR) studies show that only Zn2+ and Cu2+ dehydrated the ester carbonyl oxygens, whereas the carbonyl stays hydrated in the presence of Li+, Na+, and Ca2+ (43). The changes in the carbonyl bands of the infrared spectra for Ca2+, Na+, and Li+ are interpreted as trapped water of the cation hydration shell (49). In particular for DMPS bilayers, Ca2+ chelates with phosphate groups, and FTIR finds a unique carbonyl vibrations not observed for Na+, NH4+, and Li+ (50), which is caused by hydrogen-bonding and not ion-binding. The same preferred binding to phosphate oxygens was observed for Na+ and Ca2+ in simulations of DPPG monolayers (NPT ensemble) (51) and of POPC bilayers (NAPT ensemble) (52) using the CHARMM force field. Conversely, most studies reporting simulations performed with the GROMACS force field (more precisely, the united-atom force field from (53) and also see (11,12,54–56)) show Na+ preferentially bound to carbonyl oxygens.
Lee et al. (55) interpreted the unique FTIR vibration as indirect evidence of ion binding to carbonyl groups, contrary to the view that hydrogen-bonding of trapped water of the cation water shell caused this vibration (49). This difference between results obtained with the two force fields can be attributed to either the vdW parameters of the ions (larger vdW radius in GROMACS than CHARMM) or the differences in the partial charges of the lipids headgroups. In particular, the CO dipole of the carbonyl ester groups in GROMACS has been invoked (55). Gurtovenko and Vattulainen (57) performed MD simulations of POPC and POPE bilayers using the GROMACS force field for lipids and water, and either GROMACS or CHARMM for the salts (NaCl and KCl). When the GROMACS ion parameters are used, the density profile of the Na+ coincides with the profile of the carbonyl oxygens while the use of the CHARMM ion parameters shifts the density profile slightly toward the phosphate oxygens. Poger et al. (58) recently developed lipid parameters for the new GROMACS (53A6) force field, keeping the partial charges of Berger et al. (53) (derived from QM calculations by Chiu et al. (16)) and enhancing vdW repulsion between the phosphate nonester oxygens and the choline methyl groups. To the best of our knowledge, the ion-binding properties of phospholipids (with diacylglyceride structures) with the GROMACS (53A6) force field have not been reported yet. More studies comparing the existing force fields for lipids and different ion parameterizations are needed to establish, clearly, which parameter(s) influence the behavior of monovalent and divalent ions in MD simulations, and the actual extent of such involvement.
Further, we found that Na+ is mostly bound to clusters of two lipids, whereas Zhao et al. (12) found most sodium ions bound to three lipids. This difference in Na+-lipid cluster sizes might be a result of the different ion-binding properties discussed above. The hydrogen-bonding patterns of PG headgroups in pure DMPG and in the DMPC/DMPG mixture showed no significant differences. Likewise, the number of hydrogen bonds formed by the choline groups of DMPC is not altered by the addition of anionic lipids. Additionally, the DMPC/DMPG mixture revealed only a few and short-lived hydrogen bonds of the choline group with the DMPG hydroxyl groups. The observed structural similarity of pure DMPC, pure DMPG, and DMPC/DMPG in our simulations is consistent with the near-ideal mixing of DMPC and DMPG (40). This is unlike what had been observed in MD simulations of POPE/POPG mixtures (14,15), which had showed an increased number of intermolecular hydrogen bonds through the formation of hydrogen bonds between ammonium group of PE and the hydroxyl groups of PG.
We found stronger hydrogen bonding for DMPS ammonium groups than for DMPC choline groups. However, the increased stability of mixtures containing DMPS (as well as DMPA) versus pure DMPC bilayers is mainly due to more ion-bridges as a consequence of stronger Na+ binding to DMPA and DMPS compared to DMPC. Indeed, we find that the observed ion binding strength of sodium ions to the simulated lipids increased from DMPC to DMPS, as
This is in agreement with experimental observations of increased Ca2+ affinity of DMPA versus DMPC and the high cation affinity of DMPS (2).
DMPS and DMPA show a tendency to form more clusters than DMPG. We found the lipid composition of these clusters to be highly enriched in DMPS in the DMPC/DMPS mixture and to exclude DMPC lipids. This tendency exists but is less obvious for DMPA in the DMPC/DMPA mixture. Our results are consistent with experimental data showing that DMPA and especially DMPS demonstrate a strong nonideal mixing behavior with DMPC in the presence of sodium ions. Experiments showed that phase separation of DMPS (2) and DMPA (30) containing bilayers is enhanced in the presence of Ca2+. Our simulations show a preferential clustering of DMPA and DMPS around Na+, which we believe is an important factor in the experimentally observed phase separation.
Acknowledgments
Parallab (High Performance Computing Laboratory at the University of Bergen) is acknowledged for provision of CPU time on its CRAY XT4 supercomputer, as well as their technical support. The authors also thank the Norwegian Metacenter for Computational Science for allocating CPU time to this project. Jérome Hénin and Christophe Chipot are thanked for fruitful discussions.
Funding for T.B. and N.R. was provided by the National Program for Research in Functional Genomics in Norway of the Research Council of Norway and by the Bergen Research Foundation (Bergens Forskningstiftelse).
Supporting Material
References
- 1.Uran S., Larsen A., Skotland T. Analysis of phospholipid species in human blood using normal-phase liquid chromatography coupled with electrospray ionization ion-trap tandem mass spectrometry. J. Chromatogr. B Analyt. Technol. Biomed. Life Sci. 2001;758:265–275. doi: 10.1016/s0378-4347(01)00188-8. [DOI] [PubMed] [Google Scholar]
- 2.Huang J.Y., Swanson J.E., Feigenson G.W. Nonideal mixing of phosphatidylserine and phosphatidylcholine in the fluid lamellar phase. Biophys. J. 1993;64:413–425. doi: 10.1016/S0006-3495(93)81382-1. [DOI] [PMC free article] [PubMed] [Google Scholar]
- 3.Lemmon M.A. Membrane recognition by phospholipid-binding domains. Nat. Rev. Mol. Cell Biol. 2008;9:99–111. doi: 10.1038/nrm2328. [DOI] [PubMed] [Google Scholar]
- 4.Kantari C., Pederzoli-Ribeil M., Witko-Sarsat V. Proteinase 3, the Wegener autoantigen, is externalized during neutrophil apoptosis: evidence for a functional association with phospholipid scramblase 1 and interference with macrophage phagocytosis. Blood. 2007;110:4086–4095. doi: 10.1182/blood-2007-03-080457. [DOI] [PubMed] [Google Scholar]
- 5.Nagle J.F., Tristram-Nagle S. Structure of lipid bilayers. Biochim. Biophys. Acta Rev Biomembr. 2000;1469:159–195. doi: 10.1016/s0304-4157(00)00016-2. [DOI] [PMC free article] [PubMed] [Google Scholar]
- 6.Scott H.L. Modeling the lipid component of membranes. Curr. Opin. Struct. Biol. 2002;12:495–502. doi: 10.1016/s0959-440x(02)00353-6. [DOI] [PubMed] [Google Scholar]
- 7.Ash W.L., Zlomislic M.R., Tieleman D.P. Computer simulations of membrane proteins. Biochim. Biophys. Acta Rev Biomembr. 2004;1666:158–189. doi: 10.1016/j.bbamem.2004.04.012. [DOI] [PubMed] [Google Scholar]
- 8.Forrest L.R., Sansom M.S.P. Membrane simulations: bigger and better? Curr. Opin. Struct. Biol. 2000;10:174–181. doi: 10.1016/s0959-440x(00)00066-x. [DOI] [PubMed] [Google Scholar]
- 9.Hub J.S., Salditt T., de Groot B.L. Short-range order and collective dynamics of DMPC bilayers: a comparison between molecular dynamics simulations, x-ray, and neutron scattering experiments. Biophys. J. 2007;93:3156–3168. doi: 10.1529/biophysj.107.104885. [DOI] [PMC free article] [PubMed] [Google Scholar]
- 10.Klauda J.B., Kucerka N., Nagle J.F. Simulation-based methods for interpreting x-ray data from lipid bilayers. Biophys. J. 2006;90:2796–2807. doi: 10.1529/biophysj.105.075697. [DOI] [PMC free article] [PubMed] [Google Scholar]
- 11.Elmore D.E. Molecular dynamics simulation of a phosphatidylglycerol membrane. FEBS Lett. 2006;580:144–148. doi: 10.1016/j.febslet.2005.11.064. [DOI] [PubMed] [Google Scholar]
- 12.Zhao W., Róg T., Karttunen M. Atomic-scale structure and electrostatics of anionic palmitoyloleoylphosphatidylglycerol lipid bilayers with Na+ counterions. Biophys. J. 2007;92:1114–1124. doi: 10.1529/biophysj.106.086272. [DOI] [PMC free article] [PubMed] [Google Scholar]
- 13.Pandit S.A., Bostick D., Berkowitz M.L. Mixed bilayer containing dipalmitoylphosphatidylcholine and dipalmitoylphosphatidylserine: lipid complexation, ion binding, and electrostatics. Biophys. J. 2003;85:3120–3131. doi: 10.1016/S0006-3495(03)74730-4. [DOI] [PMC free article] [PubMed] [Google Scholar]
- 14.Zhao W., Róg T., Karttunen M. Role of phosphatidylglycerols in the stability of bacterial membranes. Biochimie. 2008;90:930–938. doi: 10.1016/j.biochi.2008.02.025. [DOI] [PubMed] [Google Scholar]
- 15.Murzyn K., Róg T., Pasenkiewicz-Gierula M. Phosphatidylethanolamine-phosphatidylglycerol bilayer as a model of the inner bacterial membrane. Biophys. J. 2005;88:1091–1103. doi: 10.1529/biophysj.104.048835. [DOI] [PMC free article] [PubMed] [Google Scholar]
- 16.Chiu S.W., Clark M., Jakobsson E. Incorporation of surface tension into molecular dynamics simulation of an interface: a fluid phase lipid bilayer membrane. Biophys. J. 1995;69:1230–1245. doi: 10.1016/S0006-3495(95)80005-6. [DOI] [PMC free article] [PubMed] [Google Scholar]
- 17.Feller S.E., Pastor R.W. On simulating lipid bilayers with an applied surface tension: periodic boundary conditions and undulations. Biophys. J. 1996;71:1350–1355. doi: 10.1016/S0006-3495(96)79337-2. [DOI] [PMC free article] [PubMed] [Google Scholar]
- 18.Lindahl E., Edholm O. Mesoscopic undulations and thickness fluctuations in lipid bilayers from molecular dynamics simulations. Biophys. J. 2000;79:426–433. doi: 10.1016/S0006-3495(00)76304-1. [DOI] [PMC free article] [PubMed] [Google Scholar]
- 19.Sonne J., Jensen M.O., Peters G.H. Reparameterization of all-atom dipalmitoylphosphatidylcholine lipid parameters enables simulation of fluid bilayers at zero tension. Biophys. J. 2007;92:4157–4167. doi: 10.1529/biophysj.106.087130. [DOI] [PMC free article] [PubMed] [Google Scholar]
- 20.Högberg C.J., Lyubartsev A.P. Effect of local anesthetic lidocaine on electrostatic properties of a lipid bilayer. Biophys. J. 2008;94:525–531. doi: 10.1529/biophysj.107.104208. [DOI] [PMC free article] [PubMed] [Google Scholar]
- 21.Henin J., Chipot C. Hydrogen-bonding patterns of cholesterol in lipid membranes. Chem. Phys. Lett. 2006;425:329–335. [Google Scholar]
- 22.Brooks B.R., Bruccoleri R.E., Karplus M. CHARMM—a program for macromolecular energy, minimization, and dynamics calculations. J. Comput. Chem. 1983;4:187–217. [Google Scholar]
- 23.Humphrey W., Dalke A., Schulten K. VMD: visual molecular dynamics. J. Mol. Graph. 1996;14:27–38. doi: 10.1016/0263-7855(96)00018-5. [DOI] [PubMed] [Google Scholar]
- 24.MacKerell A.D., Bashford D., Karplus M. All-atom empirical potential for molecular modeling and dynamics studies of proteins. J. Phys. Chem. B. 1998;102:3586–3616. doi: 10.1021/jp973084f. [DOI] [PubMed] [Google Scholar]
- 25.Feller S.E., MacKerell A.D. An improved empirical potential energy function for molecular simulations of phospholipids. J. Phys. Chem. B. 2000;104:7510–7515. [Google Scholar]
- 26.Klauda J.B., Brooks B.R., Pastor R.W. An ab initio study on the torsional surface of alkanes and its effect on molecular simulations of alkanes and a DPPC bilayer. J. Phys. Chem. B. 2005;109:5300–5311. doi: 10.1021/jp0468096. [DOI] [PubMed] [Google Scholar]
- 27.Pedersen U.R., Leidy C., Peters G.H. The effect of calcium on the properties of charged phospholipid bilayers. Biochim. Biophys. Acta Rev Biomembr. 2006;1758:573–582. doi: 10.1016/j.bbamem.2006.03.035. [DOI] [PubMed] [Google Scholar]
- 28.Schlenkrich M., Brickmann J., Karplus M. An empirical potential energy function for phospholipids: criteria for parameter optimization and applications. In: Merz K., Roux B., editors. Biological Membranes: A Molecular Perspective from Computation and Experiment. Birkhäuser; Basel, Switzerland: 1996. [Google Scholar]
- 29.Garidel P., Johann C., Blume A. Nonideal mixing and phase separation in phosphatidylcholine-phosphatidic acid mixtures as a function of acyl chain length and pH. Biophys. J. 1997;72:2196–2210. doi: 10.1016/S0006-3495(97)78863-5. [DOI] [PMC free article] [PubMed] [Google Scholar]
- 30.Garidel P., Blume A. Calcium induced nonideal mixing in liquid-crystalline phosphatidylcholine-phosphatidic acid bilayer membranes. Langmuir. 2000;16:1662–1667. [Google Scholar]
- 31.Phillips J.C., Braun R., Schulten K. Scalable molecular dynamics with NAMD. J. Comput. Chem. 2005;26:1781–1802. doi: 10.1002/jcc.20289. [DOI] [PMC free article] [PubMed] [Google Scholar]
- 32.Feller S.E., Zhang Y.H., Brooks B.R. Constant-pressure molecular-dynamics simulation—the Langevin piston method. J. Chem. Phys. 1995;103:4613–4621. [Google Scholar]
- 33.Essmann U., Perera L., Pedersen L.G. A smooth particle mesh Ewald method. J. Chem. Phys. 1995;103:8577–8593. [Google Scholar]
- 34.Izaguirre J.A., Reich S., Skeel R.D. Longer time steps for molecular dynamics. J. Chem. Phys. 1999;110:9853–9864. [Google Scholar]
- 35.Andersen H.C. RATTLE—a velocity version of the SHAKE algorithm for molecular-dynamics calculations. J. Comput. Phys. 1983;52:24–34. [Google Scholar]
- 36.Petrache H.I., Tristram-Nagle S., Nagle J.F. Fluid phase structure of EPC and DMPC bilayers. Chem. Phys. Lipids. 1998;95:83–94. doi: 10.1016/s0009-3084(98)00068-1. [DOI] [PMC free article] [PubMed] [Google Scholar]
- 37.Kucerka N., Liu Y.F., Nagle J.F. Structure of fully hydrated fluid phase DMPC and DLPC lipid bilayers using x-ray scattering from oriented multilamellar arrays and from unilamellar vesicles. Biophys. J. 2005;88:2626–2637. doi: 10.1529/biophysj.104.056606. [DOI] [PMC free article] [PubMed] [Google Scholar]
- 38.Douliez J.P., Leonard A., Dufourc E.J. Conformational order of DMPC sn-1 versus sn-2 chains and membrane thickness: an approach to molecular protrusion by solid state 2H-NMR and neutron diffraction. J. Phys. Chem. 1996;100:18450–18457. [Google Scholar]
- 39.Pasenkiewicz-Gierula M., Takaoka Y., Kusumi A. Charge pairing of headgroups in phosphatidylcholine membranes: a molecular dynamics simulation study. Biophys. J. 1999;76:1228–1240. doi: 10.1016/S0006-3495(99)77286-3. [DOI] [PMC free article] [PubMed] [Google Scholar]
- 40.Bayerl T.M., Köchy T., Brückner S. On the modulation of a high-enthalpy pretransition in binary mixtures of DMPC and DMPG by polar headgroup interaction. Biophys. J. 1990;57:675–680. doi: 10.1016/S0006-3495(90)82587-X. [DOI] [PMC free article] [PubMed] [Google Scholar]
- 41.Eisenberg M., Gresalfi T., McLaughlin S. Adsorption of monovalent cations to bilayer membranes containing negative phospholipids. Biochemistry. 1979;18:5213–5223. doi: 10.1021/bi00590a028. [DOI] [PubMed] [Google Scholar]
- 42.Evans D.F., Wennerstrøm H. Wiley-VCH; New York: 1999. The Colloidal Domain: Where Physics, Chemistry, Biology and Technology Meet. [Google Scholar]
- 43.Binder H., Zschörnig O. The effect of metal cations on the phase behavior and hydration characteristics of phospholipid membranes. Chem. Phys. Lipids. 2002;115:39–61. doi: 10.1016/s0009-3084(02)00005-1. [DOI] [PubMed] [Google Scholar]
- 44.Marra J. Direct measurement of the interaction between phosphatidylglycerol bilayers in aqueous electrolyte solutions. Biophys. J. 1986;50:815–825. doi: 10.1016/S0006-3495(86)83522-6. [DOI] [PMC free article] [PubMed] [Google Scholar]
- 45.Tajima K., Imai Y., Nakamura A. ESR study on DMPC and DMPG bilayers in the (L(α)+H2O) phase. Langmuir. 1996;12:6651–6658. [Google Scholar]
- 46.Scherer P.G., Seelig J. Electric charge effects on phospholipid headgroups. Phosphatidylcholine in mixtures with cationic and anionic amphiphiles. Biochemistry. 1989;28:7720–7728. doi: 10.1021/bi00445a030. [DOI] [PubMed] [Google Scholar]
- 47.Seelig J., Macdonald P.M. Phospholipids and proteins in biological-membranes—2H NMR as a method to study structure, dynamics, and interactions. Acc. Chem. Res. 1987;20:221–228. [Google Scholar]
- 48.Macdonald P.M., Leisen J., Marassi F.M. Response of phosphatidylcholine in the gel and liquid-crystalline states to membrane surface charges. Biochemistry. 1991;30:3558–3566. doi: 10.1021/bi00228a029. [DOI] [PubMed] [Google Scholar]
- 49.Dluhy R.A., Mendelsohn R., Mantsch H.H. Interaction of dipalmitoylphosphatidylcholine and dimyristoylphosphatidylcholine-d54 mixtures with glycophorin. A Fourier transform infrared investigation. Biochemistry. 1983;22:1170–1177. doi: 10.1021/bi00274a028. [DOI] [PubMed] [Google Scholar]
- 50.Lewis R.N., Zhang Y.P., McElhaney R.N. Calorimetric and spectroscopic studies of the phase behavior and organization of lipid bilayer model membranes composed of binary mixtures of dimyristoylphosphatidylcholine and dimyristoylphosphatidylglycerol. Biochim. Biophys. Acta. 2005;1668:203–214. doi: 10.1016/j.bbamem.2004.12.007. [DOI] [PubMed] [Google Scholar]
- 51.Kaznessis Y.N., Kim S.T., Larson R.G. Simulations of zwitterionic and anionic phospholipid monolayers. Biophys. J. 2002;82:1731–1742. doi: 10.1016/S0006-3495(02)75525-2. [DOI] [PMC free article] [PubMed] [Google Scholar]
- 52.Sachs J.N., Nanda H., Woolf T.B. Changes in phosphatidylcholine headgroup tilt and water order induced by monovalent salts: molecular dynamics simulations. Biophys. J. 2004;86:3772–3782. doi: 10.1529/biophysj.103.035816. [DOI] [PMC free article] [PubMed] [Google Scholar]
- 53.Berger O., Edholm O., Jähnig F. Molecular dynamics simulations of a fluid bilayer of dipalmitoylphosphatidylcholine at full hydration, constant pressure, and constant temperature. Biophys. J. 1997;72:2002–2013. doi: 10.1016/S0006-3495(97)78845-3. [DOI] [PMC free article] [PubMed] [Google Scholar]
- 54.Mukhopadhyay P., Monticelli L., Tieleman D.P. Molecular dynamics simulation of a palmitoyl-oleoyl phosphatidylserine bilayer with Na+ counterions and NaCl. Biophys. J. 2004;86:1601–1609. doi: 10.1016/S0006-3495(04)74227-7. [DOI] [PMC free article] [PubMed] [Google Scholar]
- 55.Lee S.J., Song Y., Baker N.A. Molecular dynamics simulations of asymmetric NaCl and KCl solutions separated by phosphatidylcholine bilayers: potential drops and structural changes induced by strong Na+-lipid interactions and finite size effects. Biophys. J. 2008;94:3565–3576. doi: 10.1529/biophysj.107.116335. [DOI] [PMC free article] [PubMed] [Google Scholar]
- 56.Böckmann R.A., Hac A., Grubmüller H. Effect of sodium chloride on a lipid bilayer. Biophys. J. 2003;85:1647–1655. doi: 10.1016/S0006-3495(03)74594-9. [DOI] [PMC free article] [PubMed] [Google Scholar]
- 57.Gurtovenko A.A., Vattulainen I. Effect of NaCl and KCl on phosphatidylcholine and phosphatidylethanolamine lipid membranes: insight from atomic-scale simulations for understanding salt-induced effects in the plasma membrane. J. Phys. Chem. B. 2008;112:1953–1962. doi: 10.1021/jp0750708. [DOI] [PubMed] [Google Scholar]
- 58.Poger D., van Gunsteren W.F., Mark A.E. A new force field for simulating phosphatidylcholine bilayers. J. Comput. Chem. 2009 doi: 10.1002/jcc.21396. In press. [DOI] [PubMed] [Google Scholar]
- 59.Petrache H.I., Dodd S.W., Brown M.F. Area per lipid and acyl length distributions in fluid phosphatidylcholines determined by 2H NMR spectroscopy. Biophys. J. 2000;79:3172–3192. doi: 10.1016/S0006-3495(00)76551-9. [DOI] [PMC free article] [PubMed] [Google Scholar]
Associated Data
This section collects any data citations, data availability statements, or supplementary materials included in this article.