

Abstract
Background
The Bayesian approach is being used increasingly in medical research. In particular, it has become a standard in designing clinical trials at the University of Texas M. D. Anderson Cancer Center.
Purpose/Methods
To address the extent and nature of Bayesian trials conducted at M. D. Anderson, we reviewed the protocols registered in the Protocol Document Online System between 2000 and early 2005. We summarize our findings and give details for three innovative trials that typify those in which a Bayesian approach has played a major role at the center.
Results
Of 964 protocols reviewed, 59% were conducted solely at M. D. Anderson and the rest were multicenter trials. Bayesian designs and analyses were used in about 20% (195/964) of the protocols that we reviewed. Of the 520 protocols identified as phase I or II drug trials, about 34% were Bayesian. Most of the 195 Bayesian trials were designed by M. D. Anderson statisticians. The Bayesian design features most commonly used were the continuous reassessment method in phase I (toxicity) trials, adaptive randomization in phase II trials, and designs to monitor efficacy and toxicity simultaneously. We also provide an insider's view regarding some practical considerations that have made the design and implementation of so many Bayesian trials possible.
Limitations
We reviewed only a subset of all M. D. Anderson protocols, but did not exclude any available in electronic form.
Conclusions
The large number of Bayesian trials conducted at M. D. Anderson testifies to the receptivity to the Bayesian approach within the center, including principal investigators, regulatory review committees, and patients. Statisticians who take a Bayesian perspective can successfully work to establish a culture of innovation in clinical trial design.
Keywords: Adaptive randomization, continuous reassessment method, dose finding, hierarchical modeling, predictive probability, toxicity and efficacy monitoring
Introduction
Bayesian statistical methods have several attractive features that are ideal for use in clinical trial design and analysis. [1-10] The Bayesian approach allows for: (1) continuous learning as data accumulate; (2) the synthesis of information from sources within and outside of the trial; (3) hierarchical modeling to “borrow” information across therapies or disease subtypes, etc., where the strength of borrowing depends on the homogeneity of the data; (4) calculating predictive probabilities of future outcomes and making inferences using the trial's currently available data; and (5) direct estimation of evidence for the effect of interest using posterior probability rather than indirectly calculating the probability of the observed data assuming particular effects using P values. Although many of these features can be incorporated into a frequentist approach, they are more naturally incorporated under the Bayesian framework. For example, the frequentist approach allows for finding the probabilities of future results, but it requires assuming fixed values for the various parameters, and thus is more cumbersome and less useful. Moreover, the frequentist approach has no formal mechanism for combining the probabilities over parameter values to come up with a single probability depending on the current data.
The features described above, along with the introduction of high-speed computers and efficient computation algorithms, have led to a greater use of Bayesian designs in clinical trials. Many pharmaceutical and medical device companies are now using Bayesian approaches in clinical development, which was unimaginable only a few years ago. Among the medical devices recently approved by the Center for Devices and Radiological Health (CDRH) of the United States Food and Drug Administration (FDA), 5% to 10% used Bayesian designs and analyses, compared to none 10 years ago. In 2006, the CDRH issued a draft of “Guidance for the Use of Bayesian Statistics in Medical Device Clinical Trials.” [11] Although the adoption of Bayesian methods on the drug side trails that of devices, Bayesian approaches have become more widely used for drug development in recent years.
One of the reasons for this is the encouragement of regulatory agencies. In 2004, the FDA issued a Critical Path Initiative report stating that “The medical product development process is no longer able to keep pace with basic scientific innovation. Only a concerted effort to apply the new biomedical science to medical product development will succeed in modernizing the critical path.” [12] The report called for innovative and efficient clinical trial designs such as the application of Bayesian methodology and adaptive designs. The role of statisticians in response to the Critical Path Initiative was described by O'Neill. [13]
To our knowledge, the only drug approved by the FDA on the basis of a wholly Bayesian analysis of efficacy is co-packaged pravastatin sodium plus buffered aspirin (Pravigard™ Pac, Bristol-Myers Squibb). [14, 15] This drug application included a retrospective analysis of five clinical trials that had used conventional (non-Bayesian) methods of design and conduct. The dearth of approved drugs based on studies using a Bayesian perspective will end as many pharmaceutical and biotech companies are using the Bayesian approach in some of their clinical development programs. There is an overwhelming interest in Bayesian adaptive methods for drug trials, particularly in dose-finding trials [16] and seamless phase II/III trials. [17] The enthusiasm for investigating and applying more Bayesian methods in the clinical development of medical products can be attested by the prevalent and prominent inclusion of Bayesian topics in the FDA/Industry Statistics Workshop from 2003 to 2008. [18]
Many of the trials designed and conducted at the University of Texas M. D. Anderson Cancer Center (MDACC) are Bayesian. We systematically reviewed the protocols submitted at the center, with a particular focus on trials with Bayesian features. We present those findings and discuss three examples of innovative studies that are typical of Bayesian trials at MDACC to illustrate some advantages of Bayesian methods. We also present an inside view of some aspects of the trials that have made them feasible in practice.
Methods
We received access to MDACC protocols approved by the Institution Review Board (IRB) that were in the center's electronic database, the Protocol Document OnLine (PDOL) System. At the time of this review, approximately 70% of all protocols from 2000 to April 2005 were available in the PDOL system and the remaining ones had hard copies only. From a starting list of 1,005 available protocols, we eliminated duplicates and protocols that were never initiated, leaving 964 protocols for review.
Some of the relevant information was available directly in itemized format in the protocol – the phase of the trial, site of the trial (MDACC only or multicenter), the statistical collaborator at MDACC, if any, whether the trial had a sponsor, and the name of the sponsor. The rest of the information was obtained by reading the description—the investigational drug names, statistical design, whether a control group was used, whether the trial was randomized, the number of arms/groups, number and type of interim analyses, primary endpoints, maximum sample size, and whether Bayesian methods were applied.
As the number of arms/groups in a trial was not always specified, we made that determination according to the following criteria. For a phase I trial using a 3+3 or continual reassessment method (CRM), we coded the number of arms as 1, i.e., we did not consider different dose levels as different arms. For phase I/II combination trials, if the two phases were carried out separately with different patient groups, we combined the number of groups from the two phases. However, if phase II was an extension of a phase I dose escalation trial, we recorded the number of groups that were in phase II of the trial. For protocols that did not specify the number of groups, such as observational and genetic epidemiological studies, we recorded the number of groups as 1. For protocols without groupings, such as those establishing a registry or website, we recorded the number of arms/groups as “not applicable.”
We took a similar approach when recording the sample sizes for phase I/II trials. If phases I and II were to be conducted separately and the sample sizes for each phase were given separately, we added them together. If phase II was to be a seamless continuation of phase I, we recorded the overall sample size, which was almost always explicitly indicated in the protocol. For trials involving two or more separate, independent studies (e.g., separate studies for patients with poor and good prognoses), we combined the number of arms/groups and added the sample sizes across the studies. We labeled a trial as having an interim analysis if any statistical analysis that might affect the subsequent conduct of the trial was performed during the trial. This included phase I trials using a 3+3 design, dose escalation, or CRM, etc., as they involve the analysis of current data to determine the next dose. Many protocols did not specify the exact number of interim analyses, so for these trials we recorded only whether an interim analysis would be performed.
We regarded a “Bayesian trial” to be one that specified a Bayesian component in the design or the analysis, and recorded the distinction between those two aspects. We also recorded whether each Bayesian trial used informative priors, adaptive randomization, hierarchical modeling, or predictive probabilities, etc. If information on any of these features was not provided, we were sometimes able to elicit it from the listed MDACC statistician. For dichotomous endpoints, beta distributions were a common choice for priors. We categorized beta(a1, a2) distributions as non-informative if a1 + a2 ≤ 2, and informative otherwise. We used descriptive statistics, tables, and figures to summarize the findings.
In many protocols, the listed sponsor merely supplied a drug and was not otherwise involved, so this information was not useful in identifying industry-sponsored trials. However, some protocols were in written a company-specific format instead of the standard MDACC format, with the company's name spelled out. We recorded these trials as industry-sponsored. This indirect approach may not have identified all company-sponsored trials.
Results
Summary of Protocol Review
Of the 964 protocols we reviewed, 59% (570/964) were conducted at MDACC only and the remaining 41% were multicenter trials with MDACC as one of the sites. About 20% (195/964) of the protocols used a Bayesian design or analysis. Of these, 178 (91%) used both a Bayesian design and a Bayesian analysis, while the other 17 used a traditional design with some pre-specified Bayesian analyses. Figure 1 depicts the protocols by site, year, and Bayesian status.
Figure 1.
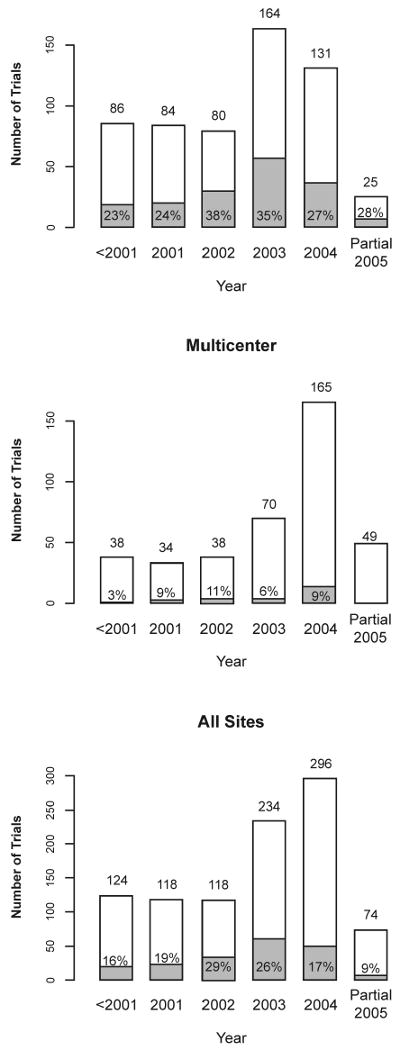
Number of trials by year and site. The shaded areas and the indicated percentages in or above the shaded areas or marked by arrows refer to Bayesian trials. The increase in number of trials in 2003 compared to previous years is partly due to a higher number of electronic protocol submissions in that year. Only part of 2005 is represented in the sample.
Of the 195 Bayesian trials, 169 (87%) were conducted at MDACC only. Approximately 30% of the MDACC-only trials and 7% of the multicenter trials applied Bayesian methods. This is not surprising because MDACC-only protocols are likely to be designed by statisticians at MDACC who are familiar with and favor the Bayesian approach. Of the 26 Bayesian multicenter trials, 19 (73%) were designed by MDACC statisticians.
Figure 2 shows the development phases of all 964 trials. The Bayesian approach was most frequently applied in phase I/II (47%) and phase II trials (38%). Phase II/III and III trials tend to be non-Bayesian with 1/6 and 1/78 trials, respectively, using Bayesian methods. These represent an understandably cautious introduction of this innovation as phase III trials usually involve stringent regulatory considerations. Among the 353 trials classified as “other,” 109 were observational/follow-up studies, 58 addressed behavioral questions, 46 were diagnostic (medical device or procedural), 29 were feasibility or pilot studies, 19 were genetic epidemiology or linkage studies, 17 addressed technology assessment, and 16 were correlative science studies. Bayesian methods were applied in 5% of the trials in the “other” category.
Figure 2.
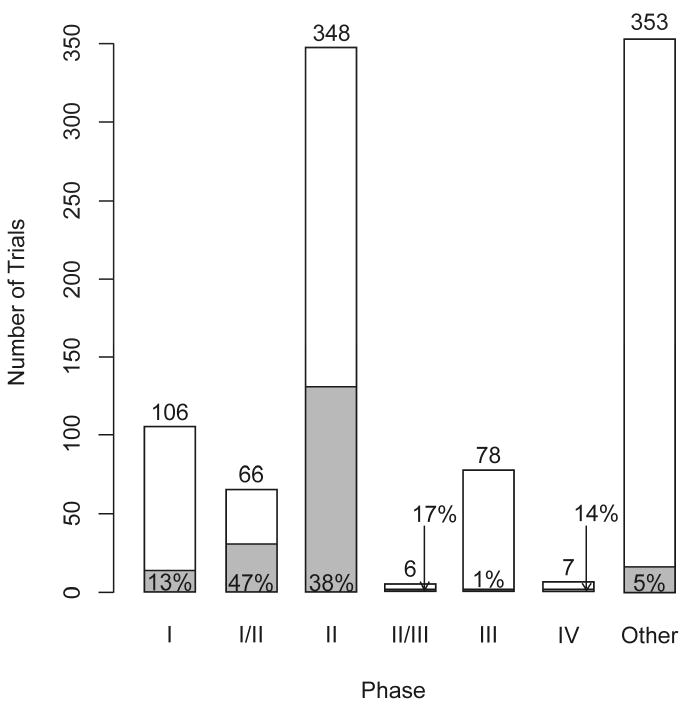
Number of protocols by phase of development. The shaded areas and the indicated percentages in or above the shaded areas or marked by arrows refer to Bayesian trials.
Table 1 provides a classification of the 141 industry-sponsored trials and the other 823 trials in terms of site and use of Bayesian methods. Six percent (9/141) of the industry-sponsored trials and 23% (186/823) of other trials used a Bayesian approach. A majority of the industry-sponsored trials were multicenter (128/141 = 91%), of which 71% (91/128) were of phase I, I/II, or II, and only about 5% (6/128) were Bayesian. Among the MDACC-only trials that were not industry-sponsored, 30% (166/557) were Bayesian.
Table 1.
Characteristics of industry-sponsored and other clinical trials classified by site. Number of Bayesian trials / total number of trials are shown along with proportion of Bayesian trials indicated in parenthesis.
| Site | Pharmaceuticala | Other | Total |
|---|---|---|---|
| MDACC only | 3/13 (23%) | 166/557 (30%) | 169/570 (30%) |
| Multicenter | 6/128 (5%) | 20/26 (8%) | 26/394 (7%) |
| Total | 9/141 (6%) | 186/823 (23%) | 195/964 (20%) |
Only 141 trials are documented pharmaceutical (industry-sponsored) trials
Design Features
We found a wide range of designs and endpoints. Popular statistical designs in phase I studies included the “3+3” dose-escalation design and its variations. Single-arm, two-stage designs were common for phase II studies. Randomization, as expected, was standard in phase III trials. As is generally true in oncology, the primary endpoint in the phase I trials was toxicity. Tumor response rate was the most common endpoint in phase II trials. Time-to-event endpoints, including disease-free survival, progression-free survival, and overall survival, were typical in phase III trials. Of the 964 protocols, 282 (29%) used randomization, including adaptive randomization. Of 348 phase II trials, 92 (26%) used randomization. Randomization is not always applicable, such as in observational studies, in trials with only one arm/group, and in dose escalation trials.
The number of arms/groups ranged from 1 to 12; Figure 3 shows the distribution. Approximately 20% of the trials with one or two arms/groups applied Bayesian methods and there was no clear relationship between the number of arms/groups and the percentage of Bayesian trials. More than half of the trials had only one arm/group, including 95 of the 106 phase I trials, 198 of the 348 phase II trials, 32 of the 66 phase I/II trials, 2 of the 78 phase III trials, 4 of the 7 phase IV trials, and 215 of the 353 “other” trials. Of 964 total trials, 508 (53%) included interim analyses. This included 101 phase I trials. A majority of trials with no interim analysis (324/456) belonged to the “other” phase category, a small minority of which was Bayesian (8/324). Excluding the “other” phase category, 71% of non-Bayesian trials and 96% of Bayesian trials included interim analyses. The number of interim analyses ranged from 0 to 12. Among the trials for which we were able to discern the number of interim analyses, “one” was the most common—this included the popular 2-stage designs in phase II. All trials with 7 or more interim analyses were Bayesian. This is not surprising because the Bayesian paradigm is naturally sequential.
Figure 3.
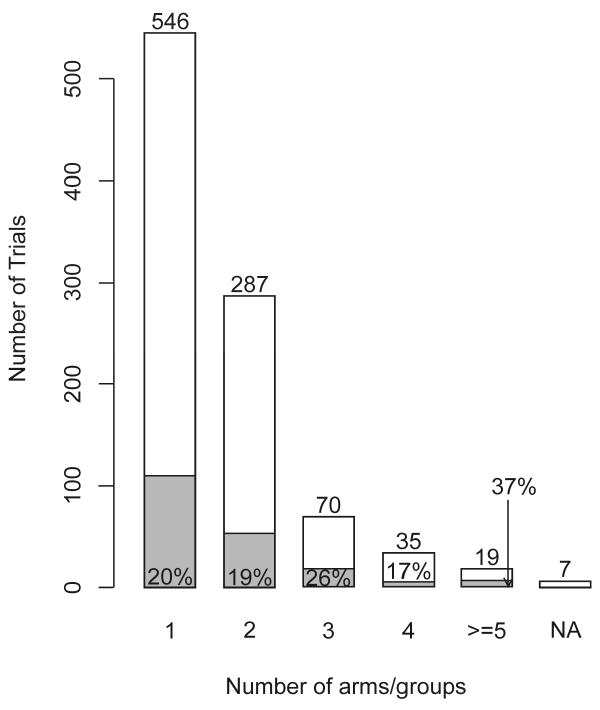
Number of arms/groups. The shaded areas and the indicated percentages in or above the shaded areas or marked by arrows refer to Bayesian trials.
Figure 4 shows the maximum sample sizes for Bayesian and non-Bayesian phase I, I/II, and II trials. There is little difference in sample size between the two approaches. However, as Bayesian designs tend to incorporate more frequent interim analyses with greater possibility for early stopping, the actual sample sizes of the Bayesian trials may well turn out to be smaller than those of the non-Bayesian trials.
Figure 4.
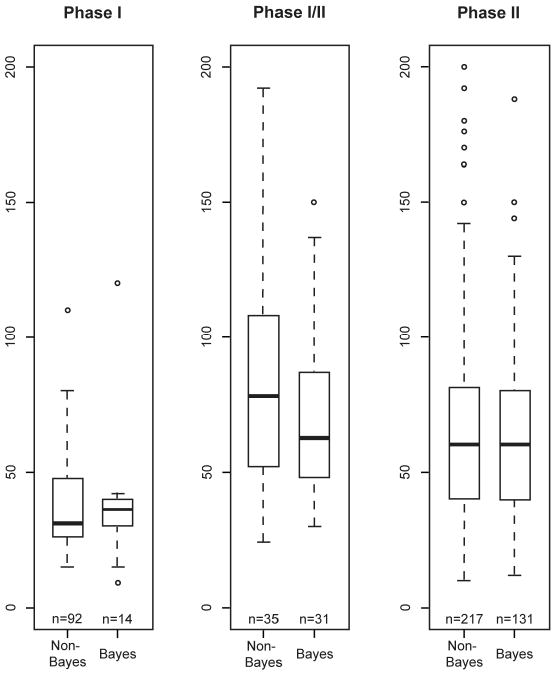
Sample sizes for non-Bayesian and Bayesian trials in phase I, phase I/II, and phase II. The total number of trials in each category is indicated under the corresponding boxplot. The maximum sample size limit for each boxplot is 200. Some trials had sample sizes greater than 200: 2 were phase I/II (one non-Bayesian and one Bayesian) and 16 were phase II (12 non-Bayesian and 4 Bayesian).
Design Features Specific to Bayesian Trials
Table 2 shows the various Bayesian design features used in 195 trials. The categories are not mutually exclusive as several trials included more than one feature. For example, a phase I/II trial might use the CRM for the phase I dose-finding portion and Bayesian adaptive randomization for the phase II portion. Similarly, some trials use the CRM and also apply Bayesian efficacy monitoring schemes. The majority of the Bayesian trials monitored efficacy outcomes (121 or 62%) while 53 (or 27%) monitored toxicity outcomes. There were 33 Bayesian trials that monitored efficacy and toxicity simultaneously. Fifty-two Bayesian trials used randomization, of which 20 (10% of 195) used adaptive randomization. The dose-finding category includes 13 designs that used the CRM and 2 designs that were based on a prospectively defined trade-off between efficacy and toxicity. Hierarchical modeling was used in 14 (7% of 195) Bayesian trials, with 6 using it to borrow strength across similar disease groups for interim decision making (as well as at the final analysis to enable stronger conclusions about each of the groups). Predictive probabilities were used in 11 of the 195 (6%) Bayesian trials. A majority of the Bayesian trials (119/195 = 61%) used informative priors, mainly constructed using historical data (more details in the Discussion section).
Table 2.
Bayesian design and analysis features for the 195 trials classified as “Bayesian.” The indicated categories are not mutually exclusive.
| Type of Trial Features | N (%) |
|---|---|
| Efficacy monitoring | 121 (62%) |
| Toxicity monitoring | 53 (27%) |
| Adaptive randomization | 20 (10%) |
| Dose finding (includes CRM) | 17 (9%) |
| Hierarchical model | 14 (7%) |
| Predictive probability | 11 (6%) |
Case Studies
We present three trials in which Bayesian approaches were used. Example 1 demonstrates how predictive probability can be used to forecast the final outcome of a trial as an aid to making interim decisions on trial conduct. Example 2 uses adaptive randomization to allow for learning while treating patients in the trial effectively. Example 3 is a design for combination therapies implementing an overlap of phases I and II to simultaneously monitor toxicity and efficacy. It uses a novel adaptive randomization procedure and allows for dropping a treatment arm early or stopping the entire trial due to toxicity, efficacy, or futility.
Example 1: Neoadjuvant therapy for human epidermal growth factor receptor 2 (HER2/neu)-positive operable breast cancer. [19]
Trial Design
The neoadjuvant approach uses systemic therapy prior to the surgical excision of a tumor, allowing for assessment of the effect of chemotherapy on the tumor. In this trial, the location of the breast tumor was identified before chemotherapy and that part of the breast was removed following chemotherapy. If the pathologist found no tumor in the excised tissue then the patient's response to treatment was called a “pathological complete response” or pCR, which was the primary endpoint of this phase II trial.
The objective of the trial was to determine whether concurrent administration of trastuzumab with standard chemotherapy in the neoadjuvant setting could increase the rate of pCR in patients whose breast cancer overexpressed HER2/neu, a biomarker that is associated with cell growth and differentiation. The trial had two arms: (1) standard chemotherapy and (2) standard chemotherapy + trastuzumab.
The historical pCR rate with the standard treatment arm (without regard to HER2/neu status) was 21%. The original design was frequentist. The sample size was set at 164 with equal randomization between the two arms. This gave 80% power to detect a 20% improvement in the pCR rate with a two-sided type I error of 0.05. One interim analysis was planned after 82 patients were evaluable for the pCR. Stopping guidelines were also provided in case of excessive cardiac toxicity.
Trial Conduct
All randomized trials at MDACC are monitored annually by the institution's Data Safety and Monitoring Board (DSMB). At each DSMB meeting, the statistical collaborator on the trial reports the current results, including safety and efficacy. At one such meeting in 2004, the pCR rate was available for 34 patients with the results from another 8 patients pending. The pCR rates on the experimental and standard arms were 12/18 (67%) and 4/16 (25%), respectively. Importantly, the accrual was averaging less than 2 patients per month; thus, the formal interim analysis would not occur for 2 or 3 more years.
Under the circumstances, and although not called for in the protocol, the statistical presentation to the DSMB included a calculation of the Bayesian predictive probability of achieving statistical significance in the pCR rate favoring the experimental arm if the trial were to continue to its target of 164 patients. Based on the current results and assuming independent uniform prior distributions, it was shown that the probability the experimental arm would be found statistically superior was 95%. The DSMB regarded the calculation to be compelling despite the small number of patients in the trial—especially because the accrual rate was so slow—and stopped accrual to the trial.
With the additional 8 patients, the final sample size was 42. There were 15 of 23 (65.2%) pCRs in the experimental arm compared with 5 of 19 (26.3%) in the standard arm. An updated Bayesian predictive analysis found a 96% probability that the experimental arm would be found superior if accrual were continued to 164 patients.
This protocol was not in the database of 964 trials because it was designed prior to 2000. Even if it had been in the database, we would not have labeled it “Bayesian” because its design was exclusively frequentist. We include this trial as an example because it demonstrates the desirability of using Bayesian predictive calculations for monitoring and making decisions about the future course of a trial. The Bayesian analysis in this trial was ad hoc and was a consequence of slow accrual and the compelling nature of interim results. We do not recommend patching in Bayesian analyses in this way. Rather, trial designs should be fully prospective so as to enable the calculation of operating characteristics, including the false-positive rate, etc.
Example 2: Adaptive randomized study of idarubicin + ara-C, troxacitabine + ara-C, and troxacitabine + idarubicin. [20]
Trial Design
This was a prospective, randomized study for patients 50 years or older with untreated, adverse karyotype, acute myeloid leukemia. The goal was to assess the activity of the experimental drug troxacitabine when combined with cytarabine (ara-C) or idarubicin as induction therapy. There were three arms in the trial: arm 0 was the control (idarubicin + ara-C), arm 1 was troxacitabine + ara-C, and arm 2 was troxacitabine + idarubicin. The primary efficacy endpoint was time to complete remission (CR) without nonhematologic grade 4 toxicity, censored at 50 days. Time to CR was used to compare the arms and subsequently for the adaptive randomization. It was assumed to be exponentially distributed. The prior distributions of median time to CR, mk (k = 0, 1, 2) for the three treatments were independent inverse gamma (2.001, 4.614). The mean and standard deviation of this distribution were 4.61 and 145.76, and were based on historical information for the control arm.
The trial was first designed based on frequentist criteria for a three-armed trial with 25 patients randomly assigned to each arm. When converted to a Bayesian design, the maximum sample size remained at 75. [21] In the Bayesian design, patients were to be randomized to arms 0, 1, and 2 with probabilities π0, π1, and π2. Initially, π0 = π1 = π2 = 1/3 but πk changes over the course of the trial depending on the updated data. When each new patient entered the trial, the probabilities qk = Pr(mk < m0 ∣ data) for k = 1, 2 and r = Pr(m1 < m2 ∣ data) were calculated. The randomization probabilities π1 and π2 were set proportional to q12 and q22 so that their sum equaled 2/3. The proportion assigned to the control, π0, remained equal to 1/3 as long as all three arms were in the trial. (Experiments with various powers of the qk had been undertaken and the square had been chosen. In trials designed today, the first power is commonly used.) If at any time during the trial either q1 > 0.85 or q2 > 0.85 (i.e., at least 85% probability that arm 1 or arm 2 had a shorter time to CR than the control), the control would be dropped from the randomization. If only the two investigational arms, arms 1 and 2, remained in the trial, the randomization probability for arm 1 would be π1 = r2/[r2 + (1 - r)2]. If at any time q1 < 0.15 or r < 0.15 (i.e., the control arm or arm 2 outperformed arm 1), arm 1 would be dropped from the randomization; there was a symmetric rule for dropping arm 2. Whenever the control arm and only one investigational arm, say arm k, remained, the randomization probability for arm k would be πk = qk2/[qk2 + (1 - qk)2]. An arm that had been dropped could be reopened if the accumulating data changed the current probabilities accordingly.
Trial Conduct
In the actual trial, both experimental arms did poorly. When the 25th patient presented for randomization, the 50-day CR rates were 5/9 (56%) for the control, 3/7 (43%) for arm 1, and 0/5 for arm 2 (0%), with less than 50 days of follow-up for three patients, two of whom were assigned to the control and one to arm 1. At that time, arm 2 was dropped and the assignment probability for the 25th patient was 0.87 to the control and 0.13 to arm 1. After 34 patients had been treated, arm 1 was also dropped and the trial stopped. After complete follow-up on the patients, the 50-day CR rates were as follows: 10/18 (56%) for the control; 3/11 (27%) for arm 1; and 0/5 (0%) for arm 2. The final values of q1 and q2 were 0.30 and 0.08.
This example shows how adaptive randomization increases the proportion of patients assigned to better performing arms (18 patients to the control arm compared with only 5 patients to arm 2 and 11 to arm 1). It also shows how conclusions can be reached with a smaller sample size compared to a traditional design: 34 in the actual trial as opposed to 75 in the trial originally proposed.
Example 3: Randomized parallel phase I/II study of combination therapy for relapsed/refractory acute myelogenous leukemia or high risk myelodysplastic syndrome. [22]
Trial Design
The primary goal of this trial was to evaluate the safety and efficacy of decitabine and ara-C as combination therapy for patients with certain hematologic disorders. The historical CR rate for patients with these diagnoses was about 5%. The target CR rate of the combination therapy was 20%. The trial investigated two dose levels of decitabine and two dose levels of ara-C, thus resulting in four dose combinations. Further, the administration of decitabine and ara-C was considered both sequentially and concurrently, resulting in a total of 8 arms, as shown in Table 3.
Table 3.
Labeling of treatment arms in the phase I/II study of decitabine in combination with Ara-C as either sequential or concurrent therapy, considered in Example 3.
| Decitabine | Sequential Therapy Ara-C Dose | Concurrent Therapy Ara-C Dose | ||
|---|---|---|---|---|
| Low | High | Low | High | |
| Dose 1 | Arm 1 | Arm 3 | Arm 5 | Arm 7 |
| Dose 2 | Arm 2 | Arm 4 | Arm 6 | Arm 8 |
The statistical design of combination therapies is more challenging than traditional single-drug designs. For example, a usual assumption in single-drug designs is that the higher the dose, the greater the efficacy and the toxicity. This leads to the traditional approach of defining the MTD. In combination studies, the MTD is a curve in two dimensions. A design was proposed for the phase I aspect of this trial in which the doses would be escalated as indicated below to find the “admissible” doses/schedule combinations. In this admissible set, both toxicity and efficacy were monitored. [22] The updated assessment of the two endpoints used information from all patients treated up to that point.
Within each set of sequential or concurrent therapies, the initial dose escalation for safety uses a modified 3+3 design. The modification involves opening arm 4 (or 8) only if both arms 2 and 3 (or 6 and 7) are admissible and their results allow for dose escalation. The toxicities occurring in sequential therapies do not affect and are not affected by the admissibility of concurrent therapies. After the dose-escalation period, an adaptive randomization procedure is used to assign patients to admissible arms. We denote the response rates for arm k by pk, k = 1, …, 8, and define rk = Pr [pk > p1 ∣ data], k = 2, …, 8 and r1 = 0.5, where arm 1 is treated as the control. The assignment probabilities are then set to be proportional to the current values of the rk. An advantage of this approach of assigning probabilities is that it can account for early-stage differences (which are based on a small sample and hence, less reliable) and late-stage differences (based on a large sample and hence, more reliable). This is because as sample size increases, similar pk's would result in larger differences in rk's.
The values of rk are computed using a logistic regression model for the pk's with three factors: dose level of decitabine, dose level of ara-C, and therapy type (sequential or concurrent). Such a model allows for borrowing strength across the eight arms and induces a kind of smoothness, at least partially regressing to a common value. After each cohort of 5 patients, all the data (including data from the phase I dose-escalation aspect of the trial) are used to update the prior distributions of the toxicity and efficacy parameters for the eight arms.
Stopping and dropping rules based on toxicity, futility, and efficacy are applied at each update. The rules allow for dropping an arm if there is high posterior probability that its toxicity rate exceeds a pre-specified threshold. The ability to temporarily close an arm with a low response rate is also incorporated. When the current probability that the response rate of the best performing arm exceeds the 20% target is very high or very low, the trial can be stopped for efficacy or futility, respectively, provided that results are available for a minimal number of patients. Stopping for efficacy also requires a sufficiently high probability that the response rate of the best arm exceeds that of the second best. The maximum sample size is set to 100.
Trial Conduct
The above design, described in detail by Huang et al. [22], is modified somewhat in the actual, currently ongoing, trial. The biggest differences are that (1) the actual trial considers only sequential therapies and hence involves only four arms, (2) as borrowing strength across four arms is not as helpful, instead of logistic modeling, independent beta(0.1, 1.9) prior distributions for the pk's are used, and (3) the maximum sample size has been reduced to 80.
Discussion
Recent years have seen much interest in applying Bayesian methods in clinical trials [23-29]. Enthusiasm for these designs at M. D. Anderson Cancer Center has been remarkable. To document the shift in the center's statistical focus to the Bayesian approach, we reviewed all protocols available in the MDACC electronic database as of early 2005. Of the 964 protocols we reviewed, 195 (20%) were Bayesian in some respect.
Most of the 195 Bayesian trials were single-institution trials. A majority (171 or 88%) of the 195 Bayesian trials had been designed by MDACC statisticians, including most of the Bayesian multicenter trials (although only 7% of the multicenter trials were Bayesian). Of phase I, II, and I/II trials, about 34% were Bayesian. Most of the phase II/III and III trials (69/84 or 82%) were multicenter, as were most of the pharmaceutical company-sponsored trials.
A limitation of this study is that only about 70% of protocols approved at MDACC were in the electronic database at the time of this study, thus our findings may not be representative of all trials. However, the findings are consistent with the general pattern of clinical trial protocols at MDACC to date.
Of 52 randomized Bayesian trials, 20 (38%) used adaptive randomization, as in Example 2. Informative prior distributions based on historical data are commonly used at MDACC. However, consistent with the practice common in MDACC's Department of Biostatistics, such informative priors discounted the historical data in applying it to the current setting. For example, if a therapy serving as a control in the current trial had elicited a tumor response in 30 out of 100 patients from the historical data, this information might be regarded as having a value of only one-tenth as many patients in the current setting and thus a beta(3, 7) prior distribution would be assigned. Given the vagaries of extrapolating from one trial to the next, seldom would a prior that is more informative than beta(6, 14) be used; the typical practice is to use a discount factor to incorporate 20% or less of the historical information.
Bayesian methods are relatively new in biostatistics. Few biostatisticians have extensive training in Bayesian theory and methods. As a consequence, few biostatisticians understand the Bayesian perspective—and some who think they do, do not! The best way to learn Bayesian clinical trials is to design and conduct them. When implementing a new method, many things can go wrong, but through experience we learn, adapt, and improve over time. A few important practical considerations are given below.
Prior Elicitation
A strength of Bayesian design and analysis is the ability to formally incorporate available information. But choosing a prior distribution requires careful consideration and work. This aspect of the Bayesian approach is more art than science. Several meetings between clinical investigators and statisticians may be necessary for assembling, evaluating, and quantifying the evidence based on literature or prior experience. In the process of selecting a prior distribution, the statistician should evaluate its sensitivity on the design's operating characteristics. Using a non-informative prior may be appropriate. Such a prior imitates a frequentist approach at the analysis stage but does not take existing information into consideration. And because a non-informative prior is artificial, it can lead to a poor design by overreacting to early results. When incorporating historical information into the prior, we almost always down-weight it in comparison to data collected in the actual trial, as described above. Another simple way to discount is to find the posterior density based on prior data and raise it to a power π that is less than 1. With this approach, n patients in the historical data count as only nπ patients. This approach recognizes differences over time and settings, although a more robust approach may be to use hierarchical modeling in which the extent of borrowing from the historical results depends on its concordance with the current trial's results. [1,2, 30-33]
Software
Bayesian inferences require finding posterior and predictive distributions, and can be computationally intensive. This is especially so when evaluating an adaptive design's operating characteristics using simulation because updating occurs many times during the trial and can involve simulating thousands of trials. We sometimes use WinBUGS, the Windows version of BUGS [34, 35], and BRugs [36] for simulations. However, high-level computer languages are too slow for simulating complicated designs. Driven in part by the need for calculation speed, we have developed computer programs, which are freely available for downloading. [37] The site contains over 70 programs, most of which are useful for Bayesian clinical trials. For example, the “CRM Simulator” program can be used in designing phase I studies using the continual reassessment method. The “Adaptive Randomization” program can perform outcome-based adaptive randomization for both binary and survival endpoints. The “Predictive Probability” program computes the probability of accepting or rejecting the null hypothesis based on the current data should the trial continue to any fixed point in the future.
The Bayesian approach is inherently adaptive, so timely updates of interim data are critical for guiding the trial conduct. To facilitate real-time monitoring, we have developed web-based software for patient enrollment, randomization, and outcome assessment. This allows research nurses to enter patient information online and to determine the treatment to be assigned to a patient entering the trial. Although sufficient accrual is vital to the success of all trials, a fast rate of accrual limits the opportunities for learning from interim data, and hence is not necessarily desirable for outcome-based adaptive trials. We regard the accrual rate to be a design characteristic.
Informed Consent
As in all clinical trials, participants must be fully informed about the trial's nature. Most of the key elements of the informed consent are independent of the statistical approach. Bayesian posterior probability statements are actually simpler for patients to understand than the frequentist analogs. However, conveying the complicated nature of adaptive randomization to patients can be challenging. Informed consent forms can convey the essence without burdening the patient with details. As an example, we designed a trial with the goal of identifying the better of two treatment regimens. At a number of decision points, the trial could be terminated for evidence of superiority of either regimen or for futility if neither regimen was sufficiently likely to be superior. If the trial continued, then assignments were adaptive. The consent form included the following statements: “If you are … eligible to take part in the study, you will be randomly assigned (as in the toss of coin) to one of two treatment groups. Participants in one group will receive [regimen 1]. Participants in the other group will receive [regimen 2]. At first, there will be an equal chance of being assigned to either group. As the study goes along, however, the chance of being assigned to the treatment that worked better so far will increase.”
Such a design can make a trial appealing to patients, especially if the clinical investigators are enthusiastic. For example, an ongoing trial at MDACC has actually exceeded the estimated accrual rate of 5 patients per month since the protocol opened in November 2006. That trial, called BATTLE, is a biomarker driven, four-arm, single-institution, adaptively randomized trial evaluating the treatment of advanced stage, recurrent lung cancer. [23]
Regulatory Process
All clinical trial protocols at MDACC must be approved by the Clinical Research Committee (CRC) and the IRB. As with any design that is different from the norm, a trial may be disapproved because one of these bodies does not understand it. Statisticians serve in both committees. They explain why the trial design is scientifically justifiable and why it makes clinical sense. Such explanations are especially important in the first Bayesian protocols seen by these committees. Through simulating thousands of trials, we provide the operating characteristics of the trial design in the protocols. We select a small number of simulations (3 or 4) from the thousands we run and include them in an appendix of the protocol. Showing current data and what course the design follows when faced with those data can be very effective in teaching the design to the CRC and IRB. Interactions between statisticians and clinical investigators are mutually beneficial for the understanding and improving of the design and conduct of Bayesian trials.
Another committee that must review and learn about Bayesian designs is the Data and Safety Monitoring Board (DSMB), which monitors all randomized trials at MDACC. The study statistician prepares reports for the DSMB annually, and sometimes more frequently at their request. The membership of the DSMB includes at least two biostatisticians, one of whom currently serves as the DSMB chair. The biostatisticians are important for communicating the important aspects of the design and of the Bayesian calculations. For reasons indicated in Example 1, the DSMB is frequently presented with predictive probability calculations and has come to rely on them. The “Predictive Probability” computer program we mentioned earlier is particularly useful when monitoring the interim results from a trial, and serves as the standard for presentations to the DSMB.
For some of the protocols, interactions also involve the Food and Drug Administration, National Cancer Institute, and Department of Defense, which provide various levels of oversight. Through education, training, and communication, MDACC's experience with these regulatory bodies regarding Bayesian trials has been quite positive.
Collaboration
No design innovations are possible without the full support of the clinical collaborators. The trial examples we provided convey the level of acceptance of Bayesian methods at MDACC. Author Berry moved to MDACC in 1999 and initiated changes resulting in a greater role for Bayesian ideas within the institution. All departments at MDACC have been assigned biostatistics faculty members and statistical analyst teams, which allows the statisticians to become specialists in their assigned diseases. They learn about the natural histories of those diseases, about the treatments and their efficacies and toxicities, and the corresponding biomarkers. This helps develop long-term collaborations between investigators and statisticians and fosters understanding, mutual respect, and trust – a key to designing and implementing such large number of innovative trials. Clinical investigators must have confidence that their statisticians know what they are doing and have credibility within the profession. MDACC offers a clinical research environment that is supportive of innovation and, importantly, respectful of statisticians and statistical science.
Circumstances are similar for statisticians working in the biomedical industry. There are many reasons to do things as they have always been done. One is that well-trod paths are the easiest to follow. But many industry statisticians have developed Bayesian expertise and have gained confidence from their clinical collaborators and so they, too, have the ability to open new paths.
A large infrastructure at M. D. Anderson Cancer Center, providing resources over a period of time, helped in building and conducting so many Bayesian trials. Designing a single trial (especially phase I or II), however, does not require vast resources and manpower. The key factors are trust, as described above, and a desire to change for the better. And that begins with one trial! The time for change is here, and statisticians and clinicians can agree on that point. In an interview published after the trial in Example 2 had been conducted, the study PI had the following comment: “‘I see no rationale to further delay moving to these designs,’ says Dr. Giles, who is currently involved in eight Bayesian-based leukemia studies. ‘They are more ethical, more patient-friendly, more conserving of resources, more statistically desirable.’” [38]
Acknowledgments
This work was supported in part by the Cancer Center Support Grant from the National Cancer Institute, CA16672. The authors thank the Editor and Associate Editor for their helpful comments and suggestions.
References
- 1.Berry DA. Bayesian clinical trials. Nat Rev Drug Discov. 2006;5:27–36. doi: 10.1038/nrd1927. [DOI] [PubMed] [Google Scholar]
- 2.Berry DA. Statistical innovations in cancer research. In: Holland J, Frei T, et al., editors. Cancer Medicine. 7th. BC Decker; 2005. pp. 411–425. [Google Scholar]
- 3.Leaf C. Deadly caution: How our national obsession with drug safety is killing people -- and what we can do about it. Fortune. 2006 February 9; [Google Scholar]
- 4.Malakoff D. Statistics: Bayes offers a ‘new’ way to make sense of numbers. Science. 1999;286:1460–1464. doi: 10.1126/science.286.5444.1460. [DOI] [PubMed] [Google Scholar]
- 5.Couzin J. The new math of clinical trials. Science. 2004;303:784–786. doi: 10.1126/science.303.5659.784. [DOI] [PubMed] [Google Scholar]
- 6.Berry DA. Introduction to Bayesian methods III: use and interpretation of Bayesian tools in design and analysis. Clin Trials. 2005;2:295–300. doi: 10.1191/1740774505cn100oa. [DOI] [PubMed] [Google Scholar]
- 7.Goodman SN. Introduction to Bayesian methods I: measuring the strength of evidence. Clin Trials. 2005;2:282–290. doi: 10.1191/1740774505cn098oa. [DOI] [PubMed] [Google Scholar]
- 8.Louis TA. Introduction to Bayesian methods II: fundamental concepts. Clin Trials. 2005;2:291–294. doi: 10.1191/1740774505cn099oa. [DOI] [PubMed] [Google Scholar]
- 9.Lipscomb B, Ma G, Berry DA. Bayesian predictions of final outcomes: regulatory approval of a spinal implant. Clin Trials. 2005;2:325–333. doi: 10.1191/1740774505cn104oa. [DOI] [PubMed] [Google Scholar]
- 10.Lee JJ, Liu DD. A predictive probability design for phase II cancer clinical trials. Clin Trials. 2008;5:93–106. doi: 10.1177/1740774508089279. [DOI] [PMC free article] [PubMed] [Google Scholar]
- 11.U. S. Food and Drug Administration, Center for Devices and Radiological Health. Guidance for the use of Bayesian statistics in medical device clinical trials - draft guidance for industry and FDA staff. [2/26/09];2006 May 23; http://www.fda.gov/cdrh/osb/guidance/1601.html.
- 12.U. S. Food and Drug Administration. Innovation or stagnation? Challenge and opportunity on the critical path to new medical products. [2/26/09];2004 http://www.fda.gov/oc/initiatives/criticalpath/whitepaper.pdf.
- 13.O'Neill RT. FDA's critical path initiative: a perspective on contributions of biostatistics. Biom J. 2006;48:559–564. doi: 10.1002/bimj.200510237. [DOI] [PubMed] [Google Scholar]
- 14.Berry SM, Berry DA, Natarajan K, Lin CS, Hennekens CH, Belder R. Bayesian survival analysis with nonproportional hazards: metanalysis of pravastatin-aspirin. J Am Stat Assoc. 2004;99:36–44. [Google Scholar]
- 15.Hennekens CH, Sacks FM, Tonkin A, et al. Additive benefits of pravastatin and aspirin to decrease risks of cardiovascular disease: randomized and observational comparisons of secondary prevention trials and their meta-analyses. Arch Intern Med. 2004;164:40–44. doi: 10.1001/archinte.164.1.40. [DOI] [PubMed] [Google Scholar]
- 16.Gaydos B, Krams M, Perevozskaya I, et al. Adaptive dose-response studies. Drug Inf J. 2006;40:451–461. [Google Scholar]
- 17.Maca J, Bhattacharya S, Dragalin V, Gallo P, Krams M. Adaptive seamless phase II/III designs: background, operational aspects, and examples. Drug Inf J. 2006;40:463–473. [Google Scholar]
- 18.American Statistical Association. FDA/Industry Statistics Workshop. [2/26/09]; http://www.amstat.org/meetings/fdaworkshop/index.cfm?fuseaction=main.
- 19.Buzdar AU, Ibrahim NK, Francis D, et al. Significantly higher pathologic complete remission rate after neoadjuvant therapy with trastuzumab, paclitaxel, and epirubicin chemotherapy: results of a randomized trial in human epidermal growth factor receptor 2–positive operable breast cancer. J Clin Oncol. 2005;23:3676–3685. doi: 10.1200/JCO.2005.07.032. [DOI] [PubMed] [Google Scholar]
- 20.Giles FJ, Kantarjian HM, Cortes JE, et al. Adaptive randomized study of idarubicin and cytarabine (IA) versus troxacitabine and cytarabine (TA) versus troxacitabine and idarubicin (TI) in untreated patients 50 years or older with adverse karyotype acute myeloid leukemia. J Clin Oncol. 2003;21:1722–1727. doi: 10.1200/JCO.2003.11.016. [DOI] [PubMed] [Google Scholar]
- 21.Inoue LYT, Berry DA, Parmigiani G. Relationship between Bayesian and frequentist sample size determination. Am Stat. 2005;59:79–87. [Google Scholar]
- 22.Huang X, Biswas S, Oki Y, Issa JP, Berry DA. A parallel phase I/II clinical trial design for combination therapies. Biometrics. 2007;63:429–436. doi: 10.1111/j.1541-0420.2006.00685.x. [DOI] [PubMed] [Google Scholar]
- 23.Zhou X, Liu S, Kim ES, Lee JJ. Bayesian adaptive design for targeted therapy development in lung cancer—a step toward personalized medicine. Clin Trials. 2008;5:181–93. doi: 10.1177/1740774508091815. [DOI] [PMC free article] [PubMed] [Google Scholar]
- 24.Ashby D. Bayesian statistics in medicine: a 25 year review. Stat Med. 2006;25:3589–3631. doi: 10.1002/sim.2672. [DOI] [PubMed] [Google Scholar]
- 25.Ameer B. Novel trial design: a report from the 19th frontiers symposium of ACCP. J Clin Pharmacol. 2008;48:793–798. doi: 10.1177/0091270008319332. [DOI] [PubMed] [Google Scholar]
- 26.Hobbs BP, Carlin BP. Practical Bayesian design and analysis for drug and device clinical trials. J Biopharm Stat. 2008;18:54–80. doi: 10.1080/10543400701668266. [DOI] [PubMed] [Google Scholar]
- 27.Booth CM, Calvert AH, Giaccone G, Lobbezoo MW, Eisenhauer EA, Seymour LK. Design and conduct of phase II studies of targeted anticancer therapy: recommendations from the task force on methodology for the development of innovative cancer therapies (MDICT) Eur J Cancer. 2008;44:25–29. doi: 10.1016/j.ejca.2007.07.031. [DOI] [PubMed] [Google Scholar]
- 28.Campbell G. Statistics in the world of medical devices: the contrast with pharmaceuticals. J Biopharm Stat. 2008;18:4–19. doi: 10.1080/10543400701668225. [DOI] [PubMed] [Google Scholar]
- 29.Moyé LA. Bayesians in clinical trials: asleep at the switch. Stat Med. 2008;27:469–482. doi: 10.1002/sim.2928. [DOI] [PubMed] [Google Scholar]
- 30.Chen MH, Ibrahim JG. The relationship between the power prior and hierarchical models. Bayesian Anal. 2006;1:551–574. [Google Scholar]
- 31.Berry DA, Stangl DK. Bayesian Biostatistics. Marcel Dekker; 1996. [Google Scholar]
- 32.Spiegelhalter DJ, Abrams KR, Myles JP. Bayesian Approaches to Clinical Trials and Health-Care Evaluation. Wiley; 2004. [Google Scholar]
- 33.Berry DA. Bayesian statistics and the efficiency and ethics of clinical trials. Stat Sci. 2004;19:175–187. [Google Scholar]
- 34.WinBUGS and BUGS computer programs. [2/23/09]; Available at http://www.mrc-bsu.cam.ac.uk/bugs/
- 35.Lunn DJ, Thomas A, Best N, Spiegelhalter D. WinBUGS — a Bayesian modelling framework: concepts, structure, and extensibility. Stat Comput. 2000;10:325–337. [Google Scholar]
- 36.BRugs computer program. [2/23/09]; Available at http://www.biostat.umn.edu/∼brad/software/BRugs/BRugs_install.html.
- 37.Biostatistics and clinical trial computer programs. [February 23, 2009]; Available at http://biostatistics.mdanderson.org/SoftwareDownload/
- 38.McCarthy A. Is it time to change the design of clinical trials? [2/26/09];Cure Magazine. 2006 Summer; http://www.curetoday.com/index.cfm/fuseaction/article.show/id/2/article_id/371.