

Abstract
We measured the behavioral time course of endogenously cued attentional shifts while recording from neurons in the middle temporal area (MT) and lateral intraparietal area (LIP) of two macaque monkeys. The monkeys were required to detect a subtle speed change of one of two continuously moving stimuli. The likely location of the speed change was cued throughout each trial but could switch at an unpredictable time. Attention was evident as an improvement in detection ability and reaction time at the cued location, and the focus of attention shifted over a 400 ms period in response to a switch of the cued stimulus. Attention modulated the ongoing neural response in both MT and LIP, and the sign of this modulation also rapidly shifted after a cue switch. Our data provide a framework for understanding the link between the neural and behavioral effects of attention. The responses of single neurons to the test stimulus in MT and LIP were correlated with stimulus detection and reaction time and, at the population level, a spike-rate threshold model was able to account for the effect of attention on detection rate and reaction time. In this view, the time course of the attentional shift can be understood as an interaction between the emerging attentional modulation and the neural response to the test stimulus in LIP. We also present evidence that the threshold model is not wholly explained by sensory (feedforward) information but may also be influenced by cognitive (feedback) processes at the time of stimulus detection.
Introduction
Selective attention is the increase in perceptual speed and accuracy when specific locations or features in a scene are cued (Posner, 1980; Luck et al., 1996; Pashler, 1999; Carrasco et al., 2000). To be useful, attention must be dynamically allocable. For spatial attention, the rate at which attention can be shifted from one location to another depends in part on how the shift is signaled (Egeth and Yantis, 1997). An abrupt cue at the location to be attended (an exogenous cue) produces a rapid shift of attention (measured by increases in accuracy or decreases in reaction time at the cued location), peaking within 100–200 ms of the cue (Kröse and Julesz, 1989; Müller and Rabbitt, 1989; Nakayama and Mackeben, 1989; Cheal and Lyon, 1991; Mackeben and Nakayama, 1993; Bisley and Goldberg, 2003). In contrast, more abstract cues, such as an arrow pointing to the location to be attended (an endogenous cue), produce slower shifts, peaking ∼400 ms after cue presentation (Müller and Rabbitt, 1989; Cheal and Lyon, 1991; Müller et al., 1998).
In the monkey, neural responses are modulated by attention throughout the brain, including in the superior colliculus (Goldberg and Wurtz, 1972; Robinson and Kertzman, 1995), in the thalamus (Petersen et al., 1985; McAlonan et al., 2008), and broadly in the visual cortex (Moran and Desimone, 1985; Treue and Maunsell, 1996; Reynolds et al., 2000). These neural modulations are presumed to underlie the observed improvement in behavioral performance; consequently, behavioral and neural shifts of attention should share similar time courses. Few studies have addressed this question directly. In humans, the onset of attentional modulation of scalp potentials correlates with the onset of behavioral attentional effects across subjects (Müller et al., 1998). In nonhuman primates, two studies have characterized the time course of attentional shifts, in primary visual cortex (V1) (Khayat et al., 2006) and visual cortical area 4 (V4) (Motter, 1994), although neither study measured behavioral correlates of attention. In the lateral intraparietal area (LIP), neural firing is known to shift with changes in motor plan (Bracewell et al., 1996), and Bisley and Goldberg (2003) reported that the time course of the population-average neuronal response to a flashed stimulus predicted how long attention was drawn to the location of the stimulus, although the temporal resolution for measuring the behavioral attentional shift was limited to >100 ms.
To more directly compare neurophysiology and behavior during shifts of attention and to more generally to explore how attentional modulation of neuronal activity produces improvements in perception, we trained two monkeys on an attention-shift task in which they endogenously shifted attention between two peripheral targets in response to a central cue. We systematically probed the animals' attentional state by having them detect near-threshold test stimuli in a valid–invalid cueing paradigm while simultaneously recording single-neuron activity in the middle temporal area (MT) and LIP.
We found that a simple spike-rate threshold model provides a surprisingly good explanation for the effects of attention on behavioral performance. The model also provides a framework for understanding the time course of attentional shifts, assuming an interaction between the emerging attentional modulation and the neural response to the test stimulus. However, some of our additional observations challenge the “feedforward” interpretation of such threshold models.
Materials and Methods
Attention-switch task
Figure 1 shows a schematic of the attention-switch task. At the beginning of a trial, the stimulus consisted of a central fixation spot and two blurred annuli, one red and one green, in opposite hemifields at equal eccentricity. Once the monkey fixated, two patches of randomly arrayed dots appeared, one within each annulus, and immediately began to move. Within a patch, all the dots moved in the same direction and at the same, constant speed, and each dot continued moving until it completely crossed the annulus (i.e., unlimited lifetime). The monkey's task was to release a touch bar within 200–600 ms after the onset of a 53 ms duration (four video frames) increase in the speed of the moving dots (the “speed pulse”). The speed pulse could occur at either one of the two dot patches at an unpredictable time after the onset of the motion of the dots. At the end of the 53 ms speed pulse, the speed of the moving dots returned immediately to the original speed.
Figure 1.

Attention-switch task design. Trials began with the appearance of a fixation point and two peripheral annuli. After fixation, 100% coherent moving dots appeared within the annuli. The monkey released a touch bar to indicate detection of a 53-ms-duration (4 video frames) speed increase at either dot patch. Matching fixation point and annulus color indicated the likely location of the speed pulse (85% valid cues). On 40% of trials, the fixation-point color switched midtrial, indicating that the likely speed-pulse location had switched. After a 400 ms fixed delay, speed-pulse times and cue-switch times were chosen form an exponential distribution (mean of 1 s).
Although the speed pulse could occur at either dot patch, the color of the fixation point (red or green) cued the monkey as to which patch was more likely to contain the speed pulse. If the color of the annulus matched that of the fixation point, there was an 85% probability that the speed pulse would occur within that annulus and a 15% probability that the speed pulse would occur within the other annulus (i.e., the color cue was valid on 85% of trials and invalid on 15% of trials). On 40% of trials, chosen at random, the fixation-point color cue switched at an unpredictable time during the trial to indicate that the likely speed-pulse location had instantaneously switched. That is, the motion patch that previously had an 85% probability of containing the speed pulse now had a 15% probability and vice versa. Each trial had at most one cue switch. After an initial fixed delay of 400 ms, additional delays until speed pulses and cue switches, as well as between cue switches and speed pulses, were selected randomly from an exponential distribution (mean of 1 s) so that the monkey could not predict event timing (Luce, 1986).
The location of the initially cued patch and the color of the annuli were alternated in blocks of 50 and 200 trials, respectively. Thus, after 400 trials every combination of annulus color [in the receptive field (RF)] and initially cued location had been tested. Individual neurons were recorded for as many trials as possible (median, 657 trials; range, 200–1960).
The monkey had to maintain gaze within a fixation window throughout the trial (2° × 2° square, centered on fixation spot). After the monkey fixated, there was a 500 ms delay before the two dot patches appeared within the annuli (“dot onset”). Stimuli were presented on a computer monitor positioned 57 cm in front of the animal (40° × 30°; 75 Hz refresh; 1152 × 870 resolution; background luminance was near black, 0.001 cd/m2). The fixation point was a 0.4° diameter red or green circle (luminance in cd/m2: monkey M, red: 2.7, green: 3.0; monkey B, red: 2.4, green: 5.2). Dot-patch stimuli consisted of square dots with 0.1° sides, at a density of 7 dots/degrees2 and moving at 12°/s. Dot luminance was 0.01 cd/m2. We chose to use low-contrast stimuli following reports suggesting that attentional modulation is largest at low contrast (Martinez-Trujillo and Treue, 2002; Reynolds and Desimone, 2003). Annuli surrounding the moving dot patches were 0.5° thick and separated from the dot patches by 0.5°. The annuli were blurred with a Gaussian luminance profile to reduce edge effects (peak luminance in cd/m2: monkey M, red: 0.2, green: 0.4; monkey B, red: 0.3, green: 0.3).
Before the attention-switch task was run for each neuron, we first mapped the receptive-field location of the neuron using a combination of hand-controlled stimuli, automated mapping with a flashed spot of light, and a memory-guided saccade task (for LIP) (Maimon and Assad, 2006). When possible, dot patches were placed in the center of the receptive field of the recorded neuron. Eccentricities ranged from 5 to 16°. The direction of the motion of the dot patch in the receptive field was set to the preferred direction of the neuron as determined by a direction-mapping task that was also run before the main task (Fanini and Assad, 2009). The other dot patch was always placed at the equivalent position reflected across the fixation point and had the opposite direction of motion. The sizes of the dot patches were scaled with eccentricity (ranging from 4.5° to 9.4° in diameter). The magnitude of the speed change during the speed pulse was chosen to maintain valid correct performance in a target range of 65–75% correct and thus varied somewhat from session to session (range for monkey B, 1.6× to 2.5×; range for monkey M, 1.35× to 1.7×). We used a target of 65–75% correct on valid trials because we found that this performance range gave the largest difference in performance compared with invalid trials, i.e., it yielded the largest behavioral attentional effect.
Data collection
All animal procedures, including animal surgeries and postoperative care, conformed to guidelines of the National Institutes of Health and the Institutional Animal Care and Use Committee at Harvard Medical School. Before the animals were trained, surgery was performed to implant a head-restraining post, scleral eye coil, and recording chamber. The recording chamber was placed at stereotactic coordinates (3 mm posterior, 10 mm lateral relative to interaural zero) and allowed a dorsal approach to areas MT and LIP. The chamber was outfitted with a guide-tube/grid system (Crist Instrument). Magnetic resonance imaging was used to confirm sulcal anatomy and chamber placement. Single-unit recordings were conducted using tungsten microelectrodes (75 μm diameter, 5 MΩ impedance; FHC). Single-unit action potentials were isolated using a dual window discriminator (Bak Electronics) and recorded at 1 ms resolution. Horizontal and vertical eye position were monitored using a scleral search coil (Riverbend Instruments) and recorded at 200 Hz. Spike and eye-position recording, stimulus presentation, and task control were handled by a Macintosh computer running custom software with a computer interface (ITC-18; InstruTECH Corporation).
MT and LIP cells were identified by reference to sulcal anatomy and characteristic physiology. MT cells were characterized by highly direction-selective receptive fields with diameters approximately equal to eccentricity (Maunsell and Van Essen, 1983, 1987). LIP cells were characterized by robust, spatially tuned responses in a memory delayed saccade task (Barash et al., 1991). Additionally, cells were considered within the target area if they were encountered between cells with characteristic properties. All such stably isolated units were recorded while the animal performed the attention-switch task.
Data analysis
Spike-rate functions for individual cells were generated by convolving 1-ms-binned histograms with a Gaussian (SD of 20 ms unless otherwise stated). Population spike-rate functions were calculated by averaging across all single trials in the population. For neural activity aligned on dot onset, data were included up until the time of the speed pulse (on no-switch trials) or cue switch (on switch trials). For neural activity aligned on cue switch, data were included from 400 ms after dot patch onset (to exclude the onset transient from the pre-switch data) until the time of the speed pulse. All trials were included in the analysis. On trials with false-positive releases or fixation breaks, data were included up until 300 ms before the release or break. When normalized data were used, the raw spike rate of each trial was divided by average spike rate of that neuron for the 500 ms before speed pulses calculated from all correct and missed trials.
The effect of attention on the neural response was expressed as an attentional index (AI) equal to (RIN − ROUT)/(RIN + ROUT), where RIN and ROUT are the neural responses when attention is directed to or away from the RF location, respectively. For calculating the average response, we excluded data from the 400 ms after stimulus onset and 300 ms after cue switches when attentional modulation was either not yet established or was rapidly changing. Because of the random timing of task events, trials were of variable length. The average response rate was computed as a single average (as if data were appended to form a single long trial) as opposed to an average of single-trial response rates. In this way, the contribution of individual trials to the average response is proportional to their length. The significance of the AI for each neuron was assessed using a permutation analysis. Each trial was randomly reassigned (attended or unattended) and the AI was recalculated. The process was repeated 10,000 times, and the original AI was considered significantly different from chance if it was greater than or less than 97.5% of the permuted AI values (p < 0.05).
Threshold detect probability.
To quantify capability of a neural activity threshold to distinguish correct from missed trials for single neurons, we calculated an index we call the threshold detect probability (tDP) that is analogous to detect probability calculated based on spike counts (Cook and Maunsell, 2002a). For each neuron, a single-trial spike-rate function was generated for each correct or missed trial (Gaussian smoothing, SD of 40 ms). A series of spike-rate thresholds were then tested spanning the entire dynamic range of all single-trial response functions in 0.1 spikes/s increments. For each threshold, we determined the fraction of missed and correct trials that crossed threshold within 50–400 ms after the speed pulse. Plotting the fraction of missed versus fraction correct for all thresholds generated a curve analogous to a receiver operating characteristic (ROC) curve. The area under the ROC curve we call the tDP. It corresponds to the probability that the spike-rate function on a randomly chosen correct trial has a higher peak response than a spike-rate function of a randomly chosen missed trial.
Threshold-crossing analysis.
For the threshold-crossing analysis and correlation with reaction time, we first generated a distribution of reaction times for all trials. We then divided the trials into equal groups according to the reaction time on each trial. We used 20 such groups for validly cued trials and three groups for invalidly cued trials. The single-trial spike-rate function was first smoothed by convolving with a Gaussian function (SD of 20 ms) and then normalized by dividing by the average pre-speed-pulse spike rate on attended trials. This reduced small baseline offsets that arose because individual neurons were not perfectly equally represented in each reaction-time group. All trials in each group were then averaged together to generate a population spike-rate function for each reaction-time group. We then tested a series of response thresholds that met two criteria: (1) at least 80% of curves (19 of the 23 valid and invalid curves) had to cross the threshold, and (2) the average response on missed trials could not cross the threshold. For each threshold, the crossing point for each curve was determined. If there was more than one threshold crossing for a given curve, only the first was counted. For each threshold, we also plotted the time of threshold crossing for each reaction-time group against the average reaction time for that group and performed a regression analysis. The best threshold was considered the one with the greatest correlation between threshold crossing and reaction time (i.e., maximum r2). The results of this analysis were not substantially affected by the precise number of reaction-time groups or the SD of the Gaussian function used to smooth the single-trial spike-rate function.
A similar analysis was performed on individual neurons in the dataset. For the single-neuron analysis, five valid and one invalid reaction-time groups were used and the single-trial spike-rate functions were smoothed by convolving with a Gaussian function (SD of 40 ms). The best threshold was taken as the one that was crossed by at least five of six curves and that had the greatest correlation (maximum r2) when threshold-crossing time was regressed against average reaction time. Unlike for the population analysis, the threshold was allowed to cross the average response from missed trials. Regression slopes were calculated using standard methods of linear regression.
Summation model.
We modeled the interaction between the speed-pulse response and the shifting attentional modulation using a simple summation model based on the LIP population responses to the speed pulse and cue switch. For each monkey, we calculated a population speed-pulse response from the average of all correct and missed validly cued trials. We used data from the time of the speed pulse until 50 ms after the peak of the response (until 311 ms for monkey M and 208 ms for monkey B) so as to include the activity reflecting the later-peaking responses evident in Figure 10. After subtracting a baseline equal to the mean spike rate from the 200 ms before the speed pulse, we added this response to both the OUT–IN and IN–OUT peri-switch neural activity at various time shifts to simulate speed pulses occurring at various times relative to the cue switch.
Figure 10.

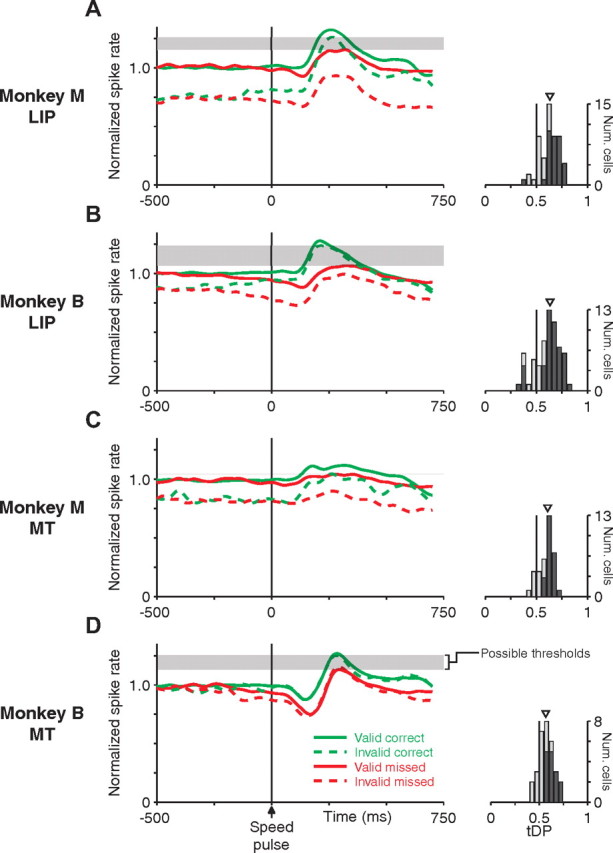
A threshold model to explain reaction time. A–D, Left panels show the normalized population average spike rate aligned on the time of the speed pulse for LIP (A, B) and MT (C, D), shown separately for monkey M (A, C) and monkey B (B, D). The correct responses on valid-cue trials (speed pulse at cued location) and invalid-cue trials (speed pulse at uncued location) were divided into groups by reaction time (20 groups for valid, 3 groups for invalid). Each group had an equal number of trials. For clarity, only every other valid group and the middle invalid group are shown. Individual trials were normalized before averaging as for Figure 8. Responses from missed trials are shown for both valid (thick solid line) and invalid (thick dashed line) speed pulses. The distribution of reaction times are shown for valid trials (light gray histogram) and invalid trials (dark gray histogram), and the mean reaction time for each group is marked by the colored vertical line. The thin horizontal line marks the response threshold that both did not cross the average neural response on missed trials and maximized the correlation between threshold crossing time and reaction time for correct valid and invalid trials (see Materials and Methods). Right top panels show the correlation between reaction time and threshold crossing for this best threshold. In A and C, only two of the three invalid curves crossed threshold. Right bottom panels show the distribution of regression slopes for the threshold crossing regressed on reaction time for individual neurons (see Materials and Methods).
Results
Behavioral measures of attention
We trained two monkeys on an attention-switch task (Fig. 1) (see Materials and Methods). The task used a valid–invalid cueing paradigm to direct the monkey's attention to one of two peripheral patches of moving dots to detect a transient speed increase (the speed pulse). On 40% of trials, randomly interleaved, the cued location switched midtrial, allowing us to monitor the time course with which attention shifted from the previously cued to the newly cued location. By having near-threshold speed pulses occur at either the cued or uncued location (a “valid” or “invalid” cue, respectively), we could assess the monkey's attentional state during performance of the task. Consistent with previous work in monkeys and humans (Posner, 1980; Ciaramitaro et al., 2001; Cook and Maunsell, 2002b), both monkeys exhibited increased detection frequency and decreased reaction times for speed pulses at the cued relative to uncued location (Fig. 2) (supplemental Fig. 1, available at www.jneurosci.org as supplemental material). Figure 2, A and B, and supplemental Figure 1, A and B (available at www.jneurosci.org as supplemental material), show the distributions of the effects of attention on fraction detected and reaction time for all individual behavioral sessions. These behavioral sessions consist of the data collected during recording session of each neuron (91 sessions for monkey M, 95 sessions for monkey B) as well as data from separate behavioral sessions without neural recording (38 sessions for monkey M, 70 sessions for monkey B). The effect of attention was quantified for each session as the difference in fraction of speed pulses detected (Fig. 2A,B) or the difference in mean reaction time between validly cued and invalidly cued trials (supplemental Fig. 1A,B, available at www.jneurosci.org as supplemental material). Behavior was analyzed separately depending on whether the speed pulse occurred on a no-switch trial (before the cue switch occurred) or a switch trial (after the cue switch occurred). For post-switch behavior, we excluded trials in which the speed pulse occurred within 300 ms of the cue switch to allow behavior to reach steady state (see below for description of the time course). The effects of attention on fraction detected and reaction time were evident in essentially every behavioral session during the months of data collection. The mean effect of attention on single-session behavior was highly significant for both pre-switch and post-switch for all four comparisons for both animals [p < 0.001, t test, four possible comparisons: pre/post switch (2) × reaction time/fraction detected (2)].
Figure 2.

Effect of cue on fraction of speed pulses detected (FD). A, B, Distribution of performance improvement with cue for individual behavioral sessions (valid-cue FD − invalid-cue FD). Data are shown separately for no-switch (A) and switch (B) trials. The triangle marks the median value for each monkey. For details, see Results. C–F, Fraction of speed pulses detected is plotted as a function of the time the speed pulse occurred. Data from all behavioral sessions were combined. Data are shown separately for speed pulses occurring at the cued dot patch versus uncued dot patch. For no-switch trials (C, E), speed-pulse times are plotted with respect to dot onset. For switch trials (D, F), speed-pulse times are plotted with respect to the cue switch. Data were smoothed using a sliding window four video frames (53 ms) wide. Shaded regions are 95% confidence intervals for the mean. G, H, False-positive response rate as a function of time relative to dot onset (G) and cue switch (H) for monkey M (red) and monkey B (blue). The pattern of false-positive responses is similar for the two animals despite a fivefold difference in average false-positive rates. Below each panel is the hazard rate function for the speed pulse. The hazard rate is the probability that the speed-pulse would occur at that time given that it had not occurred previously.
The random delays until the speed pulse or cue switch, or between the cue switch and speed pulse on switch trials, were chosen from an exponential distribution. Thus, these events occurred with a uniform hazard rate such that the instantaneous probability for any event was constant independent of elapsed time within a trial. We designed the task timing in this manner to encourage a relatively constant allocation of attention pre-switch and post-switch, which in turn would facilitate determination of the time course of the attentional switch. The time course of these behavioral attentional effects for data pooled across all behavioral sessions is shown in Figure 2C–F and supplemental Figure 1C–F (available at www.jneurosci.org as supplemental material). For both fraction detected and reaction time, the effect of attention was evident for even the earliest speed-pulse times tested (400 ms after dot onset) and was indeed constant independent of time within the trial for both no-switch and switch trials (excluding a short period during the attentional shift). Presumably, this reflects the uniform hazard rate governing the timing of the speed pulses, as suggested previously (Ghose and Maunsell, 2002; Janssen and Shadlen, 2005).
For monkey B, the behavioral effects of attention were larger post-switch than pre-switch for both fraction detected (mean ± SE single-session valid–invalid difference: pre-switch, 0.20 ± 0.01; post-switch, 0.29 ± 0.01; p < 0.001, paired t test) and reaction time (mean ± SE single-session valid–invalid difference: pre-switch, −7.6 ± 0.6; post-switch, −13.4 ± 1.2; p < 0.001, paired t test). This was the result of unchanged performance on valid trials and a decrease in performance on invalid trials (overall pre-switch vs post-switch fraction detected: valid, 0.67 vs 0.68, p = 0.40; invalid, 0.47 vs 0.37, p < 0.001, χ2 test). One possibility is that, for monkey B, attention was more split before the cue switch and more focused after the cue switch. In contrast to monkey B, in monkey M, there was no measurable difference in attention before and after a cue switch for either fraction detected (mean ± SE single-session valid–invalid difference: pre-switch, 0.46 ± 0.01; post-switch, 0.45 ± 0.01; p = 0.63, paired t test) or reaction time (mean ± SE single-session valid–invalid difference: pre-switch, −20.4 ± 1.9; post-switch, −25.5 ± 2.8; p = 0.17, paired t test). This was because there was a comparable improvement in performance for both valid and invalid trials (pre-switch vs post-switch fraction detected: valid, 0.79 vs 0.85, p < 0.001; invalid, 0.33 vs 0.40, p < 0.001, χ2 test).
It is not immediately clear what drove the observed differences between pre-switch and post-switch performance. Although the timing of the speed pulse was chosen from the same exponential distribution for no-switch and switch trials, the hazard rate for a speed pulse was higher after a cue switch than before (Fig. 2G,H, bottom axes). After dot onset, the first event could be either a cue switch (40% of trials) or a speed pulse (60% of trials). Because there was at most one cue switch, after a cue switch, the next event was always a speed pulse (100% of trials). Thus, the instantaneous probability of a speed pulse increased by 66% after a cue switch. This could also account for the increased attentional modulation of firing rate after the cue switch (see below). Consistent with this view, both animals showed a marked increase in the rate of false-positive responses after a cue switch (Fig. 2G,H, pre-switch vs post-switch plateau false-positive rate per second: monkey B, 0.03 vs 0.06 and monkey M, 0.17 vs 0.44). This increased false-positive rate could also reflect an enhanced state of attention or vigilance.
The change in behavior before and after cue switches may reflect a change in sensitivity, a change in response bias, or a combination. In principle, signal-detection theory provides a theoretical framework to distinguish between these two possibilities based on the correct detection and false-positive response rates. However, because the monkey's response (a lever release) did not distinguish at which location the monkey may have perceived the speed pulse, we cannot assign a false-positive response to a particular location in our dataset. This limits the utility of the false-positive rate for formal analysis. However, it was critical in our experiment that the animals give the same response to speed pulses at either screen location so that differences in detection rate would not be attributable to a response bias that could mimic attention.
Behavioral time course of the attentional shift
On switch trials, the speed pulse could occur simultaneously with the cue switch or at any video frame after the cue switch (75 Hz monitor refresh rate, 13.3 ms per frame). As expected, on switch trials, the behaviorally favored location switched from the initially cued patch to the newly cued patch. We expected that the behavioral traces would cross each other at some time after the cue switch. Surprisingly, the behavioral switch appeared to be well underway even for speed pulses that occurred simultaneously with the cue switch [time 0 in Fig. 2D,F and supplemental Fig. 1D,F (available at www.jneurosci.org as supplemental material)]. Looking at the fraction of speed pulses detected, the performance at the newly cued patch was already significantly better when the cue switch occurred simultaneously with the speed pulse (fraction of speed pulses detected: valid vs invalid, monkey M, 0.62 vs 0.42, p < 0.001; monkey B, 0.55 vs 0.43, p < 0.001, χ2 test). Looking at reaction time, the performance was initially overlapping but separated for speed pulses occurring within 100 ms after the cue switch.
How could the behavioral switch have occurred so soon after the cue switch? The monkeys could not predict the timing of the cue switch to facilitate their attentional shifts; the exponential probability distributions governing task timing were chosen specifically to prevent this strategy, and switch trials were randomly interleaved with no-switch trials. Furthermore, the timing of cue switches was drawn from the same exponential distribution that was used to select the speed-pulse time on no-switch trials. Therefore, the consistency of the behavior on no-switch trials over a broad range of task times (Fig. 2C,E) (supplemental Fig. 1C,E, available at www.jneurosci.org as supplemental material) likewise demonstrates that the monkeys were not prematurely switching attention.
Moreover, the particular color-matching cue that we used did not appear to have allowed for uniquely rapid shifts of attention. For monkey B, we also collected behavioral data in a task that was identical to the attention-switch task except that the attentional cue was a small line (length of 0.8°) extending from the fixation point toward the cued patch. On switch trials, the line was immediately reoriented to point at the newly cued patch. The fixation point and annuli were gray. We left the annuli in place, although they were no longer informative, to facilitate comparison between this task and the original attention-switch task. Supplemental Figure 2 (available at www.jneurosci.org as supplemental material) shows the behavioral time course for fraction detected and reaction time in this non-color-based attention-switch task. The results were very similar to those from the original color attention-switch task. For fraction detected, the shift of attention was again evident for speed pulses occurring even simultaneously with the cue switch. For reaction time, the shift was evident for speed pulses occurring within ∼100 ms of the cue switch. The apparently rapid shift of attention we observed was not unique to the use of a color-matching cue.
To capture more fully the time course of the behavioral change, we collected data from additional sessions that were identical to the attention-switch task, except that, on 5% of the trials, the speed pulse occurred at one of eight times in the 400 ms immediately before a cue switch. The results from this task are shown in Figure 3(fraction of motion pulses detected) and supplemental Figure 3 (available at www.jneurosci.org as supplemental material) (reaction time). The post-switch behavioral results from this dataset showed that the performance had already crossed over at the earliest times after the cue switch, entirely consistent with the original dataset. Additionally, the beginning of the behavioral switch was already evident for speed pulses occurring even 150–200 ms before the cue switch. For both fraction detected and reaction time, we observed a net decrease in behavioral performance over this time window (a decrease in fraction detected and an increase in reaction time). The valid and invalid curves then crossed during a time window spanning ±50 ms of the cue switch. Notably, for speed pulses occurring earlier than 200 ms before the cue switch, the difference in performance between valid and invalid motion patches was consistent with that from trials without cue switches.
Figure 3.

Behavioral shift of attention begins for speed pulses occurring before the cue switch. Fraction of speed pulses detected for various speed-pulse times relative to the cue switch are shown for monkey M (A) and monkey B (B). For pre-cue-switch behavior, speed pulses occurred randomly at fixed times spaced four video frames (∼53 ms) apart. For post-cue-switch behavior, speed pulses could occur at any video frame, but data were smoothed using a sliding window four video frames wide. Error bars and shaded regions are 95% confidence intervals for the mean. Time points with significant differences are marked by an asterisk, with the color indicating the condition with the greater detection rate (p < 0.05, χ2 test).
If the monkeys could not predict the time of the cue switch, how could the behavioral performance have crossed over before the cue switch? It is important to note that, even if a speed pulse occurs before or simultaneous with the cue switch, the monkey does not report that speed pulse until after a reaction-time delay of several hundred milliseconds. During that reaction-time delay, the neural representation of the speed pulse could be “buffered” in some way, such that a subsequent cue switch is able to interact with that stored representation and influence the behavioral response. By necessity, this interaction must occur sometime in the ∼400 ms between when the speed pulse occurred and when the animals released the touch bar (mean ± SD reaction time on valid trials: monkey M, 415 ± 57 ms; monkey B, 471 ± 45 ms). What is the nature of this interaction, and where in the brain does it occur? In the next section, we address these questions by examining the activity of neurons in the dorsal visual pathway during the attention-switch task.
We also noted an asymmetry in the time course of the attention shift; accuracy worsened at the previously cued location before it improved at the newly cued location, resulting in a net decrease in accuracy around the time of the attentional shift (Fig. 3). Notably, the decrease in accuracy was limited to the cued location, with no evident decrease below baseline for test stimuli at the uncued location. This suggests that the decrease did not arise from a general decrease in responsiveness after the cue switch. Rather, shifting attention may incur an obligatory performance “cost,” analogous to the cost of saccadic suppression during overt attentional shifts (Burr et al., 1994), and/or attention may be momentarily captured by the color change at the fixation-point cue (Lambert et al., 2003). However, a similar decrease in performance has been observed in another study of shifting spatial attention in which the attentional shift was not triggered by an abrupt cue (Bisley and Goldberg, 2003, 2006).
Neuronal effects of attention
We recorded from 118 LIP neurons (55 from monkey M, 63 from monkey B) and 67 MT neurons (36 from monkey M, 31 from monkey B) during performance of the attention-switch task. Neurons in MT and LIP were modulated by the locus of attention. Figure 4 shows the response of a single LIP neuron during the task. The onset of the dot stimuli triggered a transient response followed by a sustained response that was larger when the dot stimulus in the receptive field of the neuron was cued (cyan) relative to when it was uncued (blue) (Fig. 4A). The attentional modulation reached steady state within ∼500 ms of the onset of the dot stimuli and was constant thereafter. On switch trials, we observed a rapid reversal of attentional modulation shortly after cue switches, reflecting the reallocation of spatial attention (Fig. 4B).
Figure 4.

Responses of a single LIP neuron. Left panels show peristimulus time histograms (PSTHs) and corresponding single-trial rasters for non-switch trials, aligned on the initial onset of the moving dots. Right panels show PSTHs and corresponding single-trial rasters for switch trials, aligned on the cue switch. Neural activity is shown separately depending on whether the trial began with the cued stimulus in the receptive field (cyan) or out of the receptive field (blue). In the raster plots, trials are arranged based on the time of the speed pulse (open symbols), with shorter to longer times arranged from top to bottom. For clarity, only trials in which the cue switch occurred >700 ms after dot onset are shown. Data from each trial were averaged into the PSTHs only up until the time of the speed pulse on that trial. Single-trial responses were smoothed by convolving with a Gaussian (SD of 20 ms) before averaging.
Figures 5 and 6 show the average population neural activity in LIP and MT in the two monkeys. Averages included data from individual trials only up until the time of the speed pulse. In the left panels, neural responses are shown aligned to the onset of random-dot motion. On average, cells in both MT and LIP exhibited sustained increased spike rates when attention was cued to the dot patch in the receptive field. Although the attentional cues (fixation point and annuli) were present during the baseline period before dot onset, neural activity was only weakly modulated by attention during this period. After dot onset, attentional modulation emerged within ∼500 ms in both areas and was maintained at a remarkably constant level throughout the trial. The right panels of Figures 5 and 6 show the population neural activity on switch trials aligned on the cue switch. Similar to the neuron from Figure 4, the sign of the modulation switched shortly after the cue switch, consistent with the reallocation of spatial attention to the newly cued dot patch. Similar to the pre-switch modulation, after the cue switch, the magnitude of attentional modulation was maintained at a constant level even out to several seconds after the cue switch. A detailed comparison between MT and LIP will be presented in a separate publication.
Figure 5.

Average LIP activity aligned on dot onset or cue switch. A–D, Average LIP population firing rate aligned on dot onset (A, C) or cue switch (B, D) for monkey M (A, B) or monkey B (C, D). Averages were calculated across all single trials for all neurons recorded (55 cells for monkey M, 63 cells for monkey B). Average activity when the initially cued dot patch was in the receptive field (cyan) or out of the receptive field (blue) are plotted separately. The modulation of attention is relatively constant throughout a trial but switches shortly after a cue switch. E, F, The impact of attention on the neural response of single neurons was quantified using an AI (see Materials and Methods). Histograms depict the distribution of AI values for monkey M (blue) and monkey B (red). Neurons with an AI significantly different from 0 (p < 0.05 by permutation test, see Materials and Methods) are shown as dark bars and remaining neurons as light bars.
Figure 6.

Average MT activity aligned on dot onset or cue switch. A–D, Average MT population firing rate aligned on dot onset (A, C) or cue switch (B, D) for monkey M (A, B) or monkey B (C, D). Averages were calculated across all single trials for all neurons recorded (31 cells for monkey M, 36 cells for monkey B). Average activity when the initially cued dot patch was in the receptive field (cyan) or out of the receptive field (blue) are plotted separately. The modulation of attention is relatively constant throughout a trial but switches shortly after a cue switch. E, F, The impact of attention on the neural response of single neurons was quantified using an AI (see Materials and Methods). Histograms depict the distribution of AI values for monkey M (blue) and monkey B (red). Neurons with an AI significantly different from 0 (p < 0.05 by permutation test; see Materials and Methods) are shown as dark bars and remaining neurons as light bars.
We quantified the magnitude of attentional modulation for individual neurons by computing an attentional index (see Materials and Methods). The value of this index can range from −1 to 1, with 0 representing no modulation by attention. Positive and negative values indicate increased or decreased spike rates with attention, respectively. The distributions of single-neuron attentional indices are shown in Figures 5, E and F (LIP), and 6, E and F (MT). Median pre-switch and post-switch attentional indices were significantly greater than 0 for both areas in both monkeys (all p < 0.001, signed-rank test). Both areas in both monkeys exhibited greater post-switch attentional modulation than pre-switch attentional modulation (pre-switch vs post-switch attentional index, paired signed-rank test: monkey M, LIP, 0.144 vs 0.237, p < 0.001; MT, 0.069 vs 0.125, p < 0.001; monkey B, LIP, 0.045 vs 0.095, p < 0.001; MT, 0.015 vs 0.036, p = 0.003). This is consistent with increased attention in response to the increased speed-pulse hazard rate after the cue switch (see above).
Neural response to the speed pulse
Neurons in both LIP and MT showed phasic responses to the speed pulse when it occurred in the receptive field of the neuron. Figure 7 shows four example cells illustrating the diversity of responses. The typical LIP neuron responded to the speed pulse with a transient increase in spike rate (Fig. 7A). In contrast, the speed-pulse responses in MT were more variable on a neuron-by-neuron basis. Some neurons in MT exhibited transient suppression by the speed pulse, followed by a period of excitation (Fig. 7B). Other MT neurons exhibited solely excitation or suppression (Fig. 7C,D). The fact that some MT neurons were excited by the speed pulse and others inhibited may be attributable to their known sensitivity to speed. We used a single baseline speed of 12°/s for all of the neurons. In MT, this falls within the typical range of optimal speeds (∼8–40°/s) (Maunsell and Van Essen, 1983; Lagae et al., 1993; Cheng et al., 1994; Liu and Newsome, 2003), so some cells should prefer faster speeds and others prefer slower speeds than our baseline speed. Although the speed tuning of neurons in LIP has not been studied in detail, in other experiments, we have observed that LIP neurons are sensitive to speed and that optimal speeds tend to be larger than for MT (Fanini and Assad, unpublished results). This is consistent with the speed tuning in adjacent ventral intraparietal area (VIP), in which cells typically have peak responses at speeds in excess of 40°/s (Colby et al., 1993). Therefore, LIP neurons would generally be expected to show an increase in response to the speed pulse, because most neurons in LIP respond better to speeds faster than our baseline speed.
Figure 7.

Neural response to the speed pulse for four single neurons. The average spike rate after a speed pulse in the receptive field is shown for four single neurons. The spike rate function is the average from correct and missed trials, aligned on the start of the speed pulse. A, This LIP neuron responded with a transient increase in spike rate after the speed pulse, which was typical of the single neurons in the population. B–D, The responses of MT neurons were more diverse and exhibited biphasic (B), excitatory (C), and inhibitory (D) responses.
Several studies have used rise-to-threshold models to link neural activity with decision making in a variety of detection and timed-response tasks (Hanes and Schall, 1996; Reddi and Carpenter, 2000; Cook and Maunsell, 2002a; Roitman and Shadlen, 2002; Maimon and Assad, 2006; Churchland et al., 2008). The general form of these models is that neural activity is interpreted as a detector signal that accumulates information in an ongoing manner until it crosses an activity threshold at which point the decision is made. Such models have been used to explain both detection rate and reaction time. In theory, such a model might be extended to explain the improvement of both detection rate and reaction time with attention in our dataset. Assuming a fixed decision threshold, the increased neural response with attention would bring the baseline neural response closer to the threshold such that the transient speed-pulse response would cross threshold both more frequently and more rapidly when the speed pulse occurred at the attended versus unattended location.
To test this hypothesis, we plotted the population neural response aligned to the time of the speed pulse for speed pulses occurring in the receptive field of the neuron (Fig. 8, left). We plotted the responses separately depending on whether the monkey detected the speed pulse or not and whether the speed pulse occurred at the attended or unattended location (four conditions). The neural spike rate before speed pulses on attended trials was normalized to one (see Materials and Methods). We used normalized data to control for small baseline shifts between curves that arise because different neurons with different overall responsiveness are sampled somewhat unequally for the different curves. Normalizing the data thus provides a more accurate depiction of the relative activity between the curves across the population. However, using non-normalized spike rates produced a similar result.
Figure 8.
A threshold model can distinguish correct and missed trials using LIP or MT population responses. A–D, Left panels show the normalized population average spike rate aligned on the time of the speed pulse for LIP (A, B) and MT (C, D), shown separately for monkey M (A, C) and monkey B (B, D). Individual trials were normalized before averaging such that the prepulse spike rate for cued trials (correct plus missed) was equal to 1 (see Materials and Methods). Responses are split based on whether the speed pulse was at the cued location (i.e., valid-cue trials, solid lines) or uncued location (i.e., invalid-cue trials, dashed lines) and by whether the monkey correctly detected (green) or missed (red) the speed pulse on that trial. The average peak response to the speed pulse was larger on trials in which the speed pulse was correctly detected, independent of whether the speed-pulse location was cued. The horizontal shaded regions mark the range of response thresholds separating the responses of correct and missed trials. Each area had such a range, although the range was very narrow for area MT in monkey M (C). Histograms to the right show the distribution of tDP for individual neurons (see Materials and Methods). This metric tested the ability of a simple spike-rate threshold to distinguish single-trial neural responses between correct and missed trials. Values are consistently above 0.5, which corresponds to greater peak responses on correct than missed trials. Neurons with statistically significant tDP are shown as dark bars (neurons: monkey M, LIP, 34 of 55; MT, 24 of 36; monkey B, LIP, 47 of 63; MT, 15 of 31; p < 0.05, permutation test). Triangles mark the median value across each population.
For both MT and LIP in both monkeys, the average neural response after a speed pulse was larger on trials in which the speed pulse was correctly detected. Remarkably, the peak activity after correctly detected invalidly cued speed pulses was greater than the activity after missed validly cued speed pulses, despite the difference in baseline neural response attributable to attention. Thus, there exist a range of neural response thresholds, denoted by the shaded regions in Figure 8, that can distinguish correct from missed trials independent of attentional state, at least at the level of population activity.
To see whether a similar pattern was present for individual neurons in the population, we used an ROC analysis that we refer to as tDP (see Materials and Methods). The tDP is a nonparametric index of how well a simple spike-rate threshold could predict behavioral outcome on a trial-by-trial basis. It corresponds to the probability that the peak activity after a correctly detected speed pulse is greater for any pair of randomly selected correct and missed trials. A tDP of 0.5 indicates that a threshold cannot distinguish activity after correct and missed trials. Values of tDP greater or lesser than 0.5 indicate that neural activity on correct trials was greater or lesser than on missed trials, respectively. We calculated the tDP across all validly and invalidly cued trials. The distributions of tDP for the single neurons in our population are shown in the right panels of Figure 8. The mean values were significantly greater than 0.5 for both areas in both monkeys (monkey M: LIP, 0.63; MT, 0.61; monkey B: LIP, 0.63; MT: 0.57; all p < 0.001, two-tailed signed-rank test for median of 0.5). These values are comparable with or slightly greater than choice and detect probabilities observed for a range of discrimination and detection tasks, respectively (Britten et al., 1996; Dodd et al., 2001; Cook and Maunsell, 2002a; Grunewald et al., 2002; Williams et al., 2003; de Lafuente and Romo, 2005; Liu and Newsome, 2005; Purushothaman and Bradley, 2005; Uka et al., 2005; Gu et al., 2007). We have shown previously that small eye movements on average decrease both detection performance and neural responses and thus contribute on the order of 20% of the difference in the response between correct and missed trials (Herrington et al., 2009). However, elimination of trials with microsaccades from the analysis did not affect the capability of a threshold model to distinguish correct from missed trials.
The difference in activity between correct and missed trials tended to begin before the speed-pulse response. This resulted from both an increase in activity before correct trials and a decrease in activity before missed trials. This effect was only present ∼200 ms (at most) before the speed pulse, which argues that it was not attributable to differences in responsiveness occurring across whole trials as might be expected, for example, if there were a difference in general alertness between missed and correct trials. An upward drift in activity was particularly evident on correct trials when attention was directed away from the RF location. The origin of these drifts in neuronal activity is unknown. One possibility is that, on correct trials, attention tended to be momentarily more focused (by chance) on the critical dot patch at the time of the speed pulse.
On some trials, the monkey responded before the speed pulse occurred (a false positive), perhaps because it erroneously perceived a speed pulse. After excluding trials with breaks of fixation, false-positive responses accounted for 22% of trials in monkey M and 5% of trials in monkey B. If activity in LIP and MT is related to detection of the speed pulse, there may also be modulations in activity preceding false-positive “detections” in the absence of a speed pulse. Figure 9 shows the neural response preceding false-positive detections aligned on the time of the response (solid blue trace). For comparison, the activity before correct and missed speed pulses are also shown. Because missed trials did not have a reaction on which to align, the missed response was first aligned on the time of the speed pulse and then shifted by the monkey's mean reaction time. There is a compelling similarity between the activity preceding false-positive releases and that preceding correct speed-pulse detection. Interestingly, the activity before false-positive responses was strongly dependent on which dot patch was cued at the time of the response, exhibiting an increase in activity when the dot patch in the receptive field is cued (i.e., most likely to contain the speed pulse) and a decrease in activity when the dot patch opposite the receptive field is cued.
Figure 9.

Neural activity in LIP and MT preceding false-positive reactions. A–D, Population neural activity aligned on the time of false-positive reactions for LIP (A, B) and MT (C, D), shown separately for monkey M (A, C) and monkey B (B, D). Responses are split based on whether the dot patch in the receptive field was cued at the time of the false-positive response or not (blue or cyan, respectively). For comparison, the activity before correct reactions to validly cued speed pulses in (green) and out (light green) of the receptive field are also shown. Last, we plotted the neural activity from validly cued missed trials for speed pulses in (dashed red) and out (dashed light red) of the receptive field. Because missed trials did not have a reaction on which to align, the neural activity was aligned to the time of the speed pulse and then shifted by the monkey's mean reaction time to align with the other curves. Changes in the neural activity preceding false-positive reactions were dramatically different depending on whether the receptive field dot patch was cued at the time of the reaction. This activity, although smaller in magnitude, was generally similar to that preceding correct responses. Neural activity was normalized as for Figure 8.
Next we asked whether a simple activity threshold could explain trial-by-trial variability in reaction time. The left panels of Figure 10 are similar to Figure 8 except that the neural population-average activity from correct trials has been divided into a series of groups based on the animals' reaction times on the corresponding trials. We examined both validly cued and invalidly cued trials; we used 20 groups for validly cued trials and three groups for invalidly cued trials (because there were far fewer invalidly cued trials) but show every other bin for clarity. The distributions of reaction times are shown in the gray and black histograms beneath each set of traces in A–D (for details, see figure legend). The reaction times mostly fell within a 200 ms time window within the larger 400-ms-wide window (200–600 ms) for which correct responses were rewarded. In each of A–D, a threshold firing-rate level is indicated by the thin black horizontal line. This threshold was restricted to the gray shaded regions in Figure 8A–D, i.e., the range of possible thresholds for which the pooled average activity crossed on correct trials but did not cross on missed trials. The specific threshold was chosen from within that range as that which produced the greatest correlation between threshold-crossing time and reaction time for validly and invalidly cued speed-pulse responses (see Materials and Methods). The relationship between the time of threshold crossing and reaction time are shown to the right for this best threshold. The regression slope was significantly different from 0 for both LIP and MT in both monkeys (p < 0.001, t test for slope = 0). This was true even for the data from area MT in monkey M in which the population average response to the speed pulse was very small. In addition, with the exception of monkey M area MT, the average activity on invalidly cued trials (gray points) fell along the same regression line as for validly cued trials (black points). Thus, the observed relationship between threshold crossing and reaction time appeared fixed independent of attentional state.
We also found that other aspects of the neural response, such as peak height and peak latency, were correlated with reaction time. However, these correlations were less robust than the correlation with time of threshold crossing (r2 values; peak height: monkey M, MT, 0.50; LIP, 0.35; monkey B, MT, 0.18; LIP, 0.26; peak latency: monkey M, MT, 0.39; LIP, 0.57; monkey B, MT, 0.38; LIP, 0.41).
The threshold crossings occurred ∼250 ms before the behavioral response. However, except for monkey M's MT data (which was the noisiest of the four), the regression slopes were significantly less than 1 (p < 0.001, t test for slope = 1). Thus, the difference between neurophysiologic threshold-crossing time and behavioral reaction time cannot be explained by a fixed motor delay or additional “processing” stage unless we assume that the duration of this additional delay is variable. Specifically, the delay would need to be shorter for earlier reactions and longer for later reactions to compensate for the observed relationship between threshold crossing and reaction time. Alternatively, the regression slope for the population average activity may not reflect the underlying single neurons. For example, a previous study from our laboratory demonstrated that only a subset of LIP neurons (chosen by an independent criterion) exhibit responses highly correlated with reaction time in a task involving self-timed movements (Maimon and Assad, 2006). Perhaps our population result is the average of a subset of neurons highly correlated with reaction time (regression slopes near 1) and a population of neurons poorly correlated with reaction time. To test this possibility, we performed a similar threshold analysis for the single neurons in each population (see Materials and Methods). In contrast to Maimon and Assad, the single-neuron regression slopes were distributed broadly between 0 and 1, with no cluster evident around 1 (Fig. 10, right histograms).
Another possibility is that the underlying threshold-crossing process was correlated with reaction time with unity slope, but we were unable to sufficiently resolve it with our dataset. Previous studies testing rise-to-threshold models in MT, VIP, and LIP used the onset of preferred motion stimuli as the test stimulus, which resulted in a several-fold increase in firing rate over 400–1200 ms (Cook and Maunsell, 2002a; Maimon and Assad, 2006). In contrast, in our study, the rising phase of the speed-pulse response occurred over <150 ms and consisted of only a 30% increase in firing rate on average. Together, these two factors may have reduced our capacity to fully resolve the rising phase responses, which in our task generally consisted of at most a few spikes above baseline on any given trial.
Last, our speed-pulse stimulus was not chosen to maximize the neural response and thus was not the optimal preferred stimulus for each neuron. Previous studies have suggested that decision processes may preferentially sample from neurons that are optimally tuned to the stimulus (Celebrini and Newsome, 1994; Britten et al., 1996; Purushothaman and Bradley, 2005; Gu et al., 2007). If this were the case, we may expect that neurons with the largest speed-pulse response also exhibited neural–behavioral regression slopes closer to 1. However, there was no correlation in our dataset between the magnitude of the speed-pulse response and the single-neuron regression slope (all r2 < 0.1).
Relating neural activity to the behavioral time course
Thus far, we have proposed a simple threshold model to explain how differences in accuracy and reaction time might arise from the transient response to the speed pulse “superimposed” on the ongoing neural activity. Next we asked whether such a neural model could underlie the behavioral time course of the attentional shift illustrated in Figure 3. To explain how the cue switch could affect the animal's response to a speed pulse that occurred at the same time, or even earlier, we hypothesized that the response of the brain to the speed pulse must be buffered in some way so that it could interact with the shift of attention. In fact, although the speed pulse itself was only 50 ms in duration, the neural responses to the speed pulse in LIP and MT were much more prolonged, lasting ∼300 ms (∼100–400 ms after the speed pulse) (Figs. 7, 8). Thus, neural information about the speed pulse persisted in the brain for considerably longer than the speed pulse itself and was available in theory to interact with neuronal signals related to the shift in attention.
Of particular interest to us are those trials in which the speed pulse and cue switch occurred nearly simultaneously because these represent the dynamic period of the attentional shift. Unfortunately, those trials were rare for individual neurons because the times of the speed pulse and cue switch were both drawn at random. However, we can model how those two signals might interact. Figure 11 shows the average neural response after a cue switch and the average neural response after a speed pulse. For the model, all speed-pulse responses were averaged together regardless of when they occurred. However, we aligned the speed pulse and cue switch to facilitate comparison of the time course of the two signals. Even if the cue switch occurred simultaneously with the speed pulse, the rising phase of the speed-pulse response aligns with the crossing point of the neurophysiologic attentional shift. Thus, if the two signals interact or combine in some manner (for example, by summing), the attentional modulation is present in time (i.e., before the animal's reaction) to “push” the protracted neural response to the speed pulse above or below threshold, at least in principle.
Figure 11.

A comparison of the time course of the speed-pulse response and attentional shift after a cue switch. Average neural response after a speed pulse (gray top curves) and after a cue switch (black bottom curves) are shown for the LIP populations in monkey M (A) and monkey B (B). Neural activity was normalized as in Figure 8. y-Axis tick denotes a normalized spike rate of 1. The neural response to the speed pulse and postcue attentional shift occur on a similar timescale.
Figure 12 illustrates this hypothesis with a summation model. This model illustrates how attentional enhancement of behavior could emerge from an interaction of visual responses and ongoing attentional modulation even for speed pulses presented before the cue switch. The baseline-subtracted population-average speed-pulse response was added to the population-average peri-switch activity to mimic speed pulses occurring at either the cued or uncued location. By adding the speed-pulse response at different temporal offsets, we mimicked speed pulses occurring at varying times relative to the cue switch (all data from LIP; see Materials and Methods). Previously, we observed that the likelihood of detecting the speed pulse was correlated with the peak of the speed-pulse response and the reaction time to the speed pulse was correlated with the time that the speed-pulse response crossed a fixed firing-rate threshold. Therefore, this model predicts that the behavioral shift of attention will occur when the pulse + OUT–IN switch activity has either a higher peak (for detection performance) or an earlier threshold crossing (for reaction time) than the IN–OUT switch + pulse activity.
Figure 12.

Summation model of the interaction between the speed-pulse response and attentional shift. The interaction was modeled by adding the baseline-subtracted, validly cued, LIP speed-pulse response (correct and missed trials combined) to the peri-switch neural response from LIP. The peri-switch neural responses (dotted lines) and peri-switch responses plus speed-pulse response (solid lines) are shown. The best thresholds from Figure 10, A and B, are also shown as horizontal dotted lines. The speed-pulse response was shifted with respect to the cue switch to simulate the speed-pulse occurring at one of five times: −200, −100, 0, 100, and 200 ms. The shape of the added speed-pulses response is most clearly evident in the leftmost column (−200 ms) in which it has been added to the flat, pre-switch baseline. As the speed-pulse response occurs later, it combines with the evolving attentional modulation resulting in higher peak activity and earlier threshold crossing for the switch OUT–IN + pulse activity. For details, see Materials and Methods and Results.
The observed behavioral crossing times were reasonably consistent with the predictions of this simple summation model for both detection performance [monkey M, behavioral crossing between −66 and 0 ms, predicted between −135 and −14 ms; monkey B, behavioral crossing between −173 and −13 ms, predicted between −54 and 48 ms (behavioral data from Fig. 3)] and reaction time [monkey M, behavioral crossing between −120 and 73 ms, predicted 2 ms; monkey B, behavioral crossing between −100 and −73 ms, predicted 3 ms (behavioral data from supplemental Fig. S3, available at www.jneurosci.org as supplemental material)]. We report a range of predicted times for the detection performance because this prediction varied somewhat with how much of the speed-pulse response was used. Using more post-speed-pulse activity resulted in the speed-pulse response interacting with the shifting attentional modulation at earlier simulated speed-pulse times, resulting in an earlier peak of the switch OUT–IN + pulse activity. Therefore, we present the range of predictions determined using a speed-pulse response spanning either from the time of the speed pulse until 50 ms before the peak response or from the time of the speed pulse until 100 ms after the peak response. In contrast, the predicted reaction-time crossing point was not affected by this parameter because it was not dependent on the later aspects of the speed-pulse response and is therefore presented as a single time.
This model makes several simplifying assumptions in the interest of clarity. It assumes that the speed-pulse responses at the cued and uncued locations are equal and that they will sum linearly with the shifting baseline response without interaction or spike-rate saturation. The model also does not incorporate the differential baseline drifts evident before the speed-pulse response on correct and missed trials (Fig. 8). Lastly, we used the same neural thresholds determined in Figures 8 and 10. However, it is unlikely that the same neural decision threshold is used both during steady-state attention and during the attentional shift. After the cue switch, both monkeys exhibited an overall increase in the spike rate such that this activity alone crossed threshold without an additional speed-pulse response (Fig. 12, dashed lines in right columns). Although it is possible that the threshold could simply increase transiently after a cue switch, other aspects of the data suggest that a simple summation model cannot provide a detailed prediction of the time course of the behavioral attentional shift. For example, although both the behavioral and the neural attention shifts occurred over a period of 300–400 ms, they did not precisely mirror each other. Behaviorally, accuracy decreased at the previously cued location before it increased at the newly cued location, suggesting that attention must be withdrawn before it can be reallocated. However, the opposite appeared to be true for the neural time course. Most obviously for monkey M, in both MT and LIP, the onset of attentional modulation began earlier than the offset of attentional modulation, similar to previous observations (Motter, 1994; Khayat et al., 2006). This suggests that the performance benefits of attention do not arise solely from an interaction between attentional modulation and incoming sensory responses in local pools of neurons representing each region of space but perhaps as a more global process that includes comparisons between pools of neurons representing different parts of visual space.
Alternative explanations
It is now a longstanding observation that activity of single neurons in MT (Logothetis and Schall, 1989; Britten et al., 1992; Croner and Albright, 1999; Dodd et al., 2001; Cook and Maunsell, 2002a; Uka and DeAngelis, 2004; Liu and Newsome, 2005; Purushothaman and Bradley, 2005), LIP (Roitman and Shadlen, 2002; Williams et al., 2003), and other visual areas (Celebrini and Newsome, 1994; Leopold and Logothetis, 1996; Uka et al., 2005; Nienborg and Cumming, 2006) are correlated with behavioral reports of perception in a trial-by-trial manner. The favored interpretation in the literature is that trial-by-trial variance in the neural response reflects noise correlated across a population of neurons, and the observation that the perceptual report correlates with that noise is taken as evidence that the brain is “listening to” that population to arrive at a perceptual decision.
However, there are several aspects of our dataset that are not easily explained by that interpretation. First, there was a decrease in the neural response after speed pulses occurring outside of the receptive field, and the decrease was larger for correctly detected speed pulses than for missed speed pulses, analogous to the response to speed pulses inside the receptive field (Fig. 9). Indeed, the tDP calculated in the same manner as in Figure 8 was significantly less than 0.5 for three of the four neural populations (median tDP, signed-rank test for median tDP = 0.5: monkey M, LIP, 0.40, p < 0.001; MT, 0.42, p < 0.001; monkey B, LIP, 0.45, p < 0.001; MT, 0.48, p = 0.13). It is not clear why trial-by-trial variation in the activity of these neurons should correlate with the behavioral response to a stimulus occurring in the opposite hemifield. One possibility is that there is a mutually inhibitory relationship between the pools of neurons that respond to the two patches of motion (perhaps because we used opposite directions of motion for the two patches); if so, a larger neuronal response to the speed pulse at one location could inhibit the activity of neurons with RFs at the other location. However, a similar decrease in activity was also present before false-positive responses when the animal was cued away from the location of the receptive field (Fig. 9). Because there was no actual speed pulse on false-positive trials, the decrease in activity cannot be explained by a direct effect of the speed pulse itself. Thus, variations in the size of the neuronal response to the speed pulse may be more than sensory noise. Critically, the decrease in activity cannot be attributable to the animals' motor response, because the motor response was the same regardless of the location of the speed pulse.
Second, previous studies have shown that neurons that were more sensitive in discrimination tasks also tended to exhibit larger choice probabilities, perhaps because the brain selectively monitors the most informative neurons (Celebrini and Newsome, 1994; Britten et al., 1996; Purushothaman and Bradley, 2005; Gu et al., 2007). We also found a variety of responses to the speed pulse inside the RF, including neurons that were suppressed by the speed pulse (Fig. 7D). If a neuron signals the occurrence of the speed pulse with a suppression of its firing rate, then its firing rate should be more suppressed on those trials in which the speed pulse was detected (i.e., a tDP <0.5). This has been observed previously in speed-discrimination (Liu and Newsome, 2005) and direction-discrimination (Purushothaman and Bradley, 2005) tasks. Figure 13, A and B, plots the average magnitude of the speed-pulse response on missed trials for each neuron against the tDP for that neuron. We examine only the neuronal responses to speed pulses inside the RF, and we take the average response on missed trials as a “reference,” because it is presumably unaffected by events related to the animal's detecting the speed pulse. Cells with excitatory responses to the speed pulse had tDP >0.5, but cells with inhibitory responses also had tDP >0.5, contrary to our expectation. That is, regardless of the sign of the response of a neuron to the speed pulse, its firing rate on correct trials tended to be elevated. There was no significant relationship between the average size of the speed-pulse response on missed trials and the tDP.
Figure 13.

Correlations between the speed-pulse response, threshold detect probability, and magnitude of attentional modulation. Data are shown separately for area LIP (A, C, E) and area MT (B, D, F) from monkey M (blue) and monkey B (red). A, B, Neural response on missed trials after a speed pulse versus threshold detect probability from Figure 8. Speed-pulse response was the average neural activity 100–300 ms after the pulse minus a prepulse baseline taken from −200 to 0 ms. C, D, As in A and D but using the speed-pulse response on correct trials versus the threshold detect probability. E, F, Attentional index versus threshold detect probability. Inset values show the correlation coefficient (r) and p value (F test for slope = 0).
Figure 13, C and D shows the same analysis for correct trials. Here a significant positive correlation emerges between the average magnitude of the speed-pulse response and the tDP, for both LIP and MT and for both animals. Thus, on correct trials, but not missed trials, there appeared to be an additional source of modulation that is responsible for the correlation between the speed-pulse response and tDP. One caveat is that, in a given session, there tended to be fewer missed trials than correct trials (i.e., accuracy was >50%), which might render the correlation more difficult to detect for missed trials. To address this concern, we randomly resampled a number of correct trials from each neuron equal to that of the number of missed trials of that neuron and recalculated the correlation in Figure 13, C and D. We repeated this resampling 10,000 times and assessed the percentage of iterations resulting in a significant correlation (percentage with p < 0.05, F test for null hypothesis that slope = 0). For monkey B, >99.9% of resampled iterations still yielded significant correlations, for both MT and LIP. Monkey M had fewer missed trials than monkey B, but nonetheless 91% of resampled iterations still yielded significant correlations for LIP. However, for monkey M's MT data, which exhibited only a marginally significant correlation for correct trials (p = 0.03), none of the resampled iterations yielded significant correlations. Thus, at least for monkey B, it does not appear that the lack of detectable correlation between the speed-pulse response on missed trials and tDP was attributable to the smaller number of missed trials per se.
What is the source of the additional modulation on correct trials that leads to the correlation between the size of the speed-pulse response and the tDP? One source of this modulation on correct trials could be spatial attention. For example, perception of the speed pulse may trigger the monkey to focus extra attention at the perceived location as the animal is preparing to respond. In theory, this could account for not only the tDP for speed pulses inside the receptive field but also the tDP for speed pulses outside of the receptive field (which were <0.5), because increased attention away from the RF could reduce the neuronal response. Moreover, attention might also explain why neural activity on false-positive trials increased when the RF location was cued and decreased when the opposite location was cued. Consistent with this interpretation, there was a positive correlation between the magnitude of the attentional modulation and tDP (Fig. 13E,F), although it failed to reach significance for MT in monkey B, which had a limited range of attentional modulation. Additionally, cells with attentional indices <0 tended to have values of tDP <0.5. Nine LIP neurons had attentional indices significantly <0 (permutation test; see Materials and Methods), indicating that they responded less when attention was directed to their receptive fields. Strikingly, six of nine of these neurons also had tDP values <0.5, accounting for the points in the bottom left quadrant of Figure 13E. In MT, half of the neurons with attentional indices <0 had tDP <0.5. That is, if attention decreased neural responses in general, the neural response to the speed pulse on correct trials was also decreased.
These observations suggest that at least part of the correlation between neural responses and behavior may be attributable to “top-down” effects. Of course, sensory noise and top-down effects could both contribute to the correlation, and we do not suggest that one or the other is the sole source of the observed correlation. For example, in monkey B, the tDP was larger for test stimuli inside than for stimuli outside the receptive field. In contrast, for monkey M, the magnitude of the tDP was approximately equivalent—although opposite in sign—for test stimuli inside or outside of the receptive field. This may indicate that a greater fraction of the tDP for monkey M is accounted for by a shift of spatial attention or other top-down input (see Discussion).
Discussion
We trained monkeys on an attention-switch task designed to simultaneously measure the time course of attentional shifts in behavior and neural responses. Neurophysiologically, we observed that the shift of attention in MT and LIP occurred ∼200 ms after the cue switch, consistent with previous studies describing the time course of shifting attention in V1 (Khayat et al., 2006), V4 (Motter, 1994), and LIP (Bracewell et al., 1996). Studies using attentional modulation of visual evoked potentials in human subjects have typically shown later onsets of modulation, on the order of 400–800 ms after the attentional cue (Müller et al., 1998; Grent-'t-Jong and Woldorff, 2007), which may reflect the need for attentional modulation to be well established before it is manifest as broadly synchronous activity detectable by scalp potentials.
Behaviorally, we were surprised to see that the shift of attention was evident for test stimuli presented simultaneously with, or even slightly before, the cue switch. Peripheral cues, in which there is an abrupt change at the location to be attended, are known to produce rapid, exogenous shifts of attention that peak for targets within 100–200 ms of the cue for both human and monkey subjects (Kröse and Julesz, 1989; Müller and Rabbitt, 1989; Nakayama and Mackeben, 1989; Cheal and Lyon, 1991; Mackeben and Nakayama, 1993; Bisley and Goldberg, 2003). In these experiments, attentional benefits can be present for target stimuli presented coincident with the cue itself, similar to our results (Nakayama and Mackeben, 1989). In contrast, endogenous attentional shifts in response to central cues such as those used in our study are typically slower, peaking for targets occurring ∼400 ms after cue presentation (Müller and Rabbitt, 1989; Cheal and Lyon, 1991; Müller et al., 1998). The time course is presumably slower because more abstract cues must be processed, and the cued location interpreted, before attention can be shifted. However, a number of studies have demonstrated effects of central cues for test stimuli within 100 ms of the cue (Müller and Rabbitt, 1989; Van der Heijden et al., 1992; Shiu and Pashler, 1994), and at least one study has shown an effect when the cue and test stimuli were presented simultaneously (Grindley and Townsend, 1968).
In our experiment, we had the two random-dot stimuli move in opposite directions. We did this so that the effects of feature-based attention and spatial attention would be aligned, thus maximizing attentional modulation. Consequently, we cannot distinguish between the effects of feature-based attention and spatial attention, although we expect that both are present in our data. In MT, the effects of spatial and feature-based attention are additive (Treue and Martínez Trujillo, 1999). Furthermore, there are other cognitive signals that may influence LIP activity, including saccade planning (Snyder et al., 1997) and reward-related signals (Platt and Glimcher, 1999; Dorris and Glimcher, 2004; Sugrue et al., 2004). It is possible that some of these signals contributed to what we call “attentional” modulation, although it is not straightforward to dissociate these signals from attention (Maunsell, 2004). Regardless, the goal of our experiment was to examine the relationship between these modulations (whatever name we assign to them) and behavior in an attentional framework.
A key question is how the cue was able to affect the behavioral performance so apparently quickly. We suggest that the visual response to the speed pulse may serve as a sensory “buffer” that could interact with the shifting attentional modulation after a simultaneously presented cue switch. This may be related to the phenomenon of iconic memory in which detailed sensory information about transiently presented stimuli can be recalled if cued within ∼400 ms of the stimulus offset (Sperling, 1960; Neisser, 1967; Coltheart, 1980; Gegenfurtner and Sperling, 1993). This interaction seems plausible in our dataset given the relative timing of these two processes (Fig. 11). Indeed, our use of low-luminance dots and near-threshold speed changes for the test stimuli resulted in particularly long-latency visual responses that may have facilitated the interaction with the cued attentional shift.
If the effect of attention arises as an interaction between the visual response to the test stimulus and the ongoing modulation of these responses by attention, a critical question is how these two signals interact. A number of researchers have used neural threshold models (Carpenter and Williams, 1995; Reddi and Carpenter, 2000) to explain performance and reaction time based on activity in MT (Cook and Maunsell, 2002a), VIP (Cook and Maunsell, 2002a), LIP (Roitman and Shadlen, 2002; Ipata et al., 2006; Maimon and Assad, 2006; Churchland et al., 2008), and frontal eye fields (Hanes and Schall, 1996). These models share the premise that the spike rate across populations of neurons could be used as a decision variable weighing the available evidence in a perceptual task. The decision to respond is said to occur when the neural spike rate reaches a particular threshold. In theory, the effect of attention on neural responses fits conveniently into this framework. By enhancing visual responses to stimuli (for review, see Treue, 2001), attention effectively moves the driven firing rate closer to threshold such that the response to the speed pulse reaches threshold more frequently and more quickly when it occurs at the attended location versus unattended location.
We showed that a simple threshold model could reasonably account for both accuracy and reaction time in our experiment. However, in three of the four neural populations we studied, the slope of the regression between the neural threshold crossing and the monkey's reaction time was significantly less than 1. Importantly, this means that the difference between the threshold crossing time and reaction time cannot be explained by a fixed motor delay as has been proposed previously (Cook and Maunsell, 2002a; Maimon and Assad, 2006) and argues against the hypothesis that the threshold crossing represents the “final” mechanism underlying the decision to respond in our experiment. One possibility is that the underlying physiology does reach a slope of 1 but that the responses were too small and too short to be fully resolved in our dataset. Alternatively, it is possible that the decision threshold process relies preferentially on neurons that are optimally tuned to the stimulus as has been seen previously in studies of choice probability (Celebrini and Newsome, 1994; Britten et al., 1996; Purushothaman and Bradley, 2005; Gu et al., 2007). Because the speed pulse was not chosen to be the optimal preferred stimulus for each neuron, the rise-to-threshold process may not be fully revealed in our neural population.
The observed correlation between neural activity and behavior (accuracy and reaction time) required that, on average, there was some additional neural activity when the animal detected the test stimulus than when the animal failed to detect the test stimulus. Indeed, additional neural activity was also apparent before false-positive responses, in which there was no test stimulus at all. A similar relationship between neural activity and perceptual report on single trials has been observed broadly throughout visual cortex (Celebrini and Newsome, 1994; Britten et al., 1996; Leopold and Logothetis, 1996; Shadlen and Newsome, 1996; Dodd et al., 2001; Cook and Maunsell, 2002a; Williams et al., 2003; Uka and DeAngelis, 2004; Liu and Newsome, 2005), somatosensory cortex (de Lafuente and Romo, 2006), and even the sensory periphery (Vallbo and Johansson, 1976). These correlations have traditionally been expressed using choice or detect probability metrics similar to the tDP metric used here. The dominant interpretation of this finding has been that trial-by-trial variability in the neural activity is attributable to noise in the sensory system, and the correlation with behavior is therefore evidence that these neurons are “read out” by the brain to arrive at a perceptual decision. Alternatively, these effects may reflect a top-down signal related to the animal's perception or report (Uka et al., 2005; Nienborg and Cumming, 2009).
One potential source of such a top-down signal in our task is spatial attention. For example, when the monkey detects the transient speed pulse, it may shift attention to the location of the pulse as it prepares to respond. Our valid–invalid cuing paradigm encouraged a degree of attentional splitting that may have facilitated additional attentional shifts at the time of test stimulus detection. Several aspects of our dataset favor this interpretation. First, the neural response on correct trials tended to be larger than on missed trials (tDP >0.5) regardless of whether the neuron was excited or inhibited by the test stimulus, in contrast to previous results in which the effect depended on the sign of the underlying response (Liu and Newsome, 2005; Purushothaman and Bradley, 2005). Second, the magnitude of the tDP was positively correlated with the magnitude of attentional modulation for individual neurons. Third, on trials in which the test stimulus occurred outside of the receptive field, the tDP was similar in magnitude to that observed when the stimulus occurred inside the receptive field but opposite in sign (tDP <0.5). Last, the neural activity before false-positive responses (when no test stimulus actually occurred) exhibited an increase in activity when the test stimulus was likely to occur inside the receptive field and a decrease in activity when it was likely to occur outside of the receptive field. Together, these data are most consistent with attention shifting toward the location of the real or falsely detected speed pulse, thus producing opposite effects depending on whether the shift is toward or away from the receptive field location.
It is also possible that attention or some other top-down signal also contributed to choice or detect probability measurements in previous studies. For example, in tasks requiring a detection at a single location, attention may be brought more strongly to bear on that location as the detection event unfolds. Moreover, several studies have shown that attention can be temporally modulated if the timing of the detected event has a predictable structure (Ghose and Maunsell, 2002; Janssen and Shadlen, 2005). However, another study using a detection task similar to ours found similar detect probabilities when using either one or two stimulus locations, suggesting that shifts of spatial attention among stimuli were not a significant contributor to detect probability (Cook and Maunsell, 2002a). Spatial attention would also presumably have less effect on choice probability in discrimination studies, because spatial attention should boost neural responses to all discriminated stimuli. However, all these measurements could still be affected by nonspatial influences such as feature-based attention (Treue and Martínez Trujillo, 1999; McAdams and Maunsell, 2000). Feature-based attentional modulation predicts that detect or choice probabilities will be larger when the stimulus matches the preferred feature of the neuron, a result frequently cited as evidence that sensory noise in task-relevant pools of neurons influences perception (Celebrini and Newsome, 1994; Britten et al., 1996; Purushothaman and Bradley, 2005).
Several studies have argued that choice probability is unlikely to be secondary to attention because the choice probability did not rise throughout the stimulus presentation as the decision is (presumably) made (but see Dodd et al., 2001; Shadlen and Newsome, 2001). However, it is generally not possible to ascertain when the animal makes his decision; in a reaction-time task in which the animal could report his decision at will, detect probability values in MT and VIP increased in the run-up to the animal's response (Cook and Maunsell, 2002a). Furthermore, recent evidence suggests that monkeys may base their perceptual decisions preferentially on the first few hundred milliseconds of a long stimulus presentation (Kiani et al., 2008), inconsistent with the purely bottom-up explanation of the time course of choice probability (Nienborg and Cumming, 2009).
In any event, the presence or even the predominance of top-down modulation to explain the correlation between neural responses and behavior does not necessarily undermine the utility of a spike-rate threshold model. Rather, it seems likely that perception of a stimulus based on its sensory response would in turn trigger shifts of attention and other cognitive processes that would influence the neural response. In the presence of these modulations, it is perhaps impossible to assign neural activity to a purely sensory or postsensory (e.g., decision) process. Ultimately, models that combine incoming sensory information with evolving prediction signals may be a more fruitful way to conceive of neural activity, even in early visual cortex (Rao and Ballard, 1999; Yang and Purves, 2003).
Footnotes
This work was supported by National Eye Institute Grant EY-12106 (J.A.A.) and Vision Core Grant EY-12196 and Medical Scientist Training Program Grant T32 GMO7753-26 (T.M.H.). We thank Kimberly Irwin, Tim LaFratta, John LeBlanc, and David Averbuch for technical assistance.
References
- Barash S, Bracewell RM, Fogassi L, Gnadt JW, Andersen RA. Saccade-related activity in the lateral intraparietal area. II. Spatial properties. J Neurophysiol. 1991;66:1109–1124. doi: 10.1152/jn.1991.66.3.1109. [DOI] [PubMed] [Google Scholar]
- Bisley JW, Goldberg ME. Neuronal activity in the lateral intraparietal area and spatial attention. Science. 2003;299:81–86. doi: 10.1126/science.1077395. [DOI] [PubMed] [Google Scholar]
- Bisley JW, Goldberg ME. Neural correlates of attention and distractibility in the lateral intraparietal area. J Neurophysiol. 2006;95:1696–1717. doi: 10.1152/jn.00848.2005. [DOI] [PMC free article] [PubMed] [Google Scholar]
- Bracewell RM, Mazzoni P, Barash S, Andersen RA. Motor intention activity in the macaque's lateral intraparietal area. II. Changes of motor plan. J Neurophysiol. 1996;76:1457–1464. doi: 10.1152/jn.1996.76.3.1457. [DOI] [PubMed] [Google Scholar]
- Britten KH, Shadlen MN, Newsome WT, Movshon JA. The analysis of visual motion: a comparison of neuronal and psychophysical performance. J Neurosci. 1992;12:4745–4765. doi: 10.1523/JNEUROSCI.12-12-04745.1992. [DOI] [PMC free article] [PubMed] [Google Scholar]
- Britten KH, Newsome WT, Shadlen MN, Celebrini S, Movshon JA. A relationship between behavioral choice and the visual responses of neurons in macaque MT. Vis Neurosci. 1996;13:87–100. doi: 10.1017/s095252380000715x. [DOI] [PubMed] [Google Scholar]
- Burr DC, Morrone MC, Ross J. Selective suppression of the magnocellular visual pathway during saccadic eye movements. Nature. 1994;371:511–513. doi: 10.1038/371511a0. [DOI] [PubMed] [Google Scholar]
- Carpenter RH, Williams ML. Neural computation of log likelihood in control of saccadic eye movements. Nature. 1995;377:59–62. doi: 10.1038/377059a0. [DOI] [PubMed] [Google Scholar]
- Carrasco M, Penpeci-Talgar C, Eckstein M. Spatial covert attention increases contrast sensitivity across the CSF: support for signal enhancement. Vision Res. 2000;40:1203–1215. doi: 10.1016/s0042-6989(00)00024-9. [DOI] [PMC free article] [PubMed] [Google Scholar]
- Celebrini S, Newsome WT. Neuronal and psychophysical sensitivity to motion signals in extrastriate area MST of the macaque monkey. J Neurosci. 1994;14:4109–4124. doi: 10.1523/JNEUROSCI.14-07-04109.1994. [DOI] [PMC free article] [PubMed] [Google Scholar]
- Cheal M, Lyon DR. Central and peripheral precuing of forced-choice discrimination. Q J Exp Psychol A. 1991;43:859–880. doi: 10.1080/14640749108400960. [DOI] [PubMed] [Google Scholar]
- Cheng K, Hasegawa T, Saleem KS, Tanaka K. Comparison of neuronal selectivity for stimulus speed, length, and contrast in the prestriate visual cortical areas V4 and MT of the macaque monkey. J Neurophysiol. 1994;71:2269–2280. doi: 10.1152/jn.1994.71.6.2269. [DOI] [PubMed] [Google Scholar]
- Churchland AK, Kiani R, Shadlen MN. Decision-making with multiple alternatives. Nat Neurosci. 2008;11:693–702. doi: 10.1038/nn.2123. [DOI] [PMC free article] [PubMed] [Google Scholar]
- Ciaramitaro VM, Cameron EL, Glimcher PW. Stimulus probability directs spatial attention: an enhancement of sensitivity in humans and monkeys. Vision Res. 2001;41:57–75. doi: 10.1016/s0042-6989(00)00203-0. [DOI] [PubMed] [Google Scholar]
- Colby CL, Duhamel JR, Goldberg ME. Ventral intraparietal area of the macaque: anatomic location and visual response properties. J Neurophysiol. 1993;69:902–914. doi: 10.1152/jn.1993.69.3.902. [DOI] [PubMed] [Google Scholar]
- Coltheart M. Iconic memory and visible persistence. Percept Psychophys. 1980;27:183–228. doi: 10.3758/bf03204258. [DOI] [PubMed] [Google Scholar]
- Cook EP, Maunsell JH. Dynamics of neuronal responses in macaque MT and VIP during motion detection. Nat Neurosci. 2002a;5:985–994. doi: 10.1038/nn924. [DOI] [PubMed] [Google Scholar]
- Cook EP, Maunsell JH. Attentional modulation of behavioral performance and neuronal responses in middle temporal and ventral intraparietal areas of macaque monkey. J Neurosci. 2002b;22:1994–2004. doi: 10.1523/JNEUROSCI.22-05-01994.2002. [DOI] [PMC free article] [PubMed] [Google Scholar]
- Croner LJ, Albright TD. Segmentation by color influences responses of motion-sensitive neurons in the cortical middle temporal visual area. J Neurosci. 1999;19:3935–3951. doi: 10.1523/JNEUROSCI.19-10-03935.1999. [DOI] [PMC free article] [PubMed] [Google Scholar]
- de Lafuente V, Romo R. Neuronal correlates of subjective sensory experience. Nat Neurosci. 2005;8:1698–1703. doi: 10.1038/nn1587. [DOI] [PubMed] [Google Scholar]
- de Lafuente V, Romo R. Neural correlate of subjective sensory experience gradually builds up across cortical areas. Proc Natl Acad Sci U S A. 2006;103:14266–14271. doi: 10.1073/pnas.0605826103. [DOI] [PMC free article] [PubMed] [Google Scholar]
- Dodd JV, Krug K, Cumming BG, Parker AJ. Perceptually bistable three-dimensional figures evoke high choice probabilities in cortical area MT. J Neurosci. 2001;21:4809–4821. doi: 10.1523/JNEUROSCI.21-13-04809.2001. [DOI] [PMC free article] [PubMed] [Google Scholar]
- Dorris MC, Glimcher PW. Activity in posterior parietal cortex is correlated with the relative subjective desirability of action. Neuron. 2004;44:365–378. doi: 10.1016/j.neuron.2004.09.009. [DOI] [PubMed] [Google Scholar]
- Egeth HE, Yantis S. Visual attention: control, representation, and time course. Annu Rev Psychol. 1997;48:269–297. doi: 10.1146/annurev.psych.48.1.269. [DOI] [PubMed] [Google Scholar]
- Fanini A, Assad JA. Direction selectivity of neurons in the macaque lateral intraparietal area. J Neurophysiol. 2009;101:289–305. doi: 10.1152/jn.00400.2007. [DOI] [PMC free article] [PubMed] [Google Scholar]
- Gegenfurtner KR, Sperling G. Information transfer in iconic memory experiments. J Exp Psychol Hum Percept Perform. 1993;19:845–866. doi: 10.1037//0096-1523.19.4.845. [DOI] [PubMed] [Google Scholar]
- Ghose GM, Maunsell JH. Attentional modulation in visual cortex depends on task timing. Nature. 2002;419:616–620. doi: 10.1038/nature01057. [DOI] [PubMed] [Google Scholar]
- Goldberg ME, Wurtz RH. Activity of superior colliculus in behaving monkey. II. Effect of attention on neuronal responses. J Neurophysiol. 1972;35:560–574. doi: 10.1152/jn.1972.35.4.560. [DOI] [PubMed] [Google Scholar]
- Grent-'t-Jong T, Woldorff MG. Timing and sequence of brain activity in top-down control of visual-spatial attention. PLoS Biol. 2007;5:e12. doi: 10.1371/journal.pbio.0050012. [DOI] [PMC free article] [PubMed] [Google Scholar]
- Grindley GC, Townsend V. Voluntary attention in peripheral vision and its effects on acuity and differential thresholds. Q J Exp Psychol. 1968;20:11–19. doi: 10.1080/14640746808400123. [DOI] [PubMed] [Google Scholar]
- Grunewald A, Bradley DC, Andersen RA. Neural correlates of structure-from-motion perception in macaque V1 and MT. J Neurosci. 2002;22:6195–6207. doi: 10.1523/JNEUROSCI.22-14-06195.2002. [DOI] [PMC free article] [PubMed] [Google Scholar]
- Gu Y, DeAngelis GC, Angelaki DE. A functional link between area MSTd and heading perception based on vestibular signals. Nat Neurosci. 2007;10:1038–1047. doi: 10.1038/nn1935. [DOI] [PMC free article] [PubMed] [Google Scholar]
- Hanes DP, Schall JD. Neural control of voluntary movement initiation. Science. 1996;274:427–430. doi: 10.1126/science.274.5286.427. [DOI] [PubMed] [Google Scholar]
- Herrington TM, Masse NY, Hachmeh KJ, Smith JE, Assad JA, Cook EP. The effect of microsaccades on the correlation between neural activity and behavior in areas MT, VIP and LIP. J Neurosci. 2009;29:5793–5805. doi: 10.1523/JNEUROSCI.4412-08.2009. [DOI] [PMC free article] [PubMed] [Google Scholar]
- Ipata AE, Gee AL, Goldberg ME, Bisley JW. Activity in the lateral intraparietal area predicts the goal and latency of saccades in a free-viewing visual search task. J Neurosci. 2006;26:3656–3661. doi: 10.1523/JNEUROSCI.5074-05.2006. [DOI] [PMC free article] [PubMed] [Google Scholar]
- Janssen P, Shadlen MN. A representation of the hazard rate of elapsed time in macaque area LIP. Nat Neurosci. 2005;8:234–241. doi: 10.1038/nn1386. [DOI] [PubMed] [Google Scholar]
- Khayat PS, Spekreijse H, Roelfsema PR. Attention lights up new object representations before the old ones fade away. J Neurosci. 2006;26:138–142. doi: 10.1523/JNEUROSCI.2784-05.2006. [DOI] [PMC free article] [PubMed] [Google Scholar]
- Kiani R, Hanks TD, Shadlen MN. Bounded integration in parietal cortex underlies decisions even when viewing duration is dictated by the environment. J Neurosci. 2008;28:3017–3029. doi: 10.1523/JNEUROSCI.4761-07.2008. [DOI] [PMC free article] [PubMed] [Google Scholar]
- Kröse BJ, Julesz B. The control and speed of shifts of attention. Vision Res. 1989;29:1607–1619. doi: 10.1016/0042-6989(89)90142-9. [DOI] [PubMed] [Google Scholar]
- Lagae L, Raiguel S, Orban GA. Speed and direction selectivity of macaque middle temporal neurons. J Neurophysiol. 1993;69:19–39. doi: 10.1152/jn.1993.69.1.19. [DOI] [PubMed] [Google Scholar]
- Lambert A, Wells I, Kean M. Do isoluminant color changes capture attention? Percept Psychophys. 2003;65:495–507. doi: 10.3758/bf03194578. [DOI] [PubMed] [Google Scholar]
- Leopold DA, Logothetis NK. Activity changes in early visual cortex reflect monkeys' percepts during binocular rivalry. Nature. 1996;379:549–553. doi: 10.1038/379549a0. [DOI] [PubMed] [Google Scholar]
- Liu J, Newsome WT. Functional organization of speed tuned neurons in visual area MT. J Neurophysiol. 2003;89:246–256. doi: 10.1152/jn.00097.2002. [DOI] [PubMed] [Google Scholar]
- Liu J, Newsome WT. Correlation between speed perception and neural activity in the middle temporal visual area. J Neurosci. 2005;25:711–722. doi: 10.1523/JNEUROSCI.4034-04.2005. [DOI] [PMC free article] [PubMed] [Google Scholar]
- Logothetis NK, Schall JD. Neuronal correlates of subjective visual perception. Science. 1989;245:761–763. doi: 10.1126/science.2772635. [DOI] [PubMed] [Google Scholar]
- Luce RD. Response times: their role in inferring elementary mental organization. Oxford: Oxford UP; 1986. [Google Scholar]
- Luck SJ, Hillyard SA, Mouloua M, Hawkins HL. Mechanisms of visual-spatial attention: resource allocation or uncertainty reduction? J Exp Psychol. 1996;22:725–737. doi: 10.1037//0096-1523.22.3.725. [DOI] [PubMed] [Google Scholar]
- Mackeben M, Nakayama K. Express attentional shifts. Vision Res. 1993;33:85–90. doi: 10.1016/0042-6989(93)90061-z. [DOI] [PubMed] [Google Scholar]
- Maimon G, Assad JA. A cognitive signal for the proactive timing of action in macaque LIP. Nat Neurosci. 2006;9:948–955. doi: 10.1038/nn1716. [DOI] [PubMed] [Google Scholar]
- Martínez-Trujillo J, Treue S. Attentional modulation strength in cortical area MT depends on stimulus contrast. Neuron. 2002;35:365–370. doi: 10.1016/s0896-6273(02)00778-x. [DOI] [PubMed] [Google Scholar]
- Maunsell JH. Neuronal representations of cognitive state: reward or attention? Trends Cogn Sci. 2004;8:261–265. doi: 10.1016/j.tics.2004.04.003. [DOI] [PubMed] [Google Scholar]
- Maunsell JH, Van Essen DC. Functional properties of neurons in middle temporal visual area of the macaque monkey. I. Selectivity for stimulus direction, speed, and orientation. J Neurophysiol. 1983;49:1127–1147. doi: 10.1152/jn.1983.49.5.1127. [DOI] [PubMed] [Google Scholar]
- Maunsell JH, Van Essen DC. Topographic organization of the middle temporal visual area in the macaque monkey: representational biases and the relationship to callosal connections and myeloarchitectonic boundaries. J Comp Neurol. 1987;266:535–555. doi: 10.1002/cne.902660407. [DOI] [PubMed] [Google Scholar]
- McAdams CJ, Maunsell JH. Attention to both space and feature modulates neuronal responses in macaque area V4. J Neurophysiol. 2000;83:1751–1755. doi: 10.1152/jn.2000.83.3.1751. [DOI] [PubMed] [Google Scholar]
- McAlonan K, Cavanaugh J, Wurtz RH. Guarding the gateway to cortex with attention in visual thalamus. Nature. 2008;456:391–394. doi: 10.1038/nature07382. [DOI] [PMC free article] [PubMed] [Google Scholar]
- Moran J, Desimone R. Selective attention gates visual processing in the extrastriate cortex. Science. 1985;229:782–784. doi: 10.1126/science.4023713. [DOI] [PubMed] [Google Scholar]
- Motter BC. Neural correlates of feature selective memory and pop-out in extrastriate area V4. J Neurosci. 1994;14:2190–2199. doi: 10.1523/JNEUROSCI.14-04-02190.1994. [DOI] [PMC free article] [PubMed] [Google Scholar]
- Müller HJ, Rabbitt PM. Reflexive and voluntary orienting of visual attention: time course of activation and resistance to interruption. J Exp Psychol Hum Percept Perform. 1989;15:315–330. doi: 10.1037//0096-1523.15.2.315. [DOI] [PubMed] [Google Scholar]
- Müller MM, Teder-Sälejärvi W, Hillyard SA. The time course of cortical facilitation during cued shifts of spatial attention. Nat Neurosci. 1998;1:631–634. doi: 10.1038/2865. [DOI] [PubMed] [Google Scholar]
- Nakayama K, Mackeben M. Sustained and transient components of focal visual attention. Vision Res. 1989;29:1631–1647. doi: 10.1016/0042-6989(89)90144-2. [DOI] [PubMed] [Google Scholar]
- Neisser U. Cognitive psychology. Englewood Cliffs, NJ: Prentice Hall; 1967. [Google Scholar]
- Nienborg H, Cumming BG. Macaque V2 neurons, but not V1 neurons, show choice-related activity. J Neurosci. 2006;26:9567–9578. doi: 10.1523/JNEUROSCI.2256-06.2006. [DOI] [PMC free article] [PubMed] [Google Scholar]
- Nienborg H, Cumming BG. Decision-related activity in sensory neurons reflects more than a neuron's causal effect. Nature. 2009;459:89–92. doi: 10.1038/nature07821. [DOI] [PMC free article] [PubMed] [Google Scholar]
- Pashler H. The psychology of attention. Ed 1 (paperback) Cambridge, MA: MIT; 1999. [Google Scholar]
- Petersen SE, Robinson DL, Keys W. Pulvinar nuclei of the behaving rhesus monkey: visual responses and their modulation. J Neurophysiol. 1985;54:867–886. doi: 10.1152/jn.1985.54.4.867. [DOI] [PubMed] [Google Scholar]
- Platt ML, Glimcher PW. Neural correlates of decision variables in parietal cortex. Nature. 1999;400:233–238. doi: 10.1038/22268. [DOI] [PubMed] [Google Scholar]
- Posner MI. Orienting of attention. Q J Exp Psychol. 1980;32:3–25. doi: 10.1080/00335558008248231. [DOI] [PubMed] [Google Scholar]
- Purushothaman G, Bradley DC. Neural population code for fine perceptual decisions in area MT. Nat Neurosci. 2005;8:99–106. doi: 10.1038/nn1373. [DOI] [PubMed] [Google Scholar]
- Rao RP, Ballard DH. Predictive coding in the visual cortex: a functional interpretation of some extra-classical receptive-field effects. Nat Neurosci. 1999;2:79–87. doi: 10.1038/4580. [DOI] [PubMed] [Google Scholar]
- Reddi BA, Carpenter RH. The influence of urgency on decision time. Nat Neurosci. 2000;3:827–830. doi: 10.1038/77739. [DOI] [PubMed] [Google Scholar]
- Reynolds JH, Desimone R. Interacting roles of attention and visual salience in V4. Neuron. 2003;37:853–863. doi: 10.1016/s0896-6273(03)00097-7. [DOI] [PubMed] [Google Scholar]
- Reynolds JH, Pasternak T, Desimone R. Attention increases sensitivity of V4 neurons. Neuron. 2000;26:703–714. doi: 10.1016/s0896-6273(00)81206-4. [DOI] [PubMed] [Google Scholar]
- Robinson DL, Kertzman C. Covert orienting of attention in macaques. III. Contributions of the superior colliculus. J Neurophysiol. 1995;74:713–721. doi: 10.1152/jn.1995.74.2.713. [DOI] [PubMed] [Google Scholar]
- Roitman JD, Shadlen MN. Response of neurons in the lateral intraparietal area during a combined visual discrimination reaction time task. J Neurosci. 2002;22:9475–9489. doi: 10.1523/JNEUROSCI.22-21-09475.2002. [DOI] [PMC free article] [PubMed] [Google Scholar]
- Shadlen MN, Newsome WT. Motion perception: seeing and deciding. Proc Natl Acad Sci U S A. 1996;93:628–633. doi: 10.1073/pnas.93.2.628. [DOI] [PMC free article] [PubMed] [Google Scholar]
- Shadlen MN, Newsome WT. Neural basis of a perceptual decision in the parietal cortex (area LIP) of the rhesus monkey. J Neurophysiol. 2001;86:1916–1936. doi: 10.1152/jn.2001.86.4.1916. [DOI] [PubMed] [Google Scholar]
- Shiu LP, Pashler H. Negligible effect of spatial precuing on identification of single digits. J Exp Psychol. 1994;20:1037–1054. [Google Scholar]
- Snyder LH, Batista AP, Andersen RA. Coding of intention in the posterior parietal cortex. Nature. 1997;386:167–170. doi: 10.1038/386167a0. [DOI] [PubMed] [Google Scholar]
- Sperling G. The information available in brief visual presentations. Psychol Monogr Gen Appl. 1960;74:1–29. [Google Scholar]
- Sugrue LP, Corrado GS, Newsome WT. Matching behavior and the representation of value in the parietal cortex. Science. 2004;304:1782–1787. doi: 10.1126/science.1094765. [DOI] [PubMed] [Google Scholar]
- Treue S. Neural correlates of attention in primate visual cortex. Trends Neurosci. 2001;24:295–300. doi: 10.1016/s0166-2236(00)01814-2. [DOI] [PubMed] [Google Scholar]
- Treue S, Martínez Trujillo JC. Feature-based attention influences motion processing gain in macaque visual cortex. Nature. 1999;399:575–579. doi: 10.1038/21176. [DOI] [PubMed] [Google Scholar]
- Treue S, Maunsell JH. Attentional modulation of visual motion processing in cortical areas MT and MST. Nature. 1996;382:539–541. doi: 10.1038/382539a0. [DOI] [PubMed] [Google Scholar]
- Uka T, DeAngelis GC. Contribution of area MT to stereoscopic depth perception: choice-related response modulations reflect task strategy. Neuron. 2004;42:297–310. doi: 10.1016/s0896-6273(04)00186-2. [DOI] [PubMed] [Google Scholar]
- Uka T, Tanabe S, Watanabe M, Fujita I. Neural correlates of fine depth discrimination in monkey inferior temporal cortex. J Neurosci. 2005;25:10796–10802. doi: 10.1523/JNEUROSCI.1637-05.2005. [DOI] [PMC free article] [PubMed] [Google Scholar]
- Vallbo ÅB, Johansson RS. Skin mechanoreceptors in the human hand: neural and psychophysical thresholds. In: Zotterman Y, editor. Sensory functions of the skin in primates. Oxford: Pergamon; 1976. pp. 185–199. [Google Scholar]
- Van der Heijden AHC, Brouwer RFT, Serlie AW. Single-letter recognition accuracy and position information: benefits with a symbolic cue. Psychol Rev. 1992;54:182–186. [Google Scholar]
- Williams ZM, Elfar JC, Eskandar EN, Toth LJ, Assad JA. Parietal activity and the perceived direction of ambiguous apparent motion. Nat Neurosci. 2003;6:616–623. doi: 10.1038/nn1055. [DOI] [PubMed] [Google Scholar]
- Yang Z, Purves D. A statistical explanation of visual space. Nat Neurosci. 2003;6:632–640. doi: 10.1038/nn1059. [DOI] [PubMed] [Google Scholar]