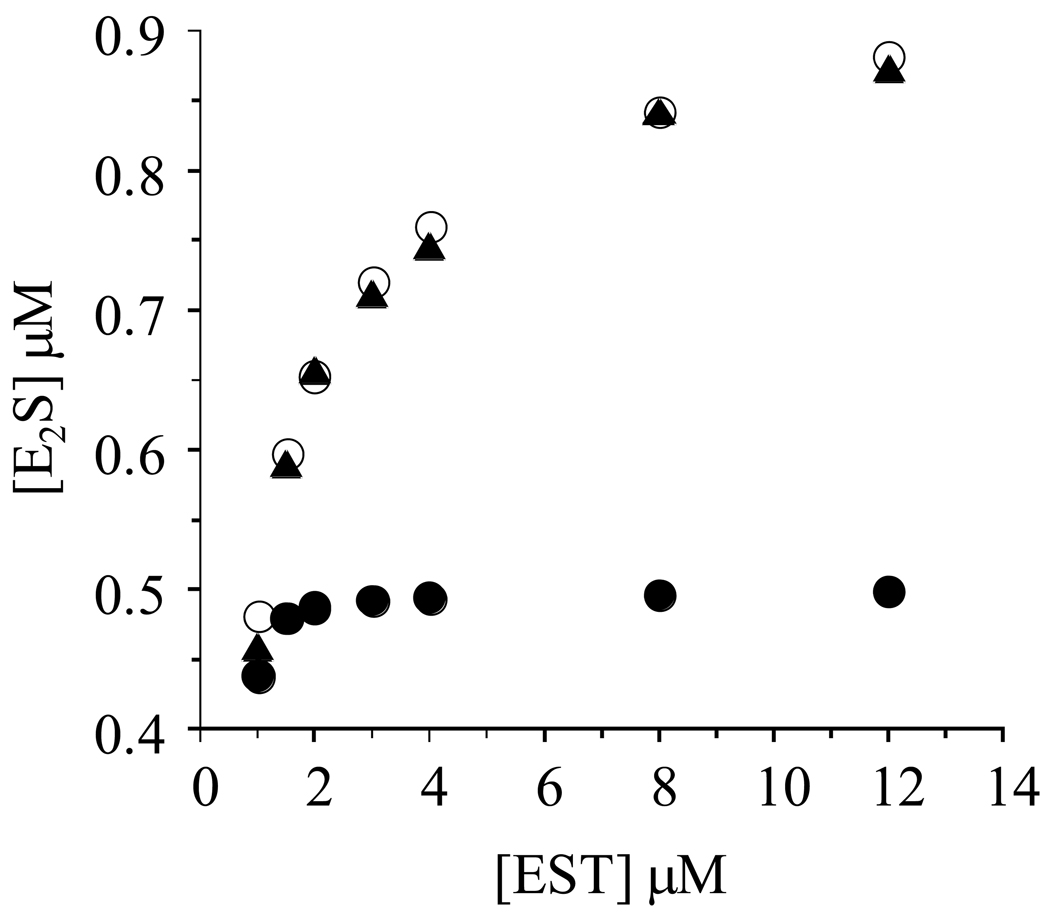
Figure 2. Confirmation of half-sites reactivity.
Reactions were initiated by mixing a solution containing PAPS (16 µM), glycerol (10% v/v), MgCl2 (7.0 mM), DTT (1.0 mM), and 50 mM KPO4 (pH 6.3) with an equal volume of an identical solution that did not contain PAPS, but did contain [3H]E2 (2 µM) and various concentrations of EST (2.0, 3.0, 4.0, 6.0, 8.0, 16.0, 24.0 µM - monomer concentrations). The plotted E2S concentrations represent the E2S formed in reactions quenched at 0.30 sec - at this time-point, the burst is essentially complete and steady-state turnover contributes only slightly to overall product formation (see Figure 1). Triangles (▲) represent experimentally determined [E2S]; open circles (o) represent [E2S] predicted using a half-site reactivity model in which Keq int ≫ 1.0; closed circles (•) represent [E2S] predicted using a full-site reactivity model with Keq int ~ 1.0. The simulations are described in Materials and Methods. Quenching and quantitation were as described in the Fig.1 legend (also, see Materials and Methods). Experimental values were determined in triplicate and averaged. All solutions were equilibrated at 25 (± 2) °C prior to mixing.

